
Waiting for lower timeframe confirmation is our main tool to confirm strength within higher timeframe zones, and has really been the key to our trading success. It takes a little time to understand the subtle nuances, however, as each trade is never the same, but once you master the rhythm so to speak, you will be saved from countless unnecessary losing trades. The following is a list of what we look for:
- A break/retest of supply or demand dependent on which way you’re trading.
- A trendline break/retest.
- Buying/selling tails/wicks – essentially we look for a cluster of very obvious spikes off of lower timeframe support and resistance levels within the higher timeframe zone.
We typically search for lower-timeframe confirmation between the M15 and H1 timeframes, since most of our higher-timeframe areas begin with the H4. Stops are usually placed 1-3 pips beyond confirming structures.
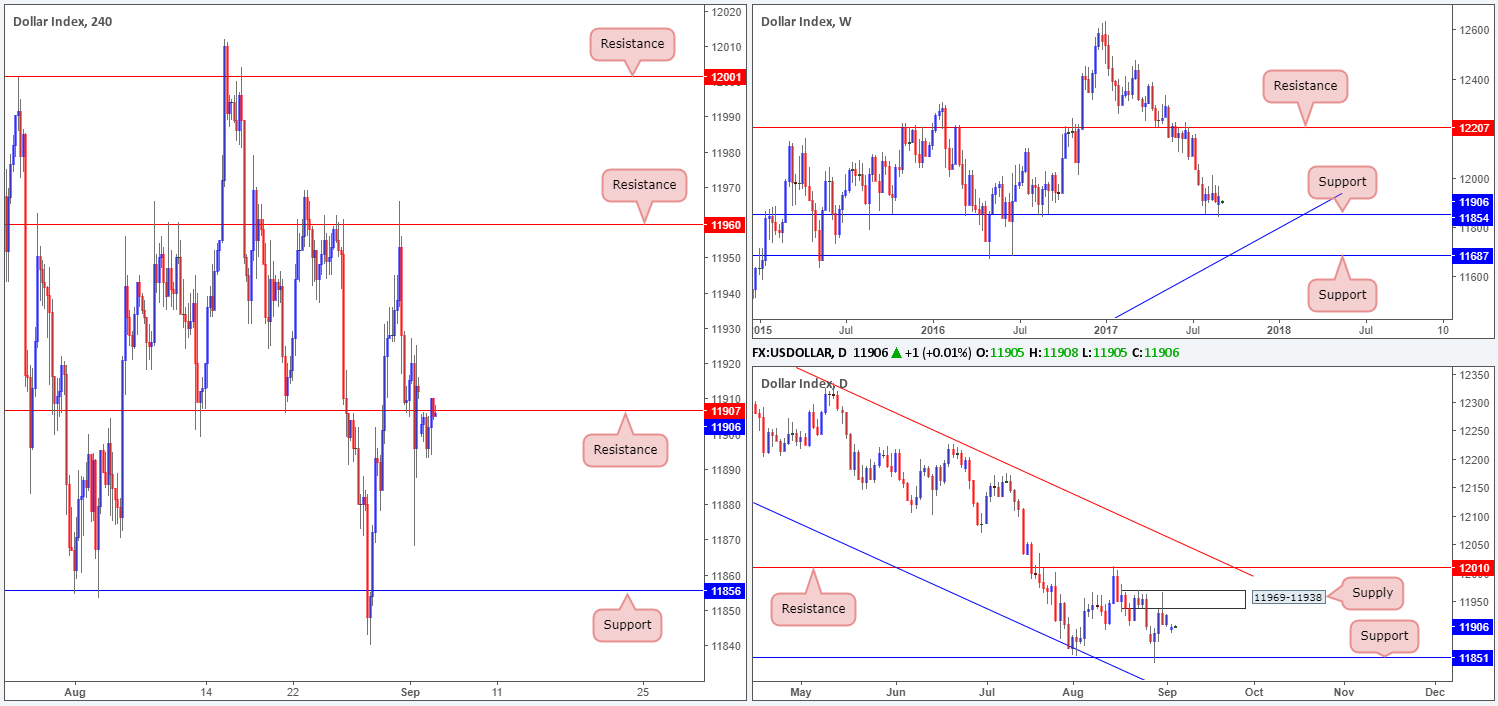
US dollar index (USDX):
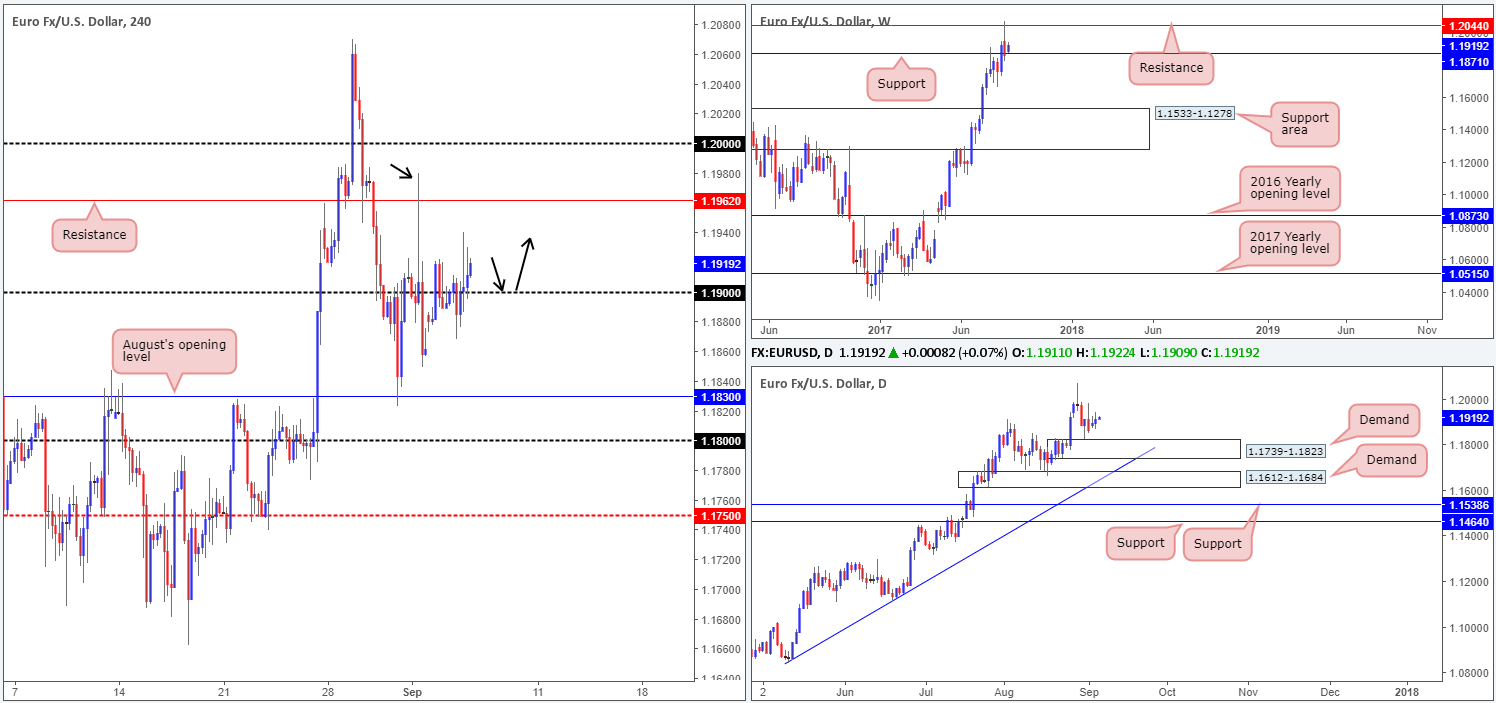
EUR/USD:
Despite the EUR gapping 20 pips north at the open, trading was light yesterday as US markets were closed in observance of Labor Day. With that being the case, much of the following report will echo thoughts put forward in Monday’s analysis.
Weekly price is seen trading marginally above support at 1.1871, after a strong succession of sell orders poured over this market last week. Also interesting to see is the USDX weekly support at 11854 held firm last week and printed a weekly indecision candle.
Down on the daily timeframe, we can see that demand at 1.1739-1.1823 came into play on Thursday (USDX daily supply also came into view on Thursday at 11969-11938). A violation of this area could send the unit down to a demand positioned at 1.1612-1.1684, which happens to fuse nicely with a trendline support fixed from the low 1.0839.
Suggestions: With H4 price seen trading a tad below the 1.19 handle as we write, the next levels of support to have an eyeball on are August’s opening level at 1.1830, followed closely by the 1.18 boundary. Technically speaking though, these levels offer very little, as lurking just below is a H4 Harmonic Gartley reversal zone (PRZ) marked in green at 1.1725/1.1752. Not only does this area boast a H4 mid-level support at 1.1750 and a 161.8% H4 Fib ext. point at 1.1725 (taken from the high1.2070), it is also located around the lower limits of the daily demand mentioned above at 1.1739-1.1823.
As far as we see things, there are two options here:
- Place a pending order at 1.1750 and position the stop below the X point of the Harmonic formation at 1.1660.
- Wait for H4 price to connect with the PRZ and let the H4 candles prove buyer intent. Personally, we look for at least a full, or near-full-bodied bullish to materialize before pulling the trigger. Should this come to fruition, stops can either be placed beyond the candle’s tail (aggressive), or a few pips outside of the PRZ.
Data points to consider: FOMC members Brainard (1pm), Kashkari (6.10pm) and Kaplan (11.05pm GMT+1) all take the stage today.
Levels to watch/live orders:
- Buys: 1.1725/1.1752 ([waiting for a reasonably sized H4 bullish candle to form – preferably a full, or near-full-bodied candle – is advised] stop loss: ideally beyond the candle’s tail).
- Sells: Flat (stop loss: N/A).
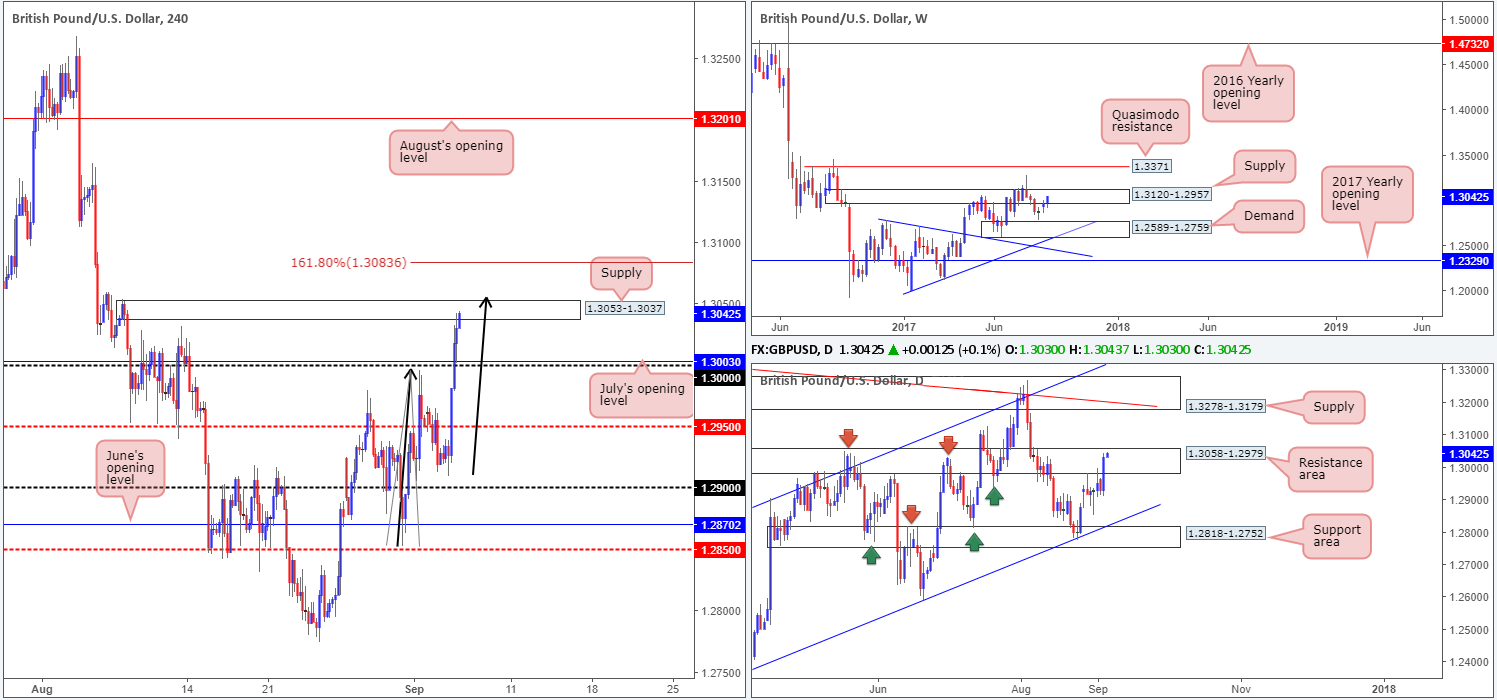
GBP/USD:
Shortly after the market opened, GBP/USD bulls managed to find a temporary foothold around the H4 mid-level support at 1.2950. As you can probably see though, this was relatively short lived as the British pound came under pressure during yesterday’s American session and ended the day clocking a low of 1.2912.
From the weekly timeframe, we can see that price remains teasing the underside of a supply base coming in at 1.3120-1.2957. Should the USDX weekly support at 11854 continue to bid prices higher this week, this could bolster weekly sellers from the current supply zone, and eventually send the unit back down to demand penciled in at 1.2589-1.2759. In conjunction with the weekly timeframe, daily price recently connected with a resistance area at 1.3058-1.2979 which has, so far, done a superb job in holding back the bulls. Given its strong history dating back to mid-May, we feel this zone will continue to provide resistance and ultimately push cable down to the support area seen below at 1.2818-1.2752 that converges with a channel support line taken from the low 1.2365.
Suggestions: At current price, we do not see much to hang our hat on as far as trading setups go. Despite this, we still have a keen interest in trading from 1.30. Not only because it is a large psychological level that the majority of the market is likely watching and is positioned within both of the said higher-timeframe resistances, but also due to it converging with a H4 supply at 1.3022-1.3000 and July’s opening level at 1.3003.
Watch for H4 price to challenge the noted H4 supply. In the event that the market prints a reasonably sized full, or near-full-bodied H4 bearish candle from this region, a sell from here is valid, in our opinion.
Data points to consider: UK Services PMI at 9.30am. FOMC members Brainard (1pm), Kashkari (6.10pm) and Kaplan (11.05pm GMT+1) all take the stage today.
Levels to watch/live orders:
- Buys: Flat (stop loss: N/A).
- Sells: 1.3022-1.3000 ([waiting for a reasonably sized H4 bearish candle to form – preferably a full, or near-full-bodied candle – is advised] stop loss: ideally beyond the candle’s wick).
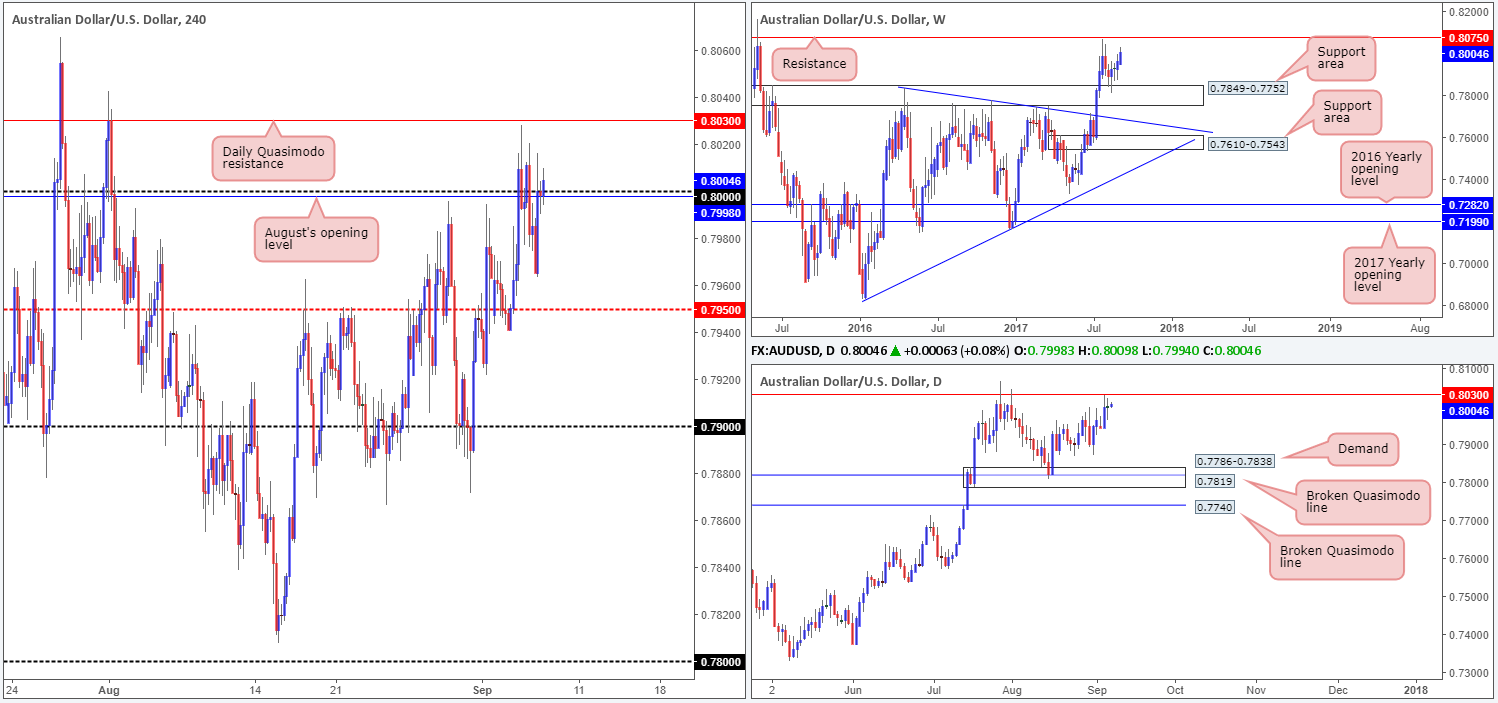
AUD/USD:
The AUD/USD started the week at 0.7947, slightly lower than Friday’s close at 0.7963. The commodity currency found early support from the H4 mid-level support at 0.7950 and, as you can see, swiftly filled the weekend gap. It was from here though that things turned sour for the bulls, with the pair eventually seen closing beyond 0.7950. Apart from this though, there was little change to the market’s structure on Monday.
Since weekly price linked with the support area at 0.7849-0.7752 three weeks ago, the unit has remained reasonably well-bid. The next objective, assuming that price continues to push north, can be seen around resistance drawn from 0.8075. Before weekly action can reach the noted resistance, however, it may be worth noting that daily price must first consume both Quasimodo resistances seen at 0.7980/0.8030.
Although the current daily Quasimodo resistance at 0.7980 could potentially drag the pair lower today, we still really like the look of the large psychological level planted just above it at 0.80, due to the following converging structures:
- August’s opening level at 0.7998.
- A H4 Quasimodo resistance level at 0.8007.
- A H4 161.8% Fib ext. point at 0.8008.
Suggestions: A short from the green H4 sell zone is, in our technical opinion, appealing, given its confluence. Still, to trade this area, we would ideally want to see H4 price whipsaw through the current daily Quasimodo resistance and test the zone in the shape of a pin bar, and ultimately close on/near its low (as drawn on the H4 chart). The reason we require this candle confirmation is due to both the risk of a fakeout being seen up to the daily Quasimodo resistance at 0.8030, and weekly price currently showing room to extend up to weekly resistance at 0.8075.
Data points to consider: Reserve Bank of Australia policy decision at 5.30am and RBA Gov. Lowe speaks at 10.10am. FOMC members Brainard (1pm), Kashkari (6.10pm) and Kaplan (11.05pm GMT+1) all take the stage today.
Levels to watch/live orders:
- Buys: Flat (stop loss: N/A).
- Sells: 0.8008/0.7998 ([ideally we want to see price whipsaw through the current daily Quasimodo resistance and test the zone in the shape of a H4 bearish pin bar] stop loss: either beyond the candle’s wick or above 0.8008).
USD/JPY:
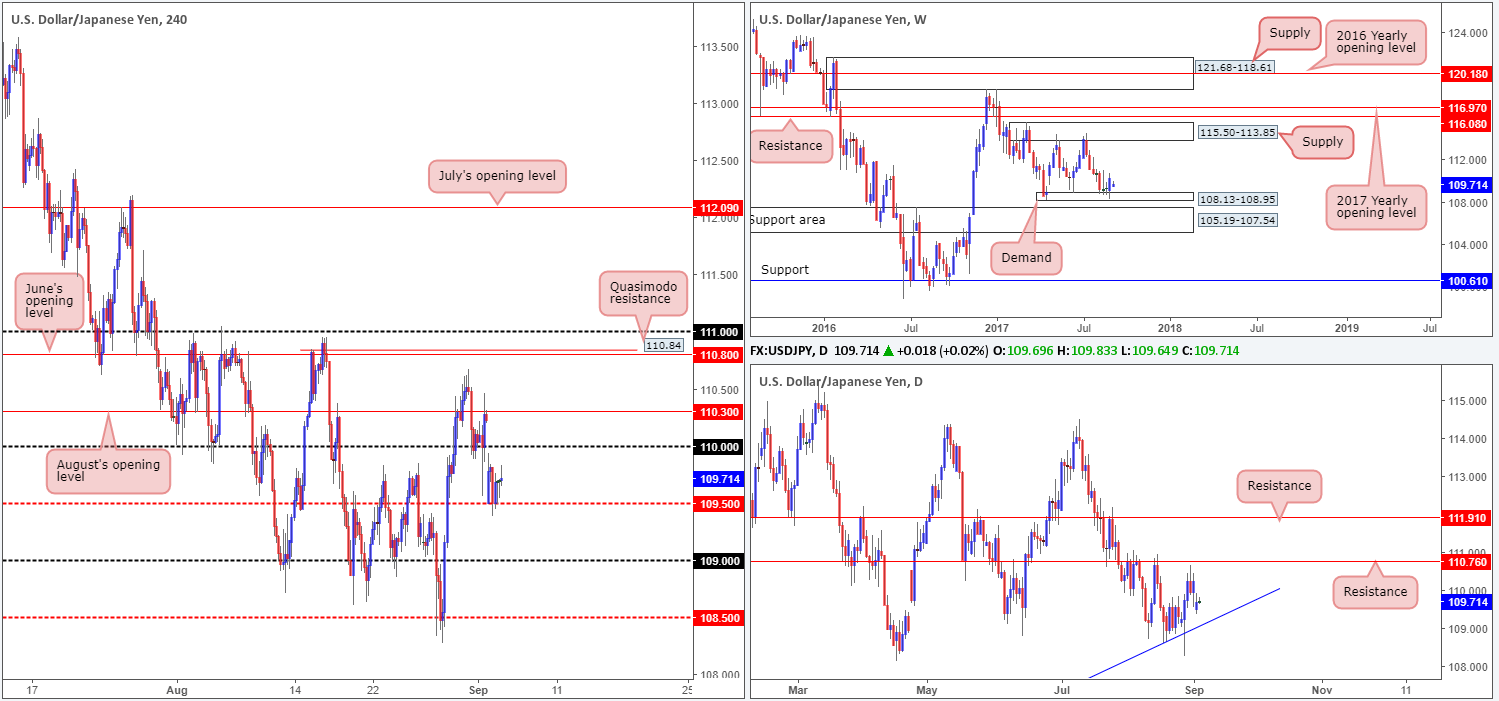
USD/JPY opened the week sporting a rather substantial gap south in response to a nuke test by North Korea. The pair, however, found a floor of support at 109.50 following this move and then proceeded to enter into a phase of consolidation as US banks were closed in observance of Labor Day.
Looking over to the weekly timeframe, we can see that USD/JPY bulls went on the offensive from weekly demand at 108.13-108.95 last week and printed a strong-looking weekly bullish engulfing candle. The move from this area could encourage further buying this week and propel the unit up to within striking distance of a supply area formed at 115.50-113.85. Over on the daily timeframe, however, the buyers and sellers are seen trading mid-range between a resistance level pegged at 110.76 and a trendline support extended from the low 100.08.
Suggestions: At current price, we see very little to hang our hat on as far as technical setups go. Entering long, as the weekly timeframe suggests, would place you in direct conflict with the 110 handle, followed closely by August’s opening level at 110.30. Similarly, a sell beyond 109.50 would position one against potential buyers from the aforementioned daily trendline support.
Given the above structure, remaining on the sidelines may be the best course of action today.
Data points to consider: FOMC members Brainard (1pm), Kashkari (6.10pm) and Kaplan (11.05pm GMT+1) all take the stage today.
Levels to watch/live orders:
- Buys: Flat (stop loss: N/A).
- Sells: Flat (stop loss: N/A).
USD/CAD:
Trade was quiet on Monday as US and Canadian banks were closed in observance of Labor Day. After breaking above the 1.24 handle in early (London) trading, price entered into a tight consolidation of around 20 or so pips. Given this somewhat lackluster performance, much of the following report will have a similar bias to Monday’s outlook…
The USD/CAD managed to retain its offered tone last week, after weekly price hammered its way through a long-term weekly trendline support extended from the low 0.9633. Technically speaking, this has likely set the stage for further selling this week at least until we reach weekly demand penciled in at 1.2127-1.2309. The story on the daily timeframe reveals that the bears did not make a stand until Thursday’s segment, after topping around the 1.2662 neighborhood. The drop from here, shaped by two reasonably decisive bearish candles, brought the unit into the jaws of a demand base drawn from as far back as June 2015 at 1.2303-1.2423.
Suggestions: To our way of seeing things right now, the H4 close above 1.24 has potentially confirmed upside to H4 mid-level resistance1.2450/H4 supply at 1.2491-1.2461. In addition, this move has likely confirmed strength from the current daily demand area. Still, we would not feel comfortable buying this market above 1.24 due to weekly price showing room to drive lower.
In light of the recent move above 1.24, we do not see anything of interest in this market for the time being.
Data points to consider: FOMC members Brainard (1pm), Kashkari (6.10pm) and Kaplan (11.05pm GMT+1) all take the stage today.

Levels to watch/live orders:
- Buys: Flat (stop loss: N/A).
- Sells: Flat (stop loss: N/A).
USD/CHF:
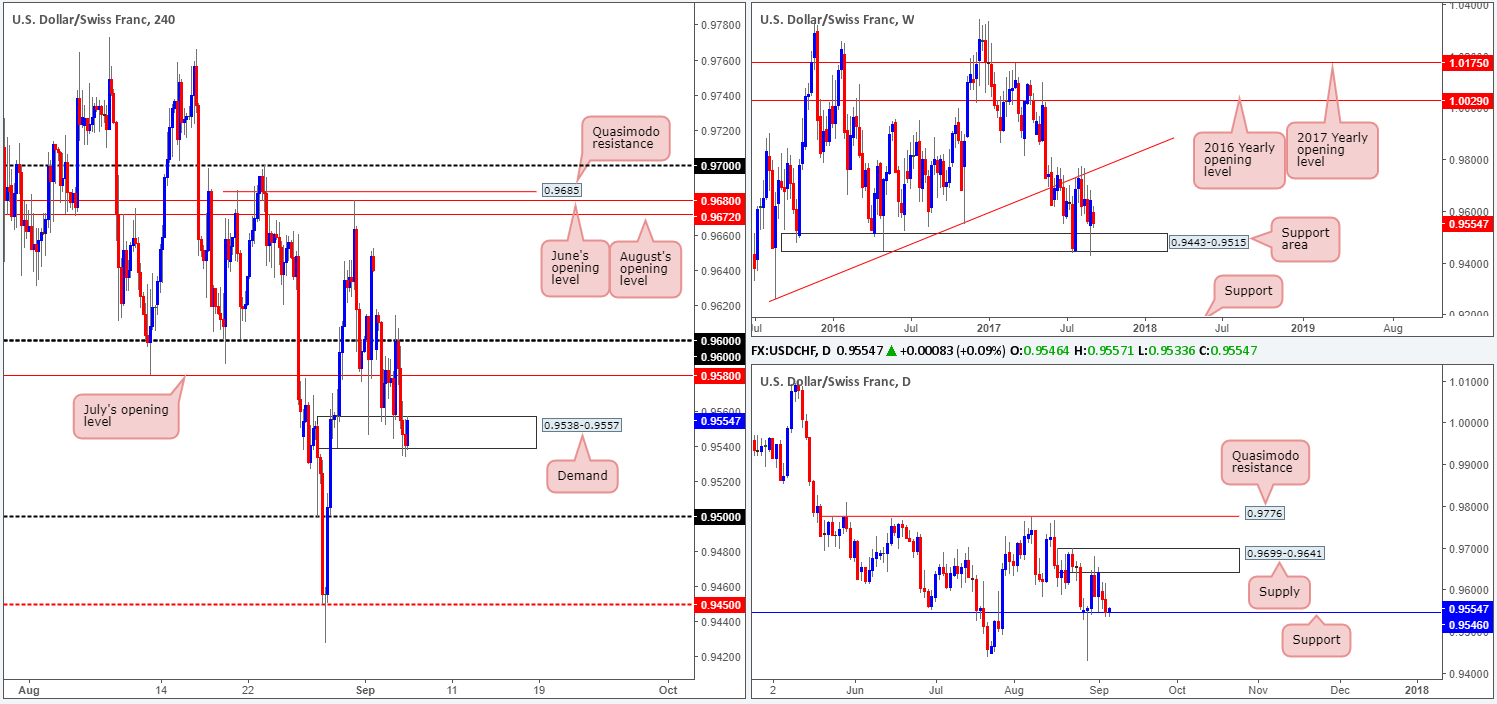
News of North Korea testing a nuke over the weekend triggered a flight to safety on Monday, with opening price gapping 46 pips south. The response from the 0.96 handle was soft and thereby led to further selling amid London trading, which saw price shake hands with H4 demand marked at 0.9538-0.9557. Due to US banks being closed in observance of Labor Day, a light US trading session saw the unit consolidate losses around the top edge of the said H4 demand.
Looking over to the bigger picture, weekly price turned higher last week after crossing swords with a support area at 0.9443-0.9515. Seeing as the USDX also bounced from weekly support at 11854, dollar buying on the Swissy could lead to price retesting the trendline resistance extended from the low 0.9257. Daily price on the other hand is somewhat restricted at the moment. To the upside, we have nearby supply lodged at 0.9699-0.9641 (daily supply also seen on the USDX at 11969-11938) that held price lower on Thursday. And to the downside, there’s neighboring support marked at 0.9546, which converges nicely with a channel support line etched from the low 0.9438.
Suggestions: Owing to July’s opening level lurking directly above current price at 0.9580, followed closely by the 0.96 handle, entering long is out of the question until we break above these levels. Unfortunately, even with this break we still have only 40 or so pips to play with before we reach the underside of the daily supply base!
Similarly, a sell beyond the current H4 demand leaves one less than 40 pips of room until the 0.95 handle. This – coupled with the prospect of daily buying from support at 0.9546 makes a sell just as challenging as trying to buy this market. Therefore, opting to remain on the sidelines here may very well be the best path to take today.
Data points to consider: FOMC members Brainard (1pm), Kashkari (6.10pm) and Kaplan (11.05pm GMT+1) all take the stage today.
Levels to watch/live orders:
- Buys: Flat (stop loss: N/A).
- Sells: Flat (stop loss: N/A).
DOW 30:
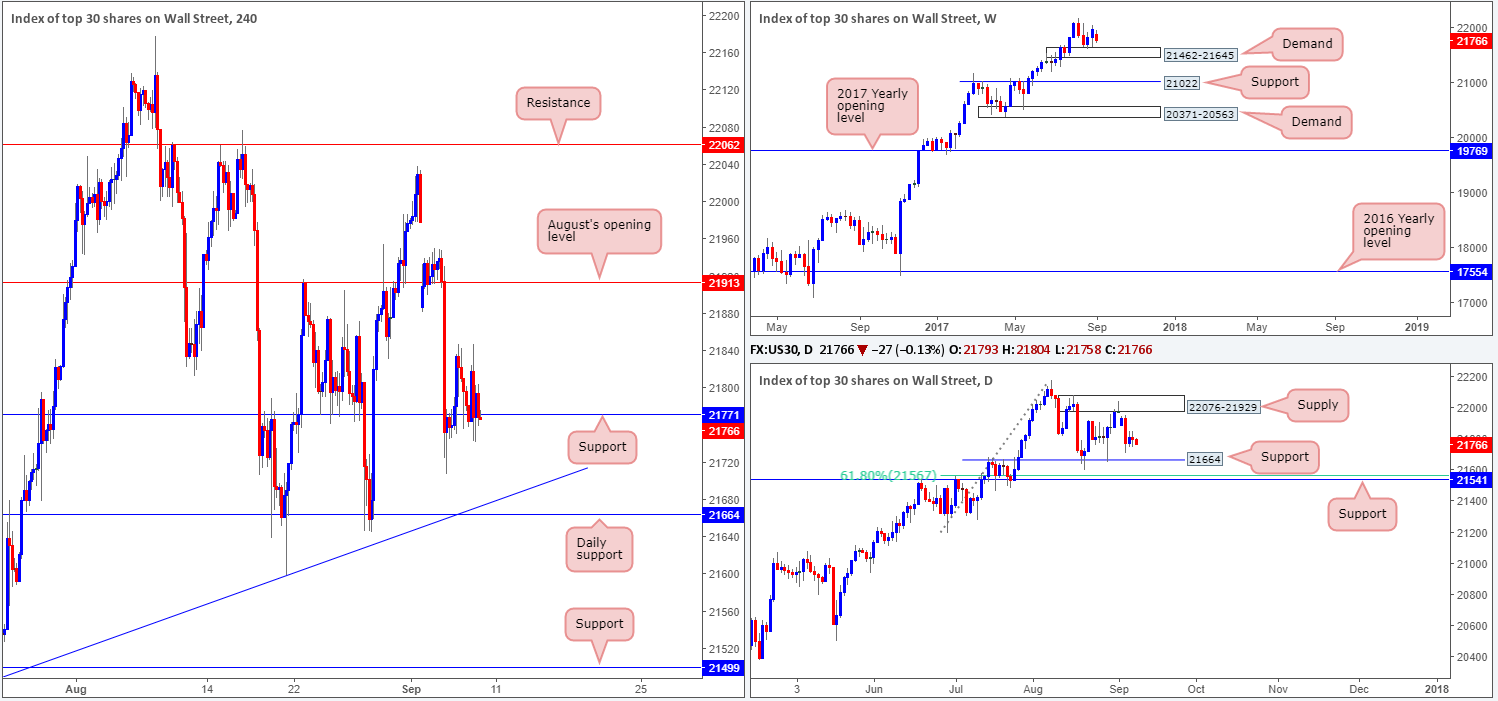
US shares were down 91 points on Monday morning following North Korea’s latest nuke test. Despite this, H4 price found immediate refuge around August’s opening level formed at 21913 and remained bolstered from here throughout the remainder of the day, as US banks were closed in observance of Labor Day.
Bouncing over to the weekly picture, as mentioned in Monday’s report, the index extended its bounce from weekly demand at 21462-21645 last week, finishing near its highs. With little overhead resistance to contend with on the weekly timeframe, a fresh record high could be achieved this week! Conversely, however, daily flow recently crossed paths with supply at 22076-21929, and chalked up a nice-looking selling wick into the week’s end. While this supply boasts strong momentum and could send the index lower this week, let’s keep in mind where weekly price is trading from!
Our suggestions: With a clear difference of opinion currently being seen on the higher timeframes (see above), traders are in a somewhat precarious position right now. A long from August’s opening level is high-probability according to the weekly scale, but ill-advised from a daily perspective. A sell below this monthly level on the other hand looks appealing from the daily timeframe, but chancy on the weekly timeframe!
Given the above factors, our team will remain on the sidelines for the time being.
Data points to consider: FOMC members Brainard (1pm), Kashkari (6.10pm) and Kaplan (11.05pm GMT+1) all take the stage today.
Levels to watch/live orders:
- Buys: Flat (stop loss: N/A).
- Sells: Flat (stop loss: N/A).
GOLD:
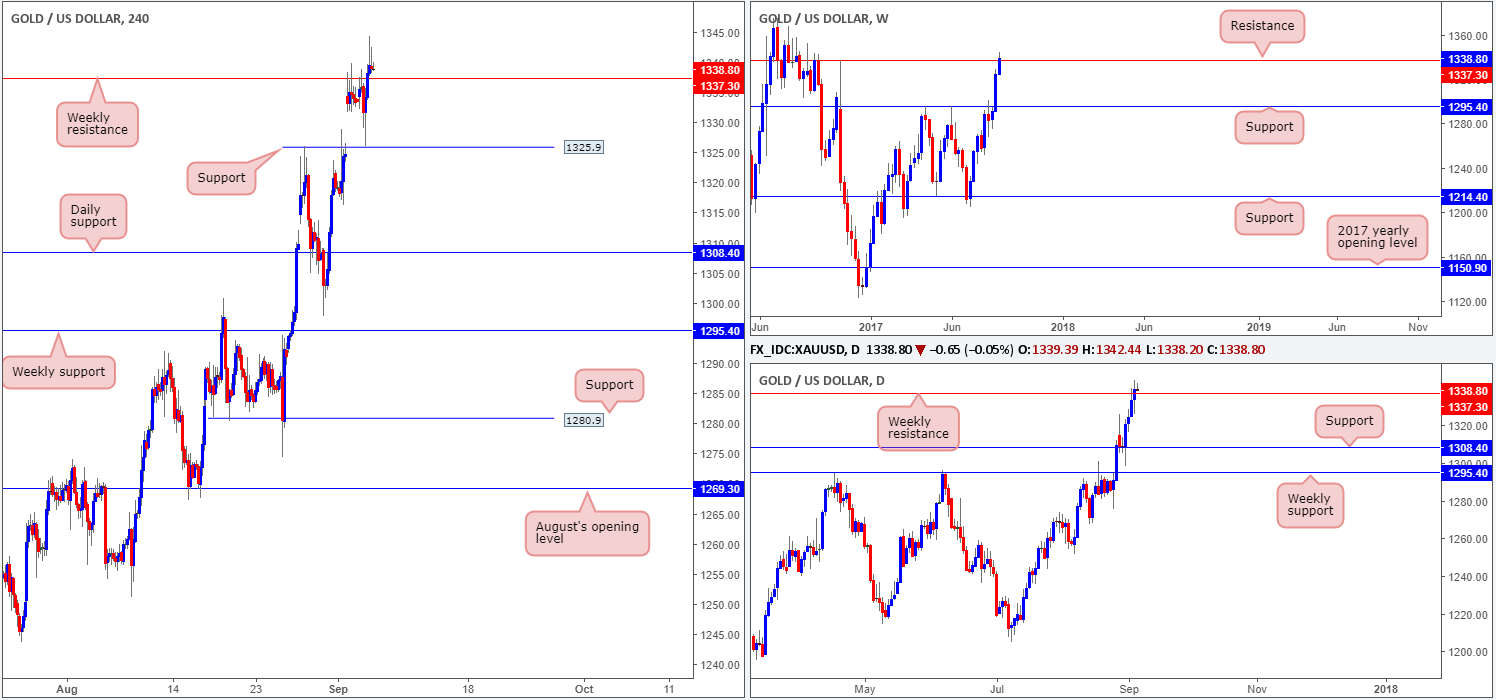
Safe-haven assets, including that of the precious metal, advanced on Monday with opening price aggressively gapping north up to weekly resistance at 1337.3. The move came in response to recent nuke tests from North Korea.
With price seen trading from a weekly resistance at the moment, our immediate thoughts are to fade gold as the weekly level has been in play since mid-2013. However, given that the approach to the level was incredibly strong, it may be prudent to wait for additional confirmation before pulling the trigger. Usually, we would be looking at the H4 candles for evidence of seller intent. However, due to this level being set on the weekly scale, the team has opted to wait for confirmation on the daily timeframe instead.
Our suggestions: A daily bearish candle formed from the current weekly resistance in the shape of a full, or near-full-bodied candle would, in our view, be enough to validate a short, targeting daily support at 1308.4. Nevertheless, a H4 close beyond H4 support at 1325.9 could be used as a worthy trigger to reduce risk to breakeven.
Levels to watch/live orders:
- Buys: Flat (stop loss: N/A).
- Sells: 1337.3 region ([waiting for a daily bearish candle to form in the shape of a full, or near-full-bodied candle is advised] stop loss: ideally beyond the candle’s wick).


