
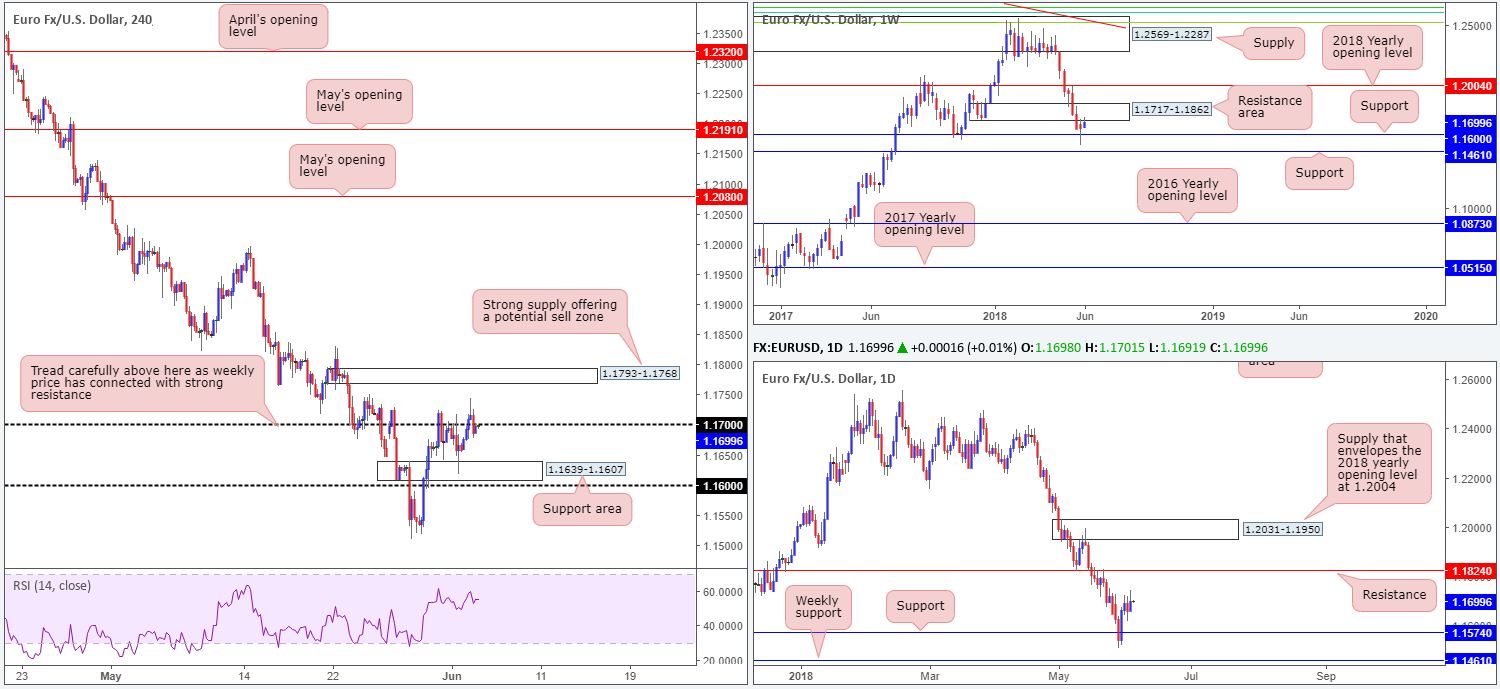
EUR/USD:
Coming into the early hours of London on Monday, we witnessed H4 price easily clear the 1.17 handle and ultimately go on to clock fresh highs of 1.1744. Despite this, US traders failed to build on earlier gains and forced the pair south, eventually reclaiming 1.17 at the close.
Technically speaking, the reason behind price failing to gravitate higher is likely due to price connecting with the underside of a weekly resistance area at 1.1717-1.1862. For those who read Monday’s report you may recall this was a noted move to be watchful of. Meanwhile, daily action is seen hovering between support drawn from 1.1574 and resistance coming in at 1.1824. It may be worth noting that the aforementioned support also denotes represents an ignored daily Quasimodo support.
Areas of consideration:
The underside of the noted weekly resistance area may continue to weigh on the buyers this week. As such, we still feel that initiating long trades above the 1.17 handle on the H4 remains a venturesome move.
In the event that the euro does gain momentum against its US counterpart, however, eyes will likely be on the H4 supply area drawn from 1.1793-1.1768 for potential shorts. Not only does the zone boast strong momentum to the downside, it is also positioned within the walls of the noted weekly resistance area. The only caveat here is the possibility of a fakeout above this area towards the daily resistance mentioned above at 1.1824.
Should H4 movement manage to hold sub 1.17, intraday sellers may look to take advantage of this move since there’s little support visible until reaching the H4 support area at 1.1639-1.1607.
Today’s data points: German Buba President Weidmann speaks; US ISM non-manufacturing PMI.
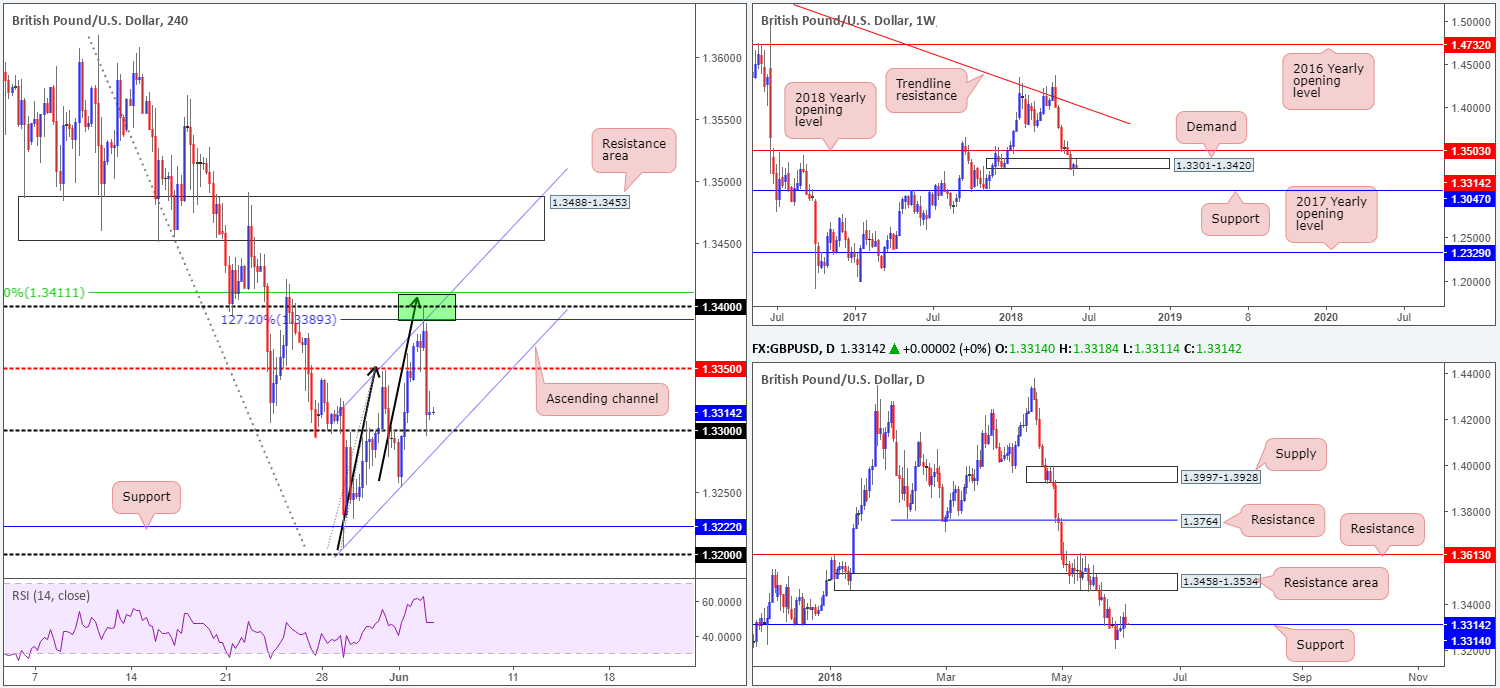
GBP/USD:
The aftermath of Monday’s upbeat UK construction PMI drove prices skyward. Finding support off the H4 mid-level number 1.3350, the pair eventually shook hands with the 1.34 neighborhood.
For those who read Monday’s report you may recall the team highlighting this number, along with the H4 AB=CD formation (see black arrows) as a possible sell zone (marked in green). Comprised of a 127.2% H4 Fib ext. point at 1.3389, the 1.34 handle, a H4 channel resistance taken from the high 1.3347, and a 50.0% resistance value at 1.3411, the market respected this area beautifully, dropping in excess of 100 pips toward 1.33. Comments from BOE’s Tenreyro in late European trade did little to help sterling bounce, as she more-or-less maintained her stance that policy is contingent on incoming data, and there is still scope for patience.
Having a look at higher-timeframe structure shows weekly price to be struggling within the walls of its demand base at 1.3301-1.3420. A decisive push beneath here could set the stage for a continuation move lower to weekly support at 1.3047. Daily price, on the other hand, is currently reconnecting with support at 1.3314, thanks to yesterday’s round of selling. A move lower from this point has the daily support level at 1.3063 to target (positioned just north of the weekly support mentioned above at 1.3047).
Areas of consideration:
Supporting the buyers right now is the 1.33 handle, the daily support at 1.3314 and a somewhat fragile weekly demand at 1.3301-1.3420. However, judging by the lackluster effort off 1.33 (H4 candles) thus far indicates little interest in taking things higher at the moment.
Further selling, for our team, will be confirmed on the break of the H4 channel support taken from the low 1.3204.
Right now, neither a long nor short seems attractive.
Today’s data points: UK services PMI; MPC Member Cunliffe speaks; US ISM non-manufacturing PMI.
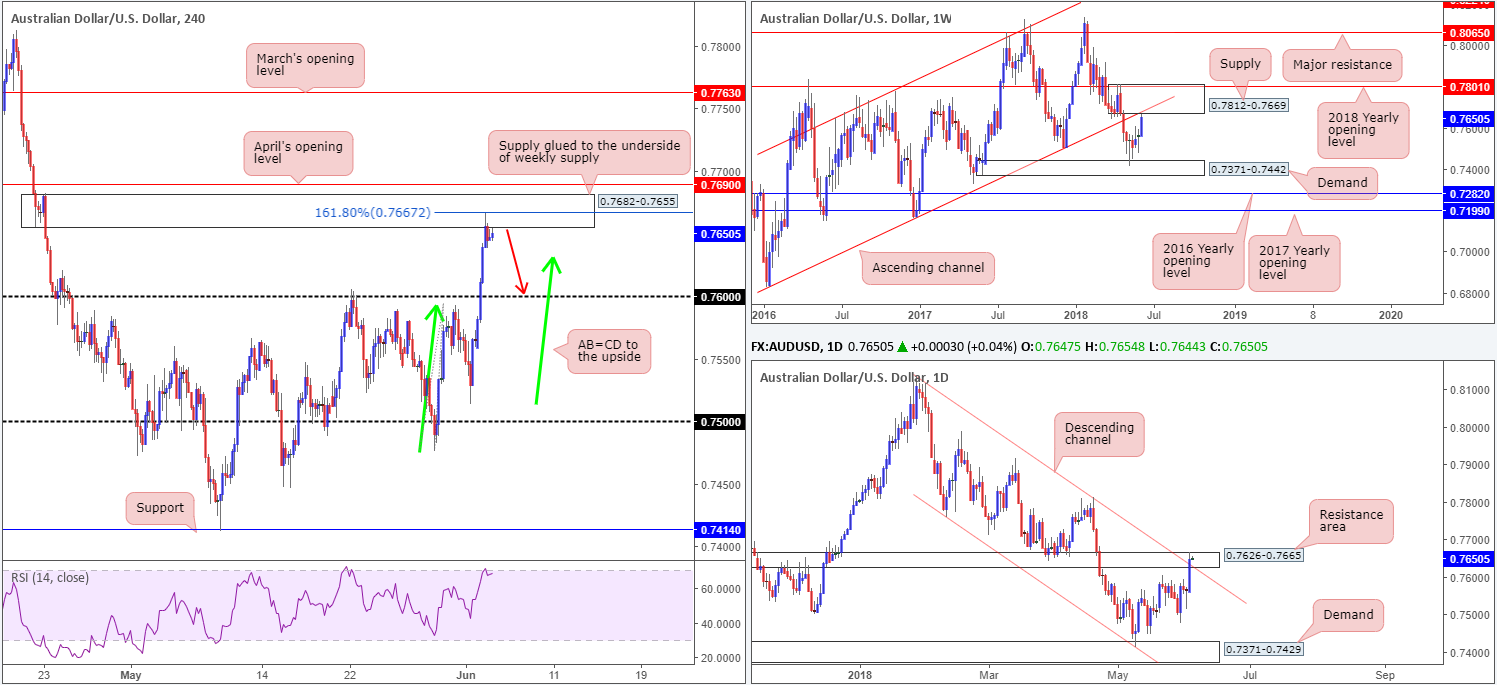
AUD/USD:
The Australian dollar put in a solid shift on Monday, lifting nearly 100 pips throughout the day. Market sentiment swung positive in early trade on Monday following the release of upbeat Aussie retail sales figures.
As is evident from H4 structure, price climbed above the 0.76 threshold and eventually connected with a H4 supply seen at 0.7682-0.7655. Not only is this area seen glued to the underside of weekly supply at 0.7812-0.7669 and its intersecting weekly channel support-turned resistance (extended from the low 0.6827), we can see additional resistance coming in from the daily timeframe around 0.7626-0.7665. Also worthy of note is the approach on the H4 is shaped in the form of a H4 AB=CD that completes around the 161.8% H4 Fib ext. point at 0.7667!
Areas of consideration:
Apart from a minor breach of the daily channel resistance drawn from the high 0.8135, market structure indicates a pullback could be in the works to at least 0.76, which could be of interest to traders today.
Swerving over to fundamentals, however, we can see that early Tuesday brings the RBA’s latest interest rate decision. The central bank is widely expected to remain unchanged as the Aussie economy struggles to develop growth. Nevertheless, this is certainly something to bear in mind should you consider engaging in shorts from the noted H4 supply.
Today’s data points: AUD current account; China’s Caixin services PMI; RBA rate statement and interest rate decision; US ISM non-manufacturing PMI.
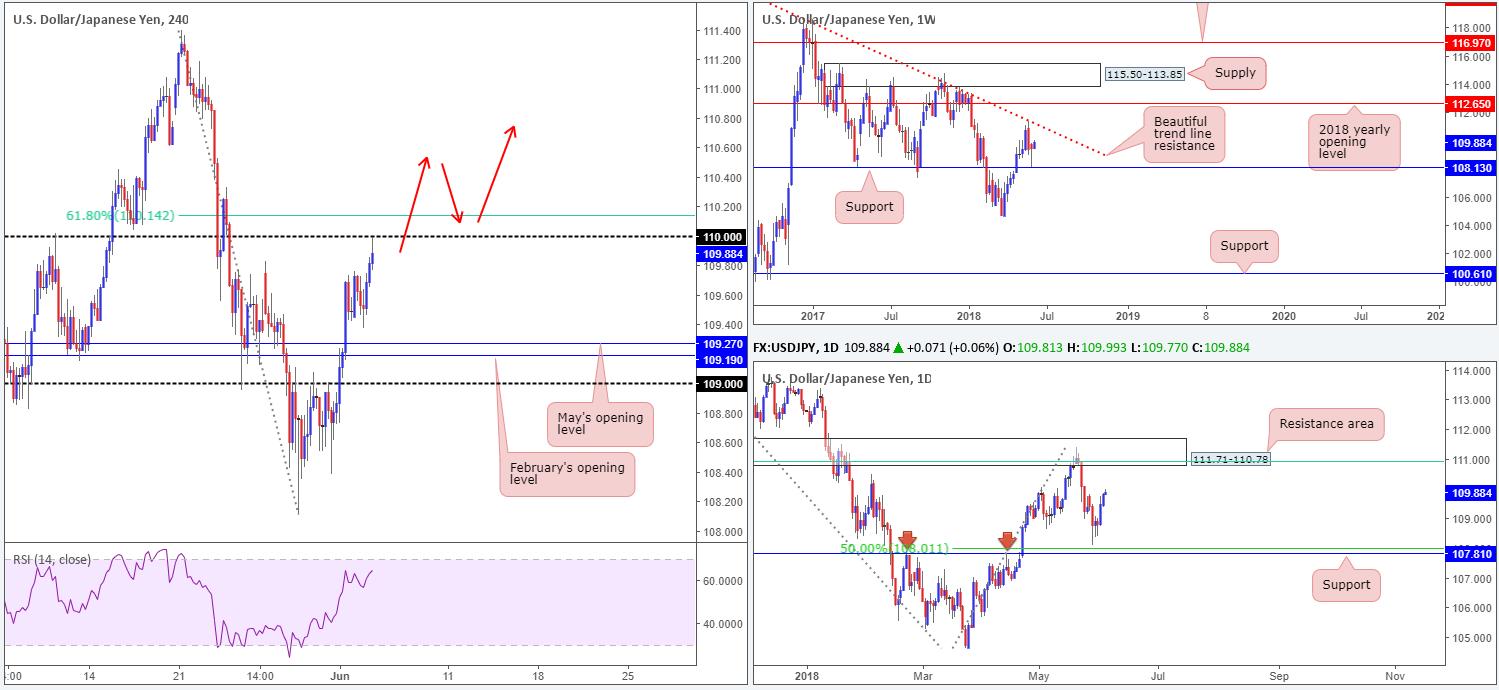
USD/JPY:
After spending Friday’s sessions confined within a tight 30-pip consolidation, USD/JPY bulls went on the offensive on Monday, allowing H4 price to connect with the 110 handle in recent trade. Apart from the 61.8% H4 Fib resistance seen at 110.14, there’s not a whole lot of resistance to stop price moving higher above 110.
Turning our attention to daily structure, the next port of call to the upside can be seen at 111.71-110.78: a strong resistance area that converges with a 61.8% daily Fib resistance value at 110.91 (green line). Further to this, we can also see that the daily area unites with long-term weekly trend line resistance extended from the high 123.67.
Areas of consideration:
Given the higher timeframes display possible intent to gravitate higher, selling from the 110 neighborhood is not really a trade we’d label high probability. Of course, that is not to say the level won’t hold, though!
Instead of looking for shorts, the team has noted that longs above the 110.14/110 region are worthy of attention. This is due to the space seen on the higher timeframes before reaching the daily resistance area mentioned above at 111.71-110.78.
An ideal setup, as far as we can see, would be for H4 price to decisively close above 110.14/110 and then retest the area as support in the shape of a full or near-full-bodied bull candle. A long on the close of this candle, with stops tucked below the tail could offer amazing risk/reward should your take-profit target be set at the underside of the noted daily resistance area!
Today’s data points: US ISM non-manufacturing PMI.
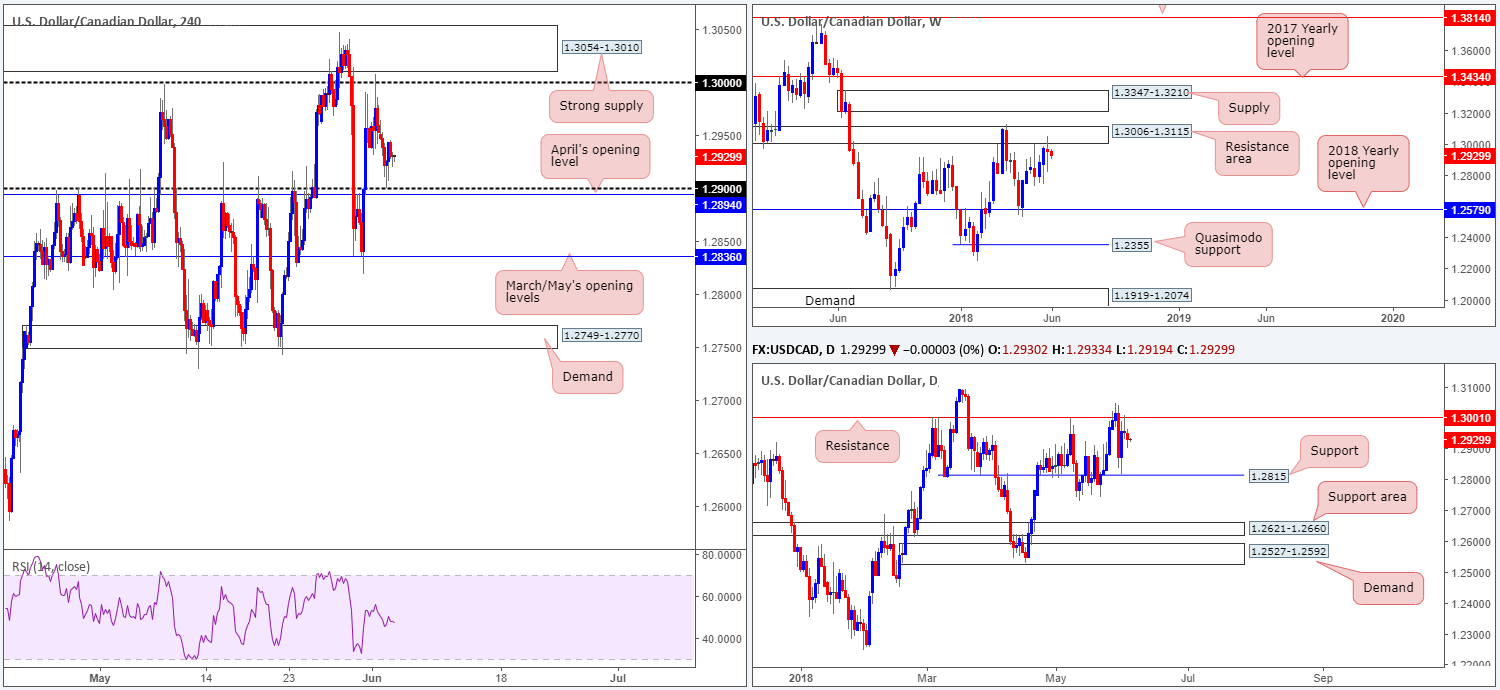
USD/CAD:
Coming in from the top this morning, it’s clear that weekly flow remains capped around the underside of a resistance area seen at 1.3006-1.3115. Should imbalance favor the bulls here this week, and a break of the current weekly resistance zone is seen, this will almost immediately bring weekly supply at 1.3347-1.3210 into the fray. On the other side of the spectrum, a selloff could see price action stretch as far south as the 2018 yearly opening level at 1.2579. In conjunction with weekly structure, the daily candles are seen interacting with resistance coming in at 1.3001. Providing a strong ceiling of resistance since March this year, on top of mild push to the downside yesterday, further selling could be in store. The next downside support target on the radar falls in at 1.2815, followed then by a daily support area at 1.2621-1.2660.
Across on the H4 timeframe, price action established support off of the 1.29 boundary amid a drop in oil prices on Monday, currently trading at 65.01. Note also that 1.29 has an additional layer of support nearby at 1.2894 in the form of April’s opening level. Should both levels give way, traders’ crosshairs will likely be fixed on March/May’s opening levels at 1.2836, which, as you can see, has served this market well thus far.
Areas of consideration:
Having noted that both weekly and daily price show potential to selloff, entering long from the 1.29 neighborhood is a venturesome move. To our way of seeing things, waiting and seeing if H4 price can close below 1.29 and retest the underside of this number as resistance is the way to go. A successful retest should be enough to draw in intraday sellers with an initial target objective set at 1.2836, followed by daily support priced in at 1.2815.
Today’s data points: US ISM non-manufacturing PMI.
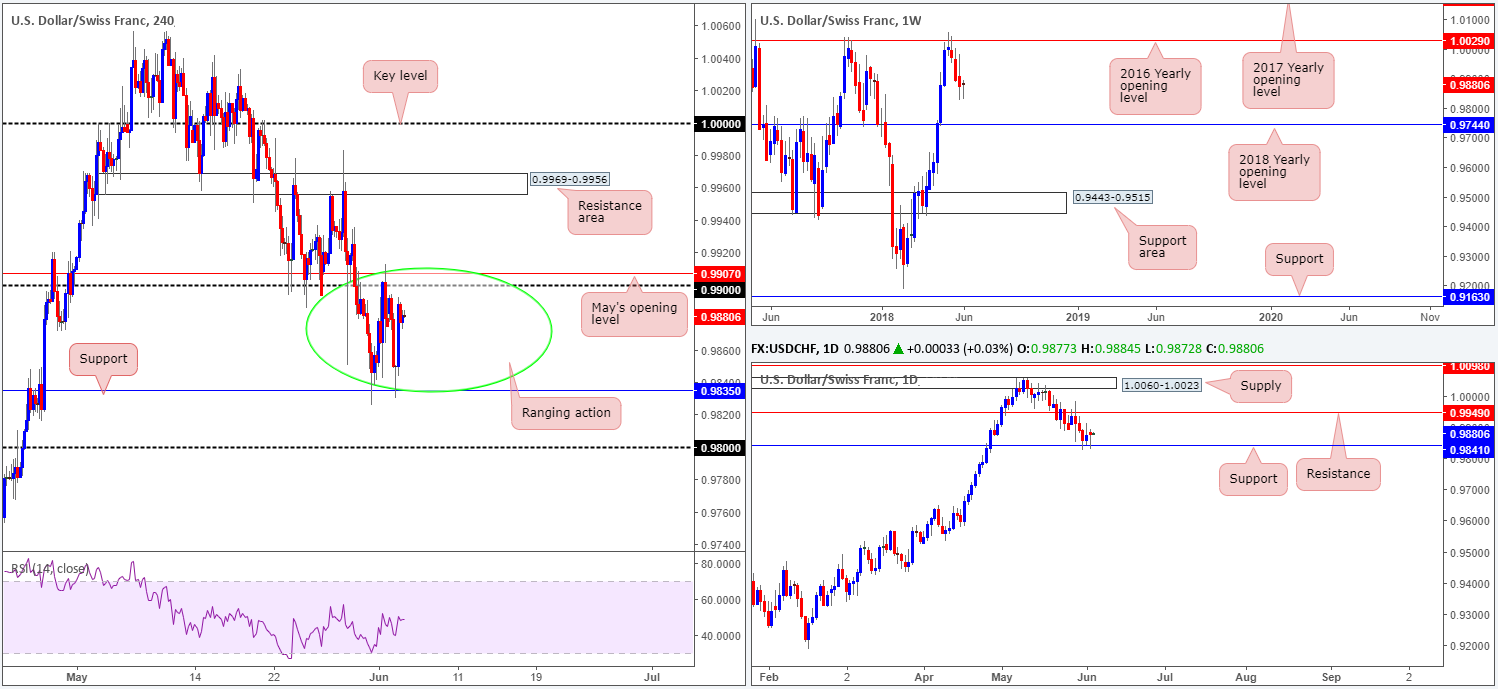
USD/CHF:
In recent trade, the USD/CHF entered into a consolidative phase between H4 support at 0.9835 and the 0.99 handle/May’s opening level at 0.9907. Surrounding structure on this scale falls in at the 0.98 handle and a H4 resistance zone coming in at 0.9969-0.9956.
Traders may have also noticed that supporting the lower edge of the H4 range is a daily support level seen at 0.9814. This level boasts historical significance stretching as far back as mid-2013. Therefore, it is not a barrier one should overlook! Contrary to this, though, weekly movement continues to reflect a bearish stance. The pair sustained further losses during last week’s action, marking the unit’s third consecutive weekly loss off the 2016 yearly opening level seen on the weekly timeframe at 1.0029. In terms of weekly structure, there’s really not very much support seen in view until the unit reaches the 2018 yearly opening level marked at 0.9744.
Areas of consideration:
Intraday, traders may look to the current H4 range for opportunity. We would, however, advise waiting for additional candle confirmation in the shape of a full or near-full-bodied candle rotation, be it on the H4 or H1 timeframe, before pulling the trigger. Stops are best placed beyond the candles rejection wick/tail and the take-profit target is best set at the opposite end of the range.
Longer term, this market is at conflict. Daily price suggests buying could be in store, whereas weekly action indicates that we could be in for further downside.
Today’s data points: US ISM non-manufacturing PMI.
Dow Jones Industrial Average:
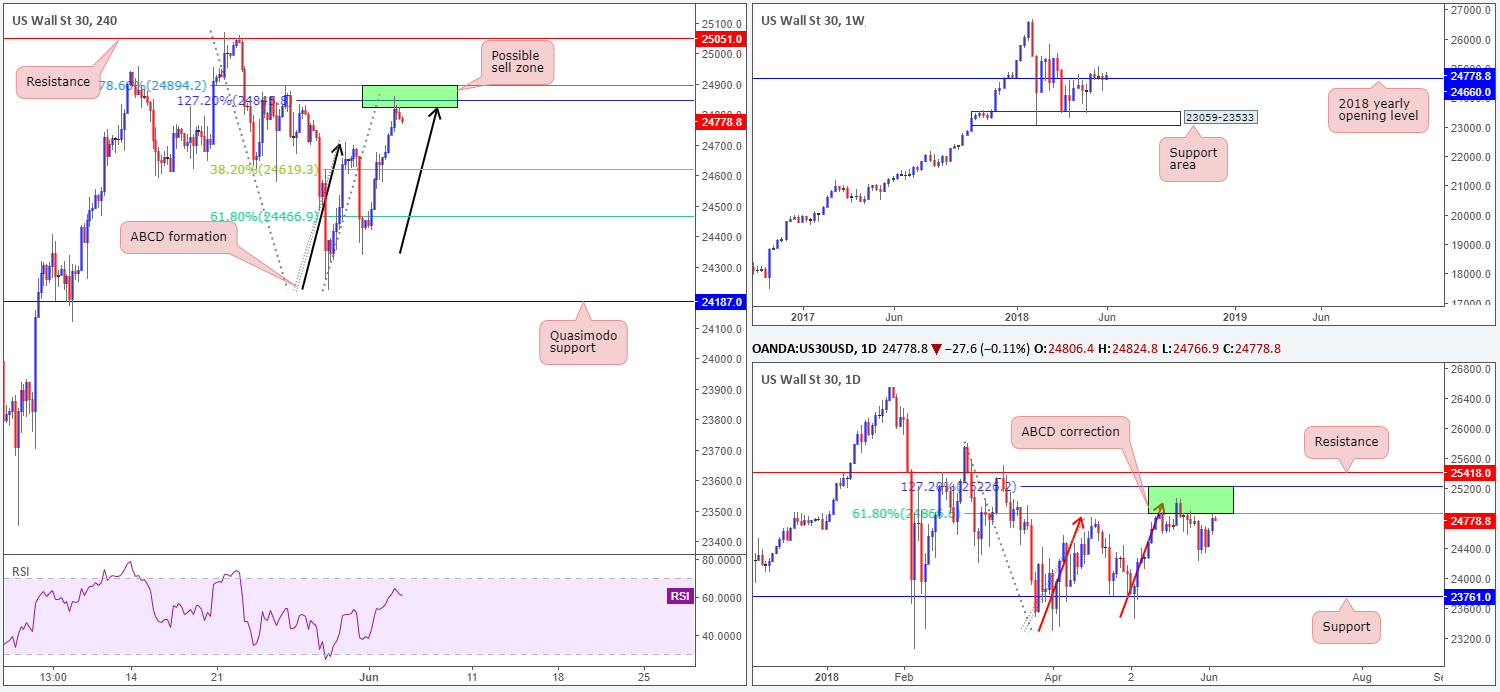
Friday’s risk-on mood clearly filtered through to Monday’s action, despite US/China trade war concerns and recently imposed US tariffs.
For those who read Monday’s report you may remember the team underlining 24894/24823 on the H4 timeframe as a possible area for shorts. Note the clear H4 127.2% ABCD (black arrows) approach at 24849, and the 78.6% H4 Fib resistance at 24894. As you can see, H4 price struck this zone in recent trade and has so far held firm.
What’s also notable from a technical perspective is the 25229/24866 area seen on the daily timeframe bolstering the top edge of the H4 sell zone. The daily area marked in green is comprised of a 61.8% daily Fib resistance value and a daily 127.2% ABCD (see red arrows) daily Fib ext. point. The only grumble for sellers here is the fact that weekly price is seen attempting to reclaim the 2018 yearly opening level at 24660.
Areas of consideration:
Those who are short the ABCD completion on the H4 timeframe, we see two notable areas below.
One could possibly use the 38.2% H4 Fib support off legs A-D at 24619 (Leg A is 24224 and leg D falls in at 24859) as a breakeven trigger, and the 61.8% off legs A-D at 24466 as a level for taking full or partial profits.
Today’s data points: US ISM non-manufacturing PMI.
XAU/USD (Gold)
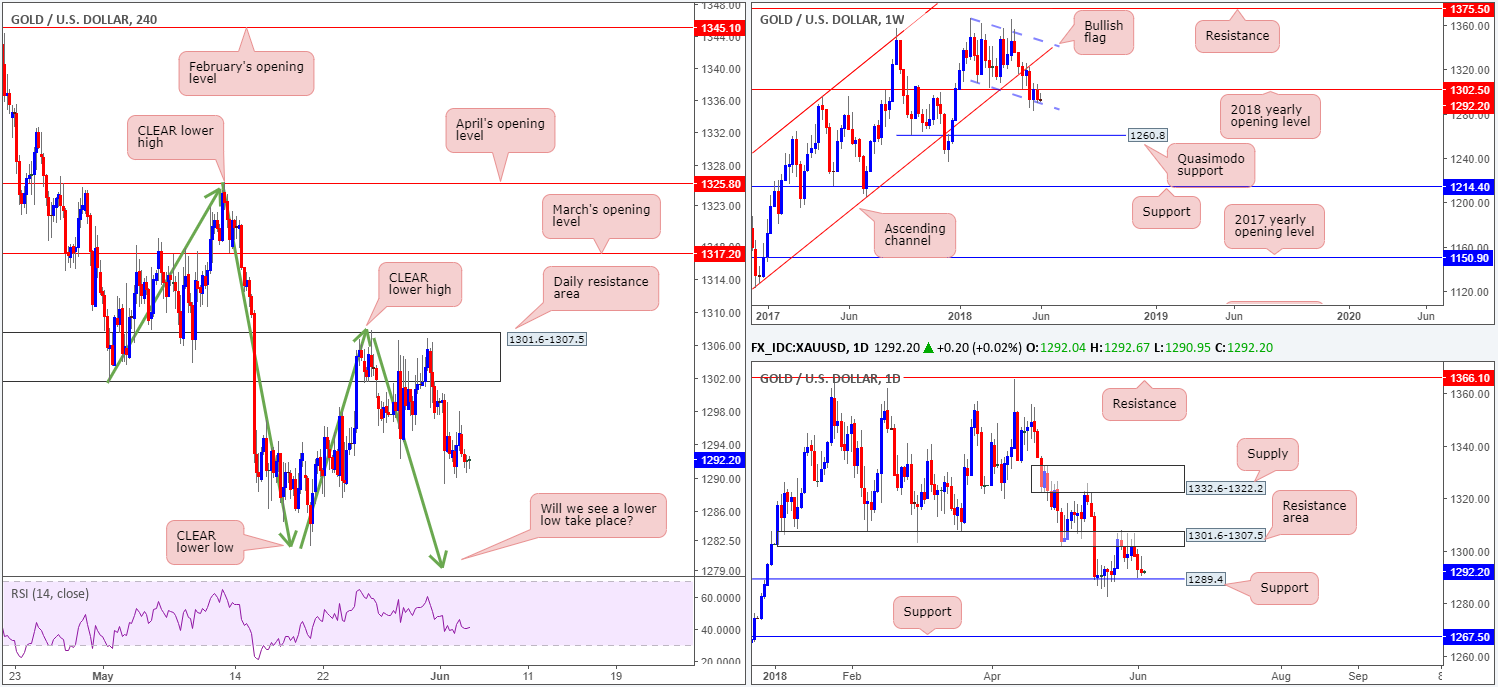
On the whole, gold movement was reasonably sedated on Monday. As a result of this, much of the following points will echo thoughts put forward in Monday’s analysis…
From the weekly timeframe, the price of gold remains tightly confined between the 2018 yearly opening level at 1302.5 and the lower edge of a weekly bullish flag formation taken from the low 1346.1. A break lower may set the stage for a test of 1260.8: a weekly Quasimodo support, whereas a move above 1302.5 may see weekly price head for the opposite end of the current weekly flag (extended from the high 1366.0). Moving down to the daily timeframe, we can see that support at 1289.4 was brought into play on Friday. Despite the fact that daily price has so far respected the noted support, traders may want to pencil in daily support at 1267.5 as this is the next downside target on this scale should the current support level give way.
As mentioned in several reports, the team are expecting a lower low to form on the H4 scale (a break of the swing low 1285.8). The daily resistance area mentioned above at 1301.6-1307.5 is a prominent zone on the H4 timeframe and offered traders the opportunity to sell throughout last week’s trade. Well done to those who have managed to hold their shorts from the daily zone.
Areas of consideration:
While the expectation is for a lower low to form on the H4 timeframe, the bigger picture, as already highlighted above, is currently testing notable higher-timeframe supports: daily support at 1289.4 and the lower edge of a weekly bullish flag formation. Therefore, those who remain short this market, it may now be a good opportunity to reduce risk to breakeven and take some profits off the table. Should H4 price continue to press lower in the face of higher-timeframe supports, however, a test of swing lows on the H4 timeframe around 1284.0 could be a nice area to consider additional profit taking.
The use of the site is agreement that the site is for informational and educational purposes only and does not constitute advice in any form in the furtherance of any trade or trading decisions.
The accuracy, completeness and timeliness of the information contained on this site cannot be guaranteed. IC Markets does not warranty, guarantee or make any representations, or assume any liability with regard to financial results based on the use of the information in the site.
News, views, opinions, recommendations and other information obtained from sources outside of www.icmarkets.com.au, used in this site are believed to be reliable, but we cannot guarantee their accuracy or completeness. All such information is subject to change at any time without notice. IC Markets assumes no responsibility for the content of any linked site. The fact that such links may exist does not indicate approval or endorsement of any material contained on any linked site.
IC Markets is not liable for any harm caused by the transmission, through accessing the services or information on this site, of a computer virus, or other computer code or programming device that might be used to access, delete, damage, disable, disrupt or otherwise impede in any manner, the operation of the site or of any user’s software, hardware, data or property.


