
EUR/USD:
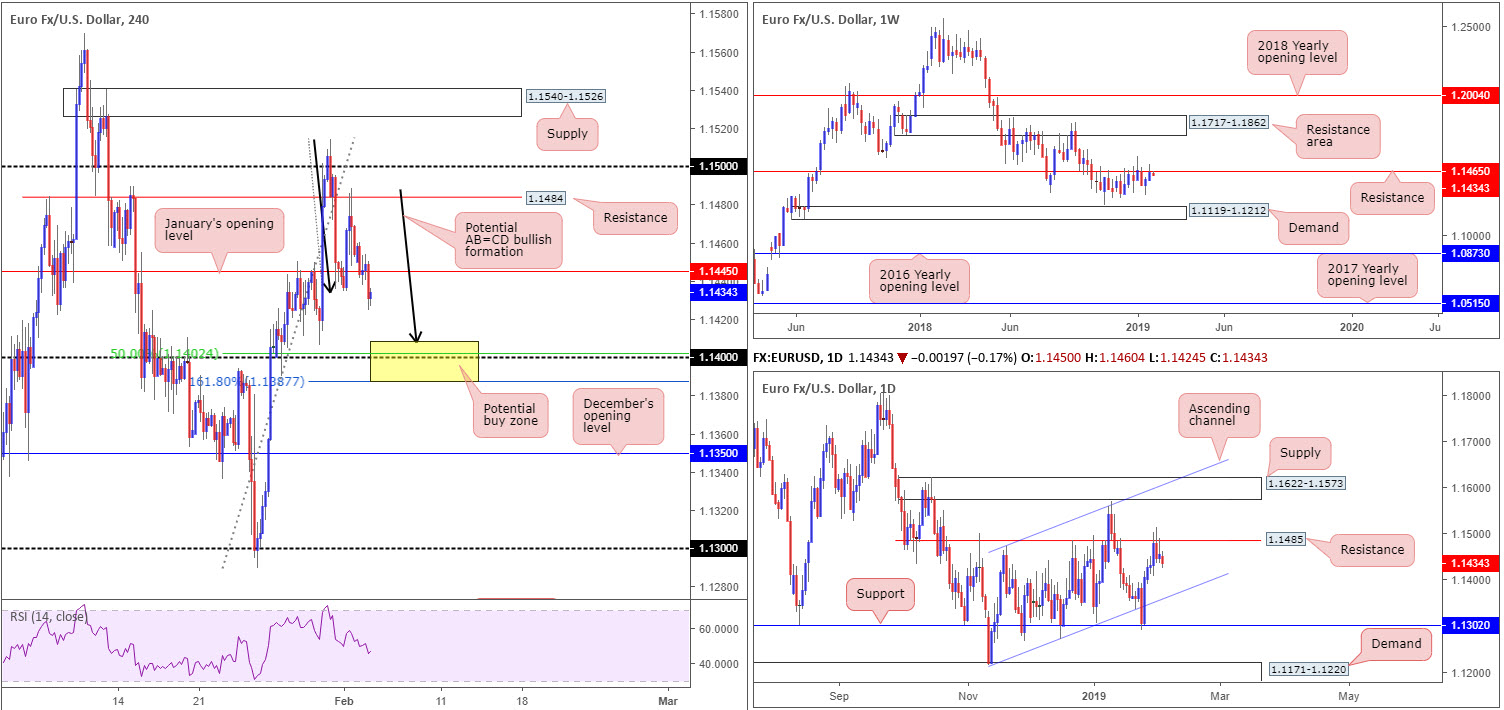
Despite observing a brief flicker of activity around January’s opening level on the H4 timeframe at 1.1445, the single currency yielded ground to its US counterpart Monday.
Clocking lows of 1.1424 amid broad-based USD strength, yesterday’s move exposes a possible AB=CD bullish pattern (black arrows) completion today, positioned just ahead of the 1.14 handle around 1.1408. Note 1.14 is joined by a 50.0% support value at 1.1402 and a nearby 161.8% Fibonacci ext. point at 1.1387: the extreme point of the AB=CD play (yellow).
From the bigger picture a move lower was expected, having seen weekly flow begin fading resistance at 1.1465 and daily movement also tackling resistance at 1.1485. The nearest support target on the higher timeframes can be seen at an ascending channel support (etched from the low 1.1215). It might also be worth pointing out should H4 price connect with its yellow zone between 1.1387/1.1408, the market may witness a mild fakeout through this area to bring in daily buyers off the nearby aforementioned ascending channel support.
Areas of consideration:
In the event the analysis proves accurate and the market completes its H4 AB=CD bullish pattern within 1.1387/1.1408, this is certainly an area the research team anticipates a bounce from should the pair reach this low, targeting January’s opening level mentioned above at 1.1445 as an initial take-profit zone.
As there’s a chance of a fakeout forming beneath the H4 area highlighted above, waiting for the H4 candles to chalk up a bullish candlestick pattern before pulling the trigger is an option. This recognises buyer intent, and at the same time provides entry and stop parameters to work with.
Today’s data points: US ISM Non-Manufacturing PMI.
GBP/USD:
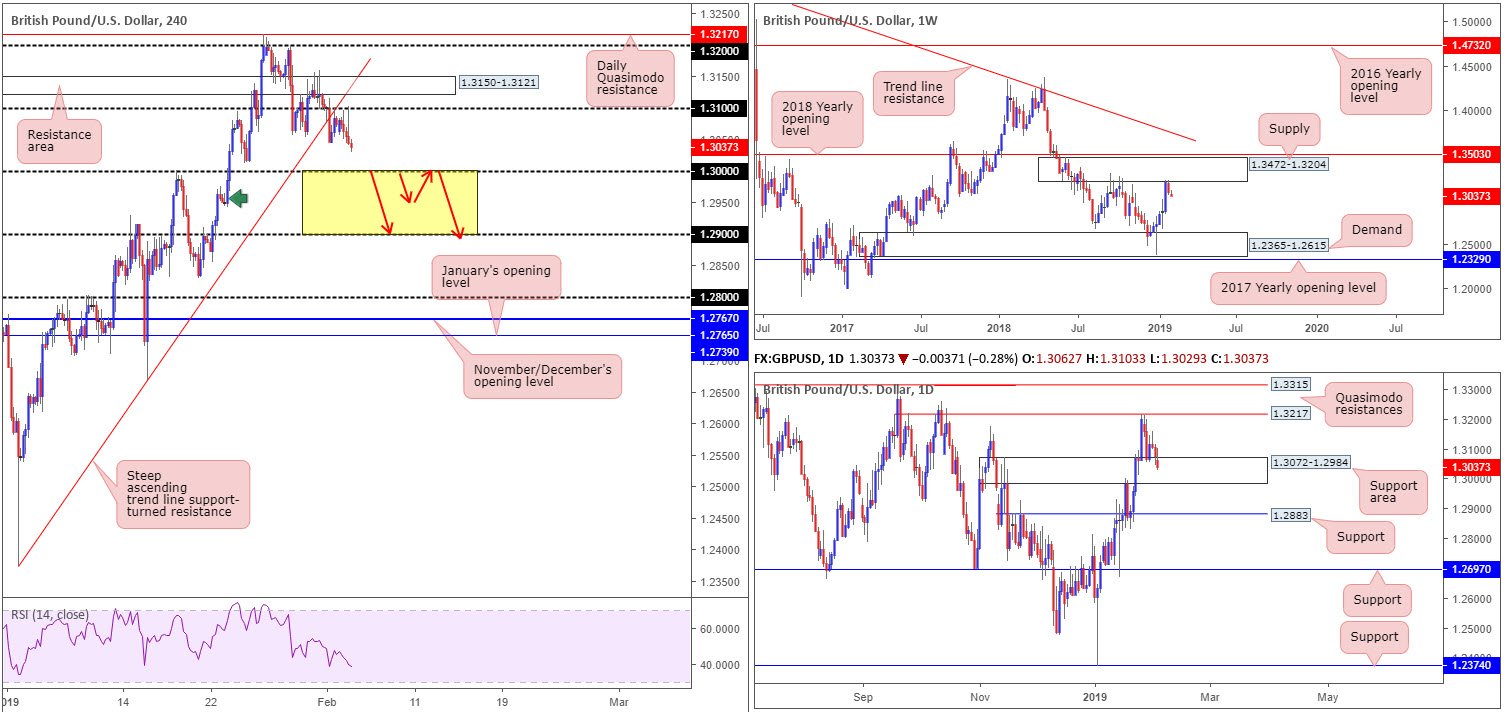
Cable topped around its 1.31 handle Monday and produced a strong H4 bearish pin-bar formation amid US hours, as the US dollar index concluded the day chalking up its third consecutive daily gain. For those who read Monday’s briefing you may recall the piece highlighted a potential short off the underside of 1.31, though also underlined it might be an idea to wait for a H4 bearish candlestick signal to form before pulling the trigger.
Caution stemmed from having seen daily price enter the walls of a support area registered at 1.3072-1.2984, despite weekly price seen engaging with the lower border of supply drawn from 1.3472-1.3204.
While the current H4 bearish pin-bar pattern likely caught the attention of candlestick enthusiasts, its size is difficult. Coming in with a range of more than 60 pips, this makes for a problematic short in terms of risk/reward, given the first take-profit target is the key figure 1.30.
Areas of consideration:
On account of recent developments, the research team has eyes on the 1.30 level today. 1.30, although housed within the parapets of the current daily support area, is potentially a fragile support as weekly sellers from supply may overwhelm the base.
In the event the above comes to fruition, a sell beneath 1.30 is considered a high-probability approach, targeting 1.29. The H4 demand sited in between these two round numbers around 1.2958ish (green arrow) is unlikely to be of concern, knowing we’re coming from weekly supply.
For aggressive traders, selling sub 1.30 on the breakout candle is an option (positioning stop-loss orders above its wick). Conservative traders, on the other hand, may opt to wait and see if H4 price retests the underside of 1.30 as resistance before pulling the trigger. It’s always nice when the retest is associated with a bearish candlestick formation as this provides a structure to base entry and stop levels from.
Today’s data points: UK Services PMI; US ISM Non-Manufacturing PMI.
AUD/USD:
Dwelling approvals out of Australia Monday fell a further 8.4% in December following a 9.8% drop in November and coming in much weaker than the consensus forecast of a 2.1% lift.
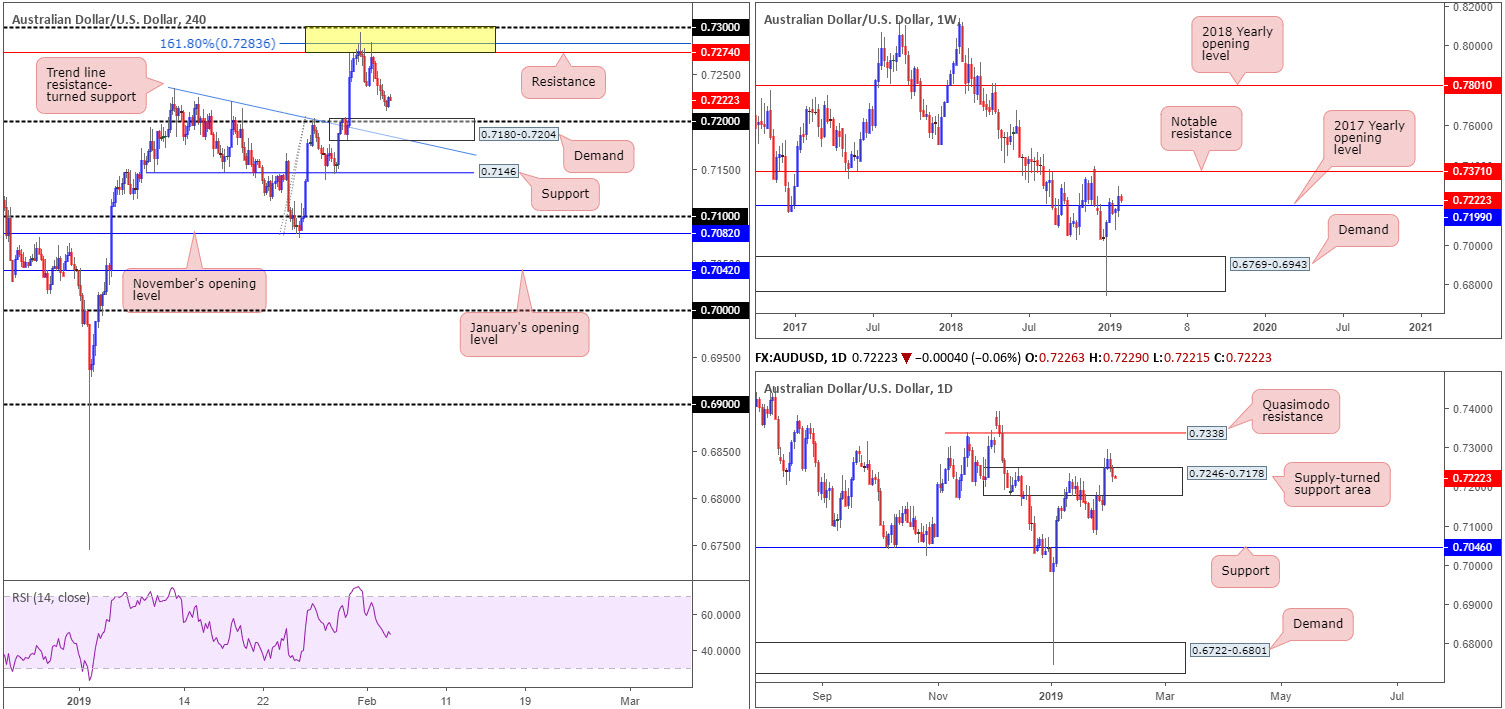
Weighed on by local data and a strengthening US dollar, the AUD/USD carved out its second consecutive loss from an overall peak of 0.7295 printed Thursday.
In terms of structure on the H4 page, resistance marked in yellow at 0.73/0.7274 remains in sight and has thus far done a superb job in holding price action lower (comprised of a round number at 0.73, a 161.8% Fibonacci ext. point at 0.7283 and a resistance level at 0.7274). To the downside from here, demand at 0.7180-0.7204 is seen close by, which happens to hold within it the 0.72 handle and merges nearby a trend line resistance-turned support (etched from the high 0.7235).
Against the backdrop of intraday flow, weekly price is seen hovering above its 2017 yearly opening level at 0.7199 following last week’s advance. With sellers likely emptied from this neighbourhood, a retest of 0.7199 as support has resistance at 0.7371 in the crosshairs this week.
Recent buying, as is evident from the daily timeframe, destroyed supply at 0.7246-0.7178 Wednesday and later retested the zone as a support area Friday. Assuming buyers hold ground here, upside momentum towards Quasimodo resistance at 0.7338 might be observed.
Areas of consideration:
Having seen all three timeframes emphasise support today, a long from the H4 demand mentioned above at 0.7180-0.7204 is worthy of consideration. Plotted within the lower limits of the current daily support area and sporting a reasonably strong line of H4 convergence as well as weekly support essentially representing the 0.72 handle, entering long from the top of the H4 demand, with stop-loss orders positioned beneath the daily support area’s base at 0.7178 may be an approach worth exploring today, targeting the H4 resistance area marked in yellow at 0.73/0.7274 as an initial upside target.
Today’s data points: Australian Retail Sales m/m; Australian Trade Balance; RBA Rate Statement and Cash Rate Decision; US ISM Non-Manufacturing PMI.
USD/JPY:
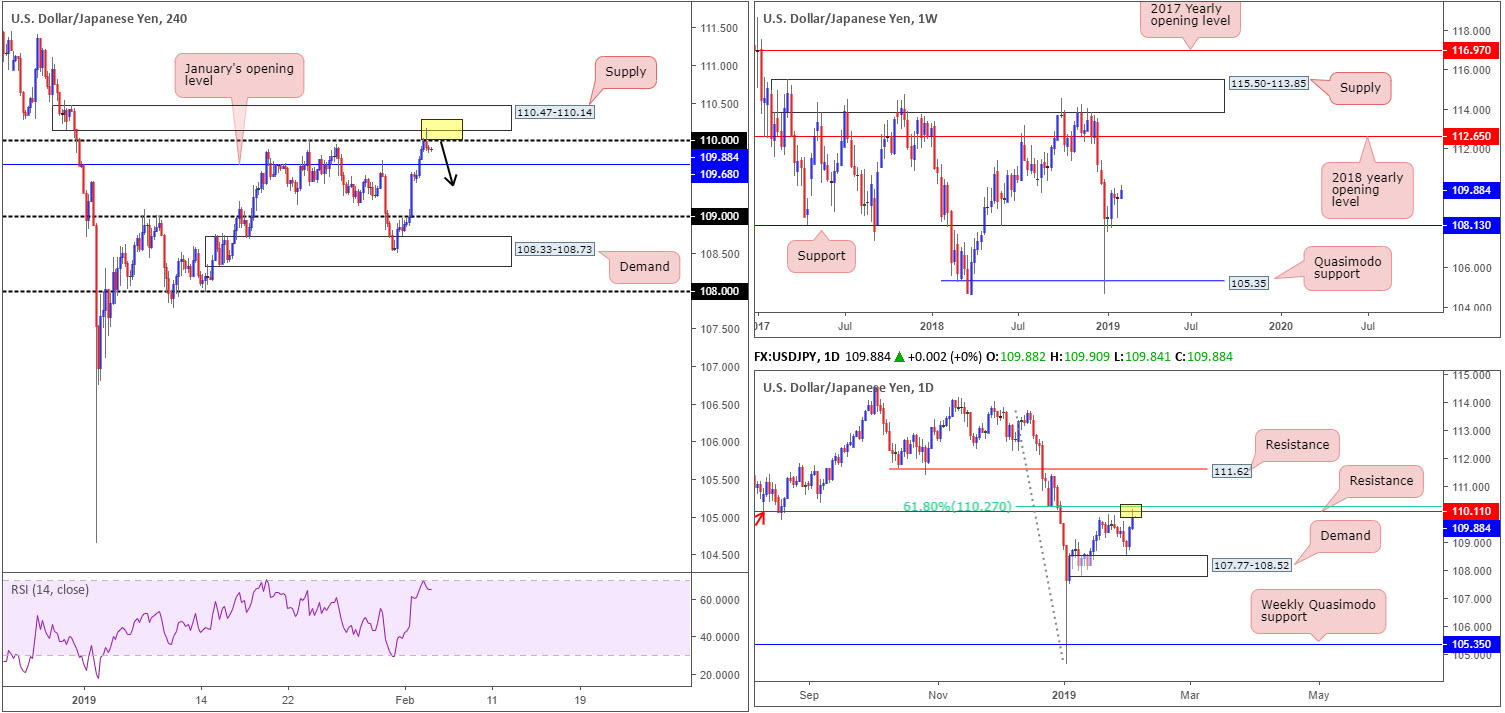
In Monday’s briefing, the piece underscored H4 supply coming in at 110.47-110.14 as an area of interest.
The push above 110 sited a few pips beneath it not only trips stop-loss orders from traders attempting to fade the psychological mark, which, when filled, become buy orders to sell in to, breakout buyers will also have likely attempted to join the movement here. This offer of liquidity to sell to, coupled with daily resistance seen plotted at 110.11 (and its nearby 61.8% Fibonacci resistance value at 110.27), has, as you can see, brought price action lower from the noted H4 supply. It might also be worth noting the H4 RSI indicator struck overbought territory.
Areas of consideration:
Traders who believed the H4 supply and daily resistance was enough evidence to draw sellers’ attention will likely already be short this market with stop-loss orders planted just north of 110.47. Once, or indeed if, the H4 candles reclaim 109.68 to the downside, this may be a good opportunity to begin thinking about reducing risk to breakeven and taking partial profits off the table.
Traders who feel the need to trade the H4 supply based on candle confirmation due to where we’re trading on the weekly timeframe (above support at 108.13 with room seen to rally as far north as the 2018 yearly opening level at 112.65), the bearish fakeout candle recently printed is likely enough evidence to suggest further selling (entry/stop parameters can be defined off of this structure), hopefully beyond January’s opening level at 109.68.
Today’s data points: US ISM Non-Manufacturing PMI.
USD/CAD:
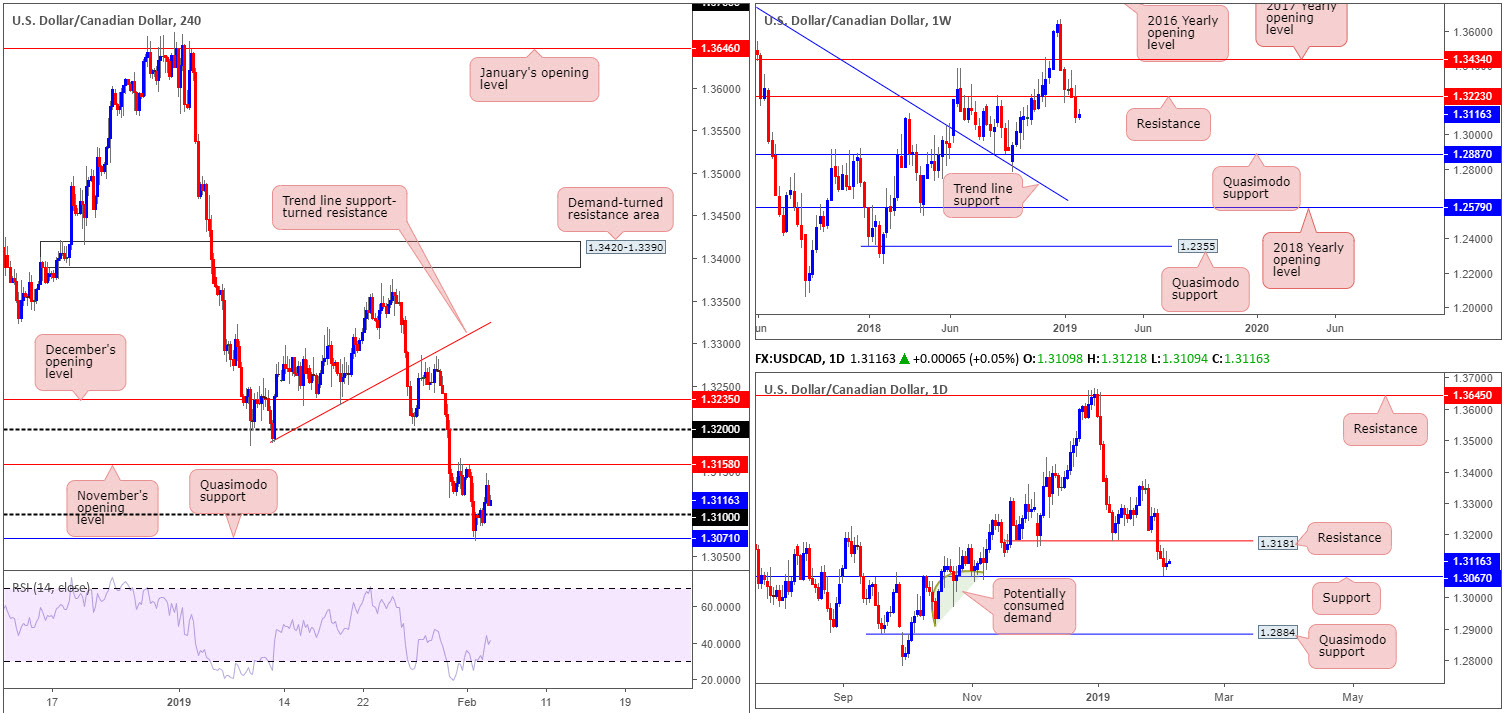
USD/CAD bulls entered an offensive phase amid Monday’s session, reclaiming 1.31 to the upside on the H4 timeframe and coming within touching distance of testing the underside of November’s opening level at 1.3158, before receding lower and paring a large portion of gains into the close.
With 1.31 a likely support today, a retest off of this level is possibly something to keep an eye open for. Beneath this number, however, H4 Quasimodo support at 1.3071 is also an attractive base, due to the fact it unites closely with a daily support priced in at 1.3067.
In regards to where we stand on the weekly timeframe, nevertheless, further selling is a strong possibility. The USD/CAD, as you can see, failed to shield support priced in at 1.3223 last week, causing a substantial near-full-bodied bearish candle to form. To the left, the research team notes limited support (or demand) until shaking hands with a Quasimodo base coming in at 1.2887.
Areas of consideration:
According to our technical studies, a break of the 1.31 handle is high probability, though active buyers may reside close by at the H4 Quasimodo support drawn from 1.3071/daily support at 1.3067. The only caveat to any buying in this market is, of course, the weekly timeframe threatening a downside move.
A bounce off the H4 Quasimodo support that forms a decisive close back above 1.31 could be worth exploring as a possible long towards November’s opening level at 1.3158, followed by daily resistance at 1.3181 (the next upside target on the daily scale). Entering long on either the breakout candle or a retest play off 1.31 are two possibilities.
Should the market close beneath the current H4 Quasimodo support, on the other hand, a selloff towards 1.30 on the H4 timeframe (not seen on the screen) could be seen. Entering short on either the breakout candle or a retest play off 1.3071 are two prospects.
Today’s data points: US ISM Non-Manufacturing PMI.
USD/CHF:
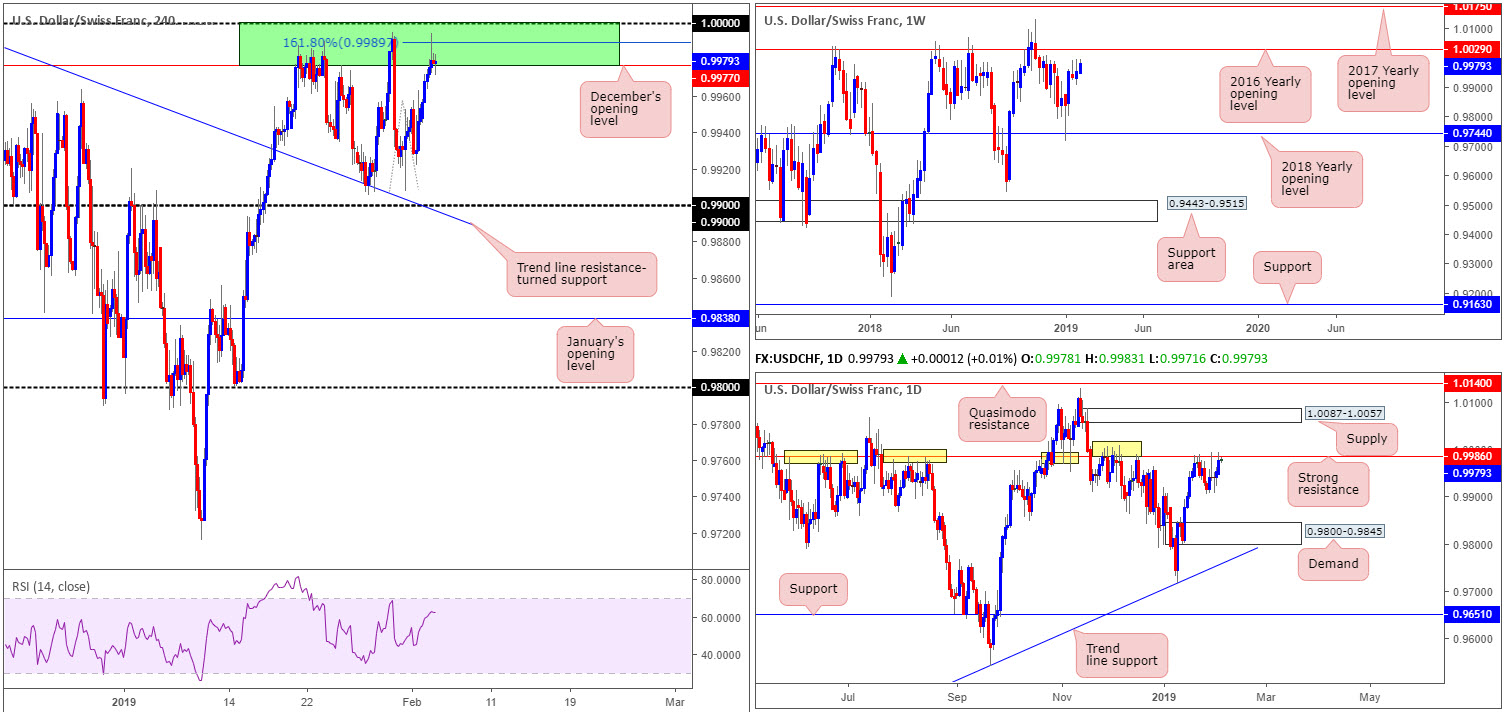
On the back of a resurgent greenback Monday, the H4 candles in the USD/CHF market advanced towards an area of interest marked in green between 1.0000 (parity) and December’s opening level at 0.9977. Another factor supporting this area is a 161.8% Fibonacci ext. point at 0.9989.
What’s also notable from a technical viewpoint is the daily resistance level priced in at 0.9986 happens to be fixed within the H4 zone highlighted above. This daily level boasts incredibly strong historical significance (yellow), therefore it is not a barrier one should overlook. With that being said, though, while the current H4 base is a tempting sell, traders may want to acknowledge weekly price suggesting scope for an upside move towards its 2016 yearly opening level at 1.0029.
Areas of consideration:
Given the number of times the H4 resistance area at 1.0000/0.9977 has been tested, and taking into account the H4 candles failed to print a fresh lower low beyond the 0.9905 Jan 28 low, sellers may be flagging here.
Traders who believe the current H4 resistance still has some gas left in it, waiting for a CLEAR H4 bearish candlestick formation to take shape might be worth considering before pulling the trigger (entry/stop parameters can be defined off of this structure).
In the event we push for higher ground, the research team feels active sellers reside 30 pips beyond 1.0000 at 1.0029: the 2016 yearly opening level. Therefore, breakout buyers looking to enter long above 1.0000 may want to exercise caution.
Today’s data points: US ISM Non-Manufacturing PMI.
Dow Jones Industrial Average:
For traders who read Monday’s report you may recall the piece emphasising promising longs in this market.
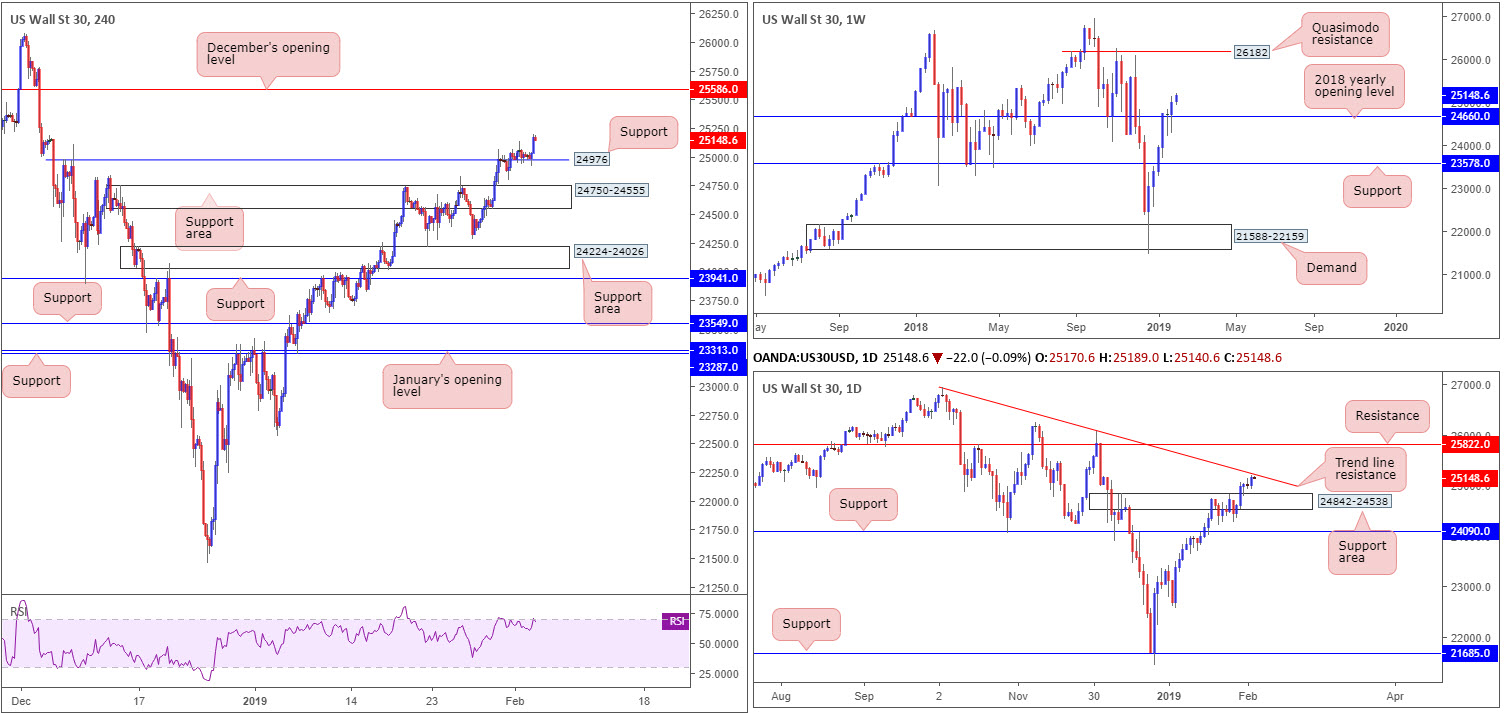
As is evident from the H4 timeframe this morning, the unit printed a nice-looking bullish pin-bar pattern off support – a Quasimodo resistance–turned support – at 24976 and has advanced to higher ground. This was a formation noted in Monday’s briefing to be watchful of.
The reason behind selecting the H4 support level as a buy zone was largely due to resistance not entering the fray on the H4 scale until reaching December’s opening level at 25586, along with weekly price displaying little in terms of resistance until crossing swords with a Quasimodo barrier at 26182. The only downside to this is the daily trend line resistance (extended from the high 26939), which, as you can see, is within touching distance of entering the fray.
Areas of consideration:
Well done to any of our readers who managed to jump aboard yesterday’s move higher. Reducing risk to breakeven upon testing the aforementioned daily trend line resistance is worthy of consideration as strong sellers may reside here. A break above this angle, however, will draw December’s opening level mentioned above on the H4 timeframe at 25586 firmly into the spotlight as the next viable target.
Today’s data points: US ISM Non-Manufacturing PMI.
XAU/USD (GOLD):
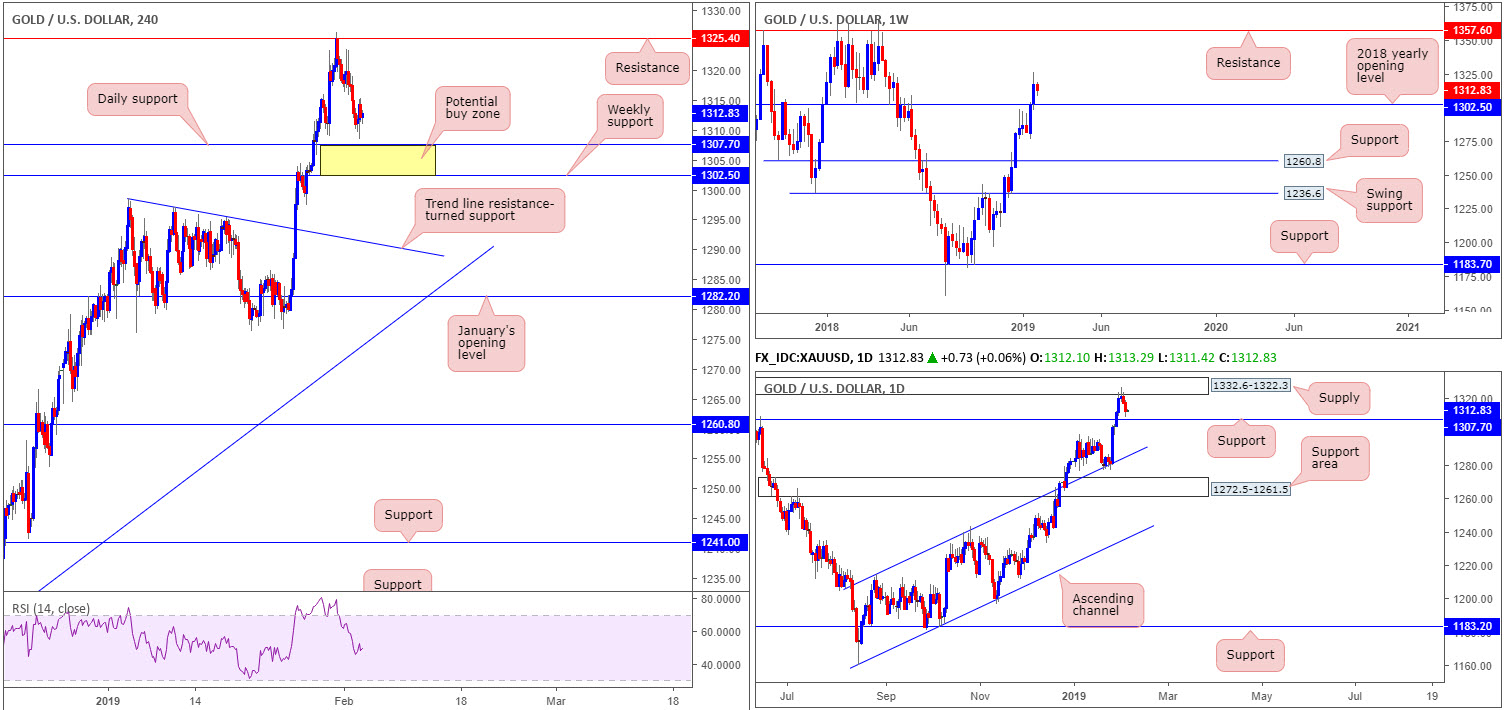
In recent sessions, the H4 candles extended Friday’s losses and crossed paths with lows at 1308.4, bolstered by a stronger US dollar. Bottoming just ahead of daily support at 1307.7, bullion mildly pared losses into the close.
The current daily support, coupled with nearby weekly support at 1302.5: the 2018 yearly opening level, is an area active buyers likely inhabit (yellow zone based on the H4 timeframe). A bounce from here has daily supply to target at 1332.6-1322.3. It may also interest traders to note within the current daily supply zone is a resistance level priced in at 1325.4. Also note how strongly this level capped price last week.
Areas of consideration:
Keeping things simple this morning, the 1302.5/1307.7 area marked on the H4 timeframe is of interest this morning. A H4 bullish candlestick pattern (entry/stop parameters can be defined off of this structure) emerging from this region would, according to our technical studies, be considered a strong buy signal. Arguably, though, many traders will feel the combination of a weekly and daily support is sufficient evidence to trade, without waiting for additional candle confirmation, simply entering and placing stops using the limits of the zone.
The use of the site is agreement that the site is for informational and educational purposes only and does not constitute advice in any form in the furtherance of any trade or trading decisions.
The accuracy, completeness and timeliness of the information contained on this site cannot be guaranteed. IC Markets does not warranty, guarantee or make any representations, or assume any liability with regard to financial results based on the use of the information in the site.
News, views, opinions, recommendations and other information obtained from sources outside of www.icmarkets.com.au, used in this site are believed to be reliable, but we cannot guarantee their accuracy or completeness. All such information is subject to change at any time without notice. IC Markets assumes no responsibility for the content of any linked site. The fact that such links may exist does not indicate approval or endorsement of any material contained on any linked site.
IC Markets is not liable for any harm caused by the transmission, through accessing the services or information on this site, of a computer virus, or other computer code or programming device that might be used to access, delete, damage, disable, disrupt or otherwise impede in any manner, the operation of the site or of any user’s software, hardware, data or property.


