
EUR/USD:
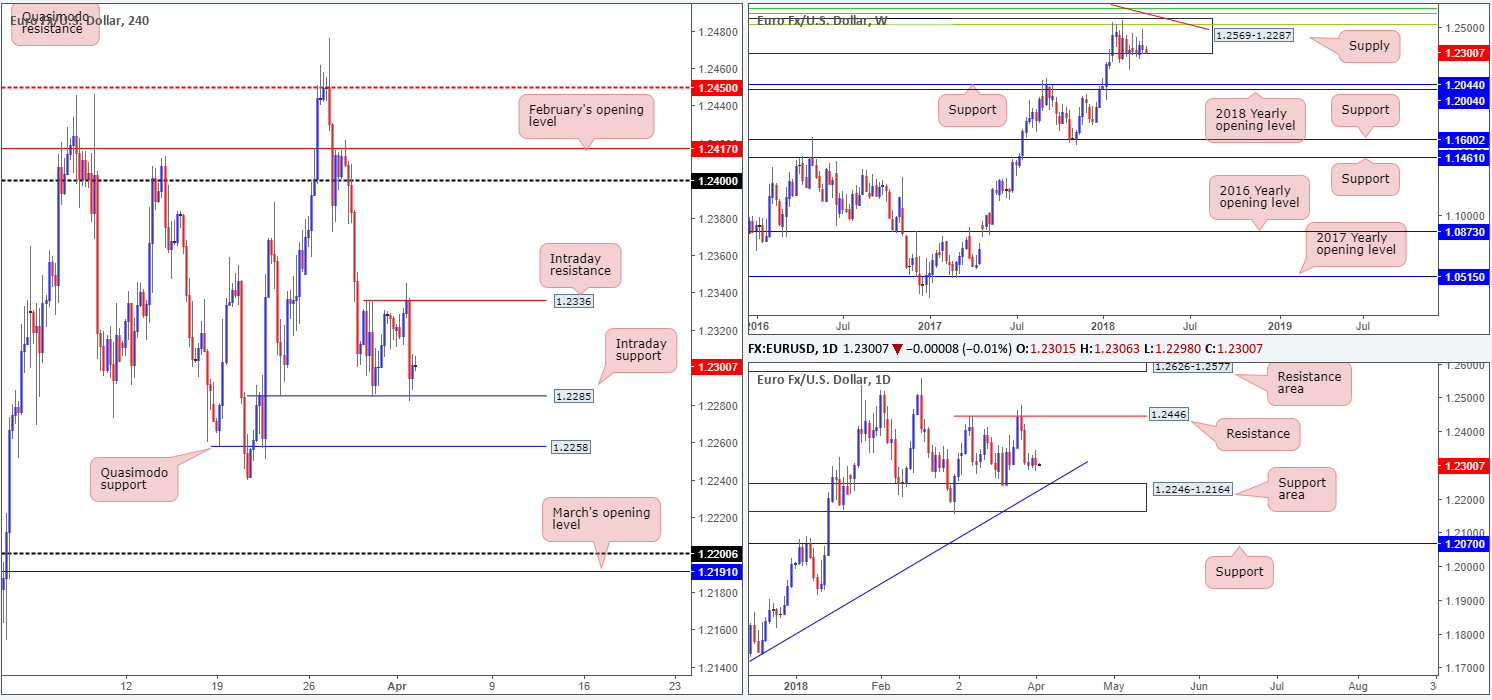
As FX markets look to shake off the long Easter weekend, we can see that between H4 resistance at 1.2336 and H4 support plotted at 1.2285, the pair has been busy carving out an intraday range. There was modest buying seen after the March US ISM manufacturing survey fell short of expectations on Monday, but it was short-lived as price headed to the lower vicinity of the aforementioned consolidation.
A break beneath the current H4 support has the H4 Quasimodo support at 1.2258 to target, followed then by the top edge of a daily support area coming in at 1.2246-1.2164 which communicates beautifully with a long-term daily trendline support etched from the low 1.0569. Over on the weekly timeframe, however, the buyers and sellers have been battling for position within a major-league weekly supply at 1.2569-1.2287 since late January. Downside targets fall in around the weekly support band at 1.2044, shadowed closely by the 2018 yearly opening level at 1.2004.
Potential trading zones:
We really like the H4 Quasimodo support mentioned above at 1.2258, since it is positioned just ten or so pips north of the daily support area at 1.2246-1.2164. The ultimate take-profit target from this angle could be set at 1.2446: a daily resistance. However, do keep in mind that by entering long from here you’re effectively buying into weekly supply! Therefore, regular monitoring is required.
Data points to consider today: German retail sales m/m; FOMC Brainard speech.
Areas worthy of attention:
Supports: 1.2285; 1.2258; 1.2246-1.2164; daily trendline support; 1.2044; 1.2004.
Resistances: 1.2336; 1.2446; 1.2569-1.2287.
GBP/USD:
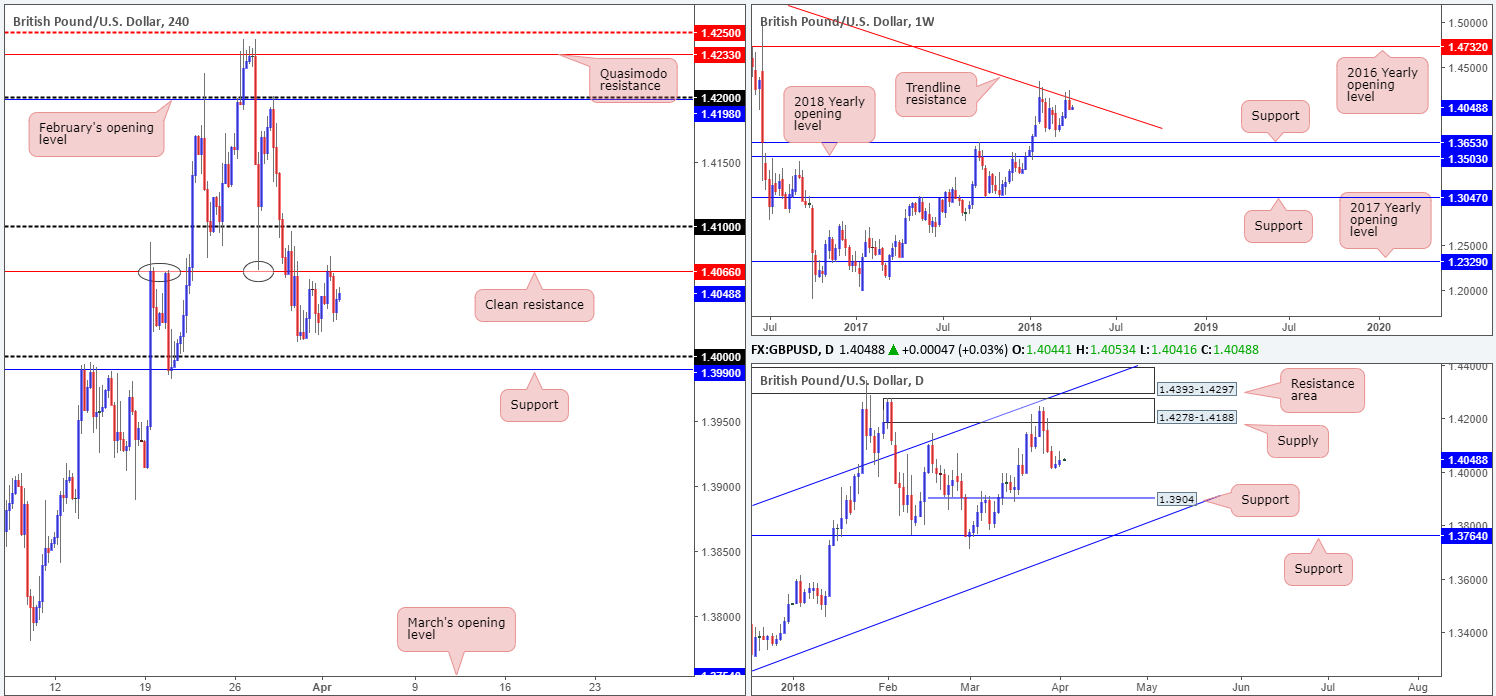
After bottoming just ahead of the key 1.40 figure last Thursday, the British pound grinded its way north and eventually crossed swords with a strong H4 resistance priced in at 1.4066. Price was likely to find some resistance from this level with it having been a strong barrier of support and resistance last month month (see black circles) and also during February.
Over on the bigger picture, the pair firmly rejected the weekly trendline resistance taken from the high 1.5930 last week. Having seen this line force price in excess of 500 pips lower in early January, we may see history repeat itself here. From this scale, this has placed the Feb 26 weekly low in view at 1.3711, followed closely by weekly support plugged in at 1.3653. In conjunction with weekly structure, we can see that daily movement also recently crossed swords with a daily supply zone at 1.4278-1.4188. Regarding this timeframe, there’s not much seen stopping cable from reaching daily support at 1.3904 this week, and, with a little bit of oomph, quite possibly the daily support band coming in at 1.3764.
Potential trading zones:
With H4 action looking as though it wants to retest 1.4066 for a second time, and given that both weekly and daily timeframes indicate further downside could be on the cards, an additional sell from this angle could be considered. As for take-profit targets, the 1.40 zone would be a safe initial zone, in our technical view. Upon successfully breaching this level, however, all eyes will then likely be on daily support at 1.3904.
Data points to consider today: UK manufacturing PMI; FOMC Brainard speech.
Areas worthy of attention:
Supports: 1.40; 1.3990; 1.3904.
Resistances: 1.4066; 1.4278-1.4188; weekly trendline resistance.
AUD/USD:
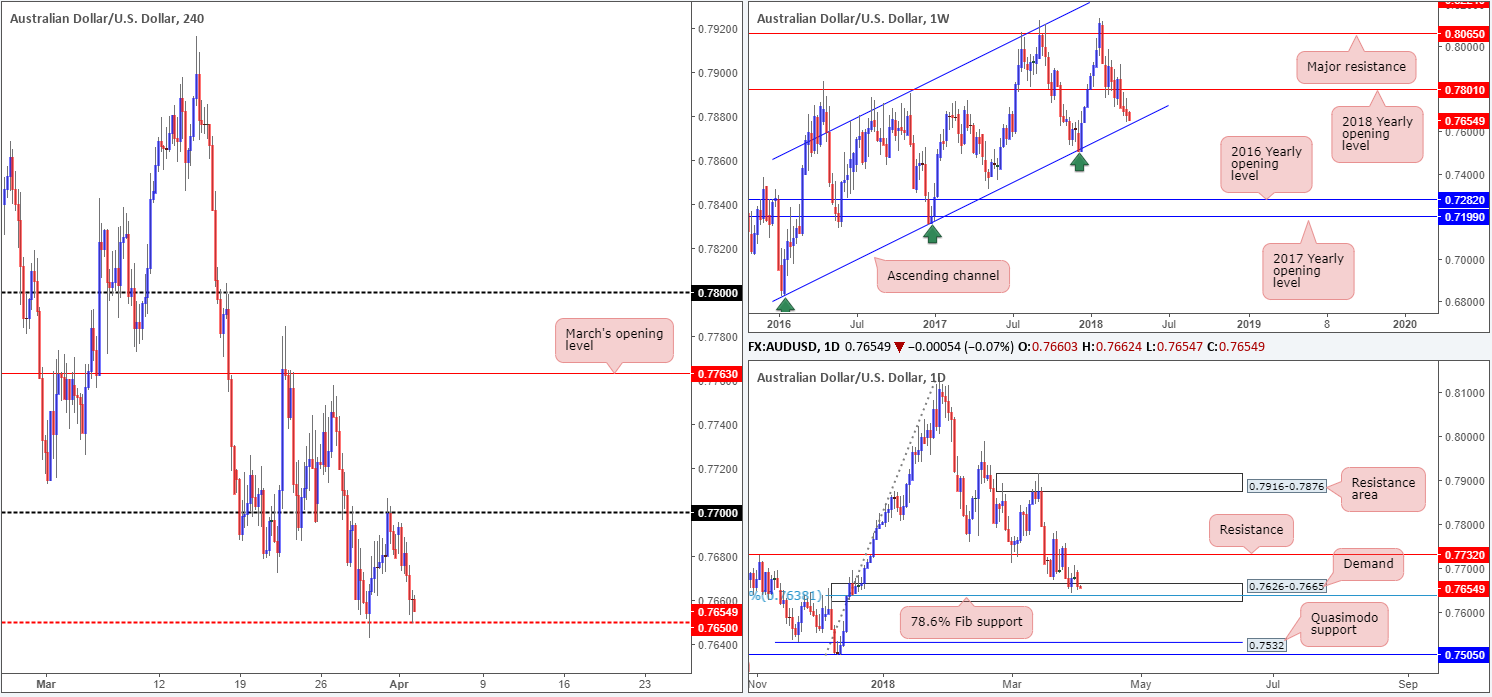
Kicking this morning’s report off with a quick look over the weekly timeframe shows us that the unit is trading within shouting distance of a major long-term weekly channel support taken from the low 0.6827.
Turning the focus over to the daily candles, the daily demand based at 0.7626-0.7665 (houses a 78.6% daily Fib support at 0.7638 and converges closely with the noted weekly channel support) is seen back in the spotlight after a failed attempt to push higher during the Easter break. The next upside objective from this angle can be seen in the form of a daily resistance level at 0.7732. A decisive move beyond the current daily demand, on the other hand, could set the wheels in motion for an approach to a daily Quasimodo support pegged at 0.7532, followed by a daily support seen at 0.7505.
Across on the H4 timeframe, we can see that the 0.77 band did a superb job in holding the action lower amid the long Easter weekend, with price now seen mildly testing a H4 mid-level support at 0.7650.
Potential trading zones:
In a similar fashion to Thursday’s report, the team has noted the 78.6% daily Fib support at 0.7638 (seen a touch beneath the current H4 mid-level support) as a potential buy zone, given it is positioned within the current daily demand and intersects with the weekly channel support mentioned above.
This could prove to be a reasonably big move seeing as we’re utilizing higher-timeframe areas. Therefore, stop-loss orders would be best placed 5-10 pips beyond the current daily demand with the initial upside target falling in at a daily resistance drawn from 0.7732.
Data points to consider today: RBA Cash Rate (Apr); FOMC Brainard speech.
Areas worthy of attention:
Supports: 0.7650; 0.7638; 0.7626-0.7665; weekly channel support.
Resistances: 0.77; 0.7732.
USD/JPY:
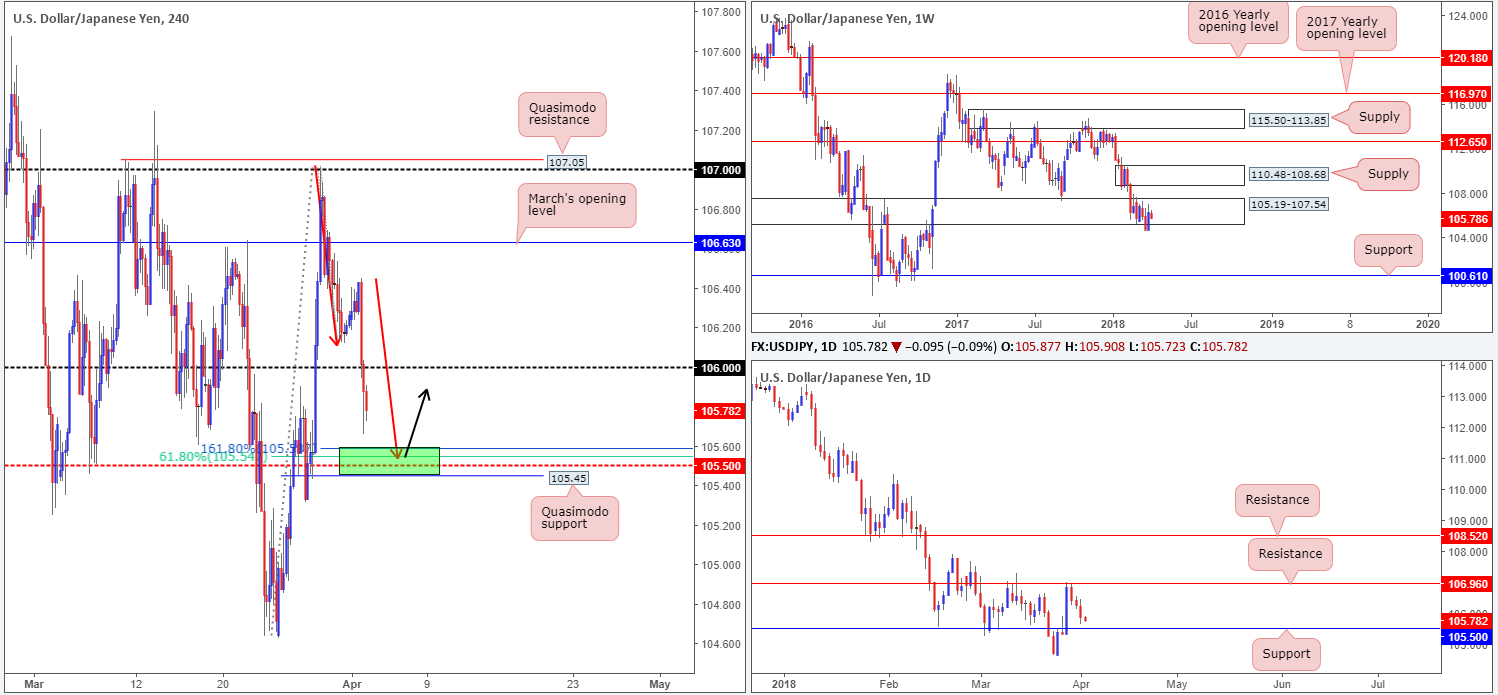
In recent hours, the US dollar came under pressure against its Japanese counterpart as trade fears grip global markets once again.
While the yen is likely favored from a fundamental perspective, the desk has priced in nearby technical support at around the 105.50 mark on the H4 timeframe. Comprised of a 61.8% H4 Fib support at 105.54, a H4 AB=CD (see red arrows) 161.8% Fib ext. point at 105.58, a H4 mid-level support at 105.50 and a nearby H4 Quasimodo support at 105.45, this area could potentially act as an intraday support today. In addition to this, traders may also want to note that the H4 mid-level support represents a support positioned on the daily timeframe!
Potential trading zones:
Although the 105.45/105.58 area marked in green on the H4 timeframe is of interest this morning, traders need to keep in mind that weekly price is seen trading within 105.19-107.54: an area we’re unsure of at the moment, given it could potentially act as either a support or resistance zone. What’s more, a long in this market places you in direct conflict with the current downtrend. As such, waiting for a H4 full or near-full-bodied bull candle to form from 105.45/105.58 is strongly recommended. While this will not guarantee a winning trade, it will highlight potential buyer intent.
Data points to consider today: FOMC Brainard speech.
Areas worthy of attention:
Supports: 105.45/105.58.
Resistances: 106.
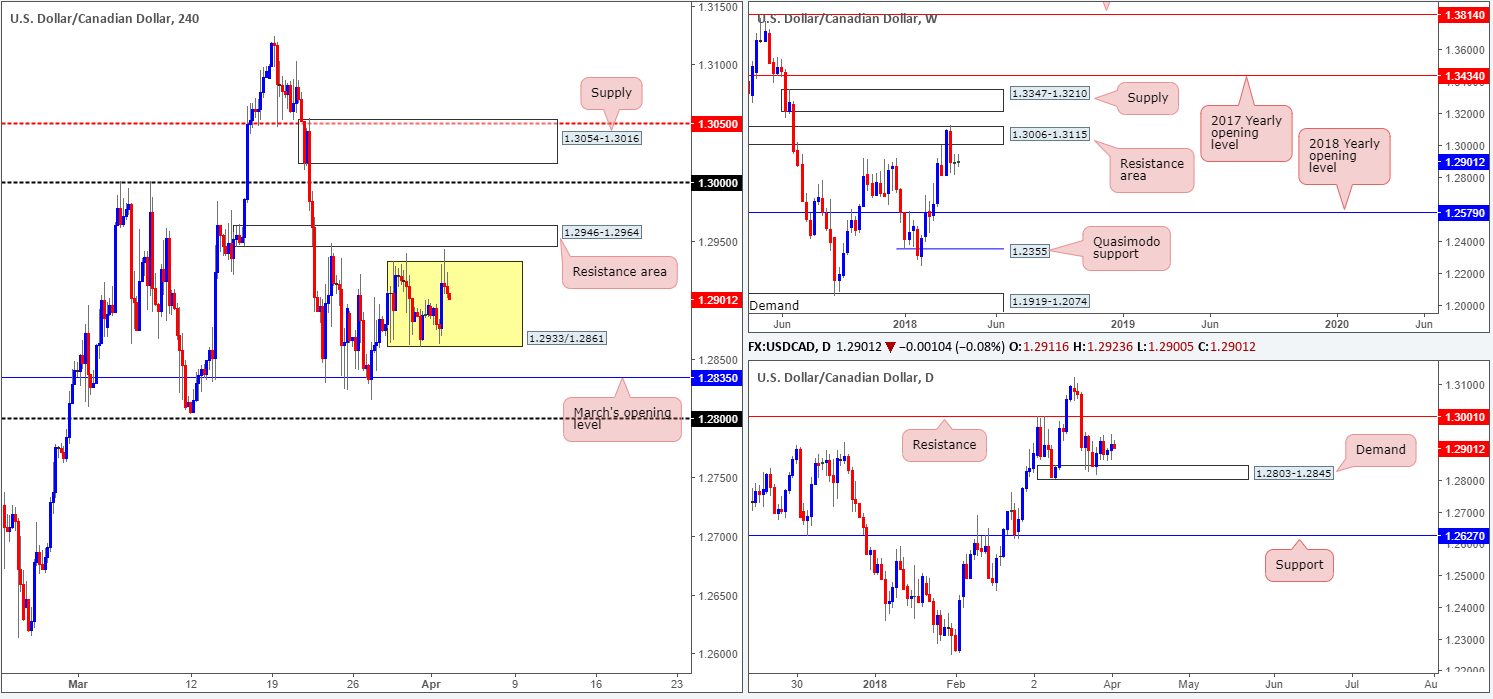
USD/CAD:
Over the course of the Easter vacation, the USD/CAD consolidated between 1.2933/1.2861 on the H4 timeframe (see yellow shaded area). Overhead, we also see a H4 resistance area priced in at 1.2946-1.2964, while to the downside, however, the next port of call can be seen at March’s opening level drawn from 1.2835.
The story on the weekly timeframe shows that price continues to reflect a somewhat bearish tone after hitting the brakes and firmly turning lower from a weekly resistance area at 1.3006-1.3115. Cranking things down one more notch, nonetheless, we can see that daily price is trading just ahead of a strong-looking daily demand area located at 1.2803-1.2845.
Potential trading zones:
As highlighted in Monday’s report, it would only be once we witness a strong break of the current daily demand will we likely see further downside on the weekly timeframe materialize. Before a break of the daily zone occurs, though, traders may want to prepare themselves for a potential retest of daily resistance seen at 1.3001.
Short term, on the other hand, traders may look to attempt to fade the current H4 range at 1.2933/1.2861. In doing so, though, remain cognizant to the possibility of a fakeout to the surrounding areas: H4 resistance area at 1.2946-1.2964 and March’s opening level at 1.2835.
Data points to consider today: FOMC Brainard speech.
Areas worthy of attention:
Supports: 1.2861; 1.2835; 1.2803-1.2845.
Resistances: 1.2933; 1.2946-1.2964; 1.3001.
USD/CHF:
Following a modest recovery from 0.9526: a 38.2% H4 Fib support, the pair eventually conquered the nearby H4 mid-level resistance at 0.9550 during the course of Monday’s segment. The USD/CHF, as you can see, is currently looking for bidders to pull the unit up to a H4 Quasimodo resistance level at 0.9578.
Turning the focus over to the bigger picture, weekly price is seen establishing a base of support off of a weekly area marked at 0.9443-0.9515 in the shape of a strong-looking weekly bullish engulfing candle. Further buying from here could eventually lift things up to the 2018 yearly opening level positioned on the weekly timeframe at 0.9744. Although weekly price reflects a rather strong bullish tone, the picture currently painted on the daily timeframe echoes a slightly different environment. Directly above current price, we can see a solid daily supply base coming in at 0.9666-0.9589, which is sited just south of an interesting daily resistance level at 0.9714.
Potential trading zones:
Weekly traders looking to buy the recently formed weekly bullish engulfing candle may want to hold fire! Entering long into a substantial daily supply zone is not a trade we would label high probability, no matter what the weekly timeframe is indicating!
Intraday, however, longs could be a possibility above 0.9550, targeting 0.9578 (the aforementioned H4 Quasimodo resistance level), followed closely by the underside of the noted daily supply at 0.9589.
Data points to consider today: FOMC Brainard speech.

Areas worthy of attention:
Supports: 0.9526; 0.9550; 0.9443-0.9515.
Resistances: 0.9578; 0.9666-0.9589; 0.9744; 0.9714.
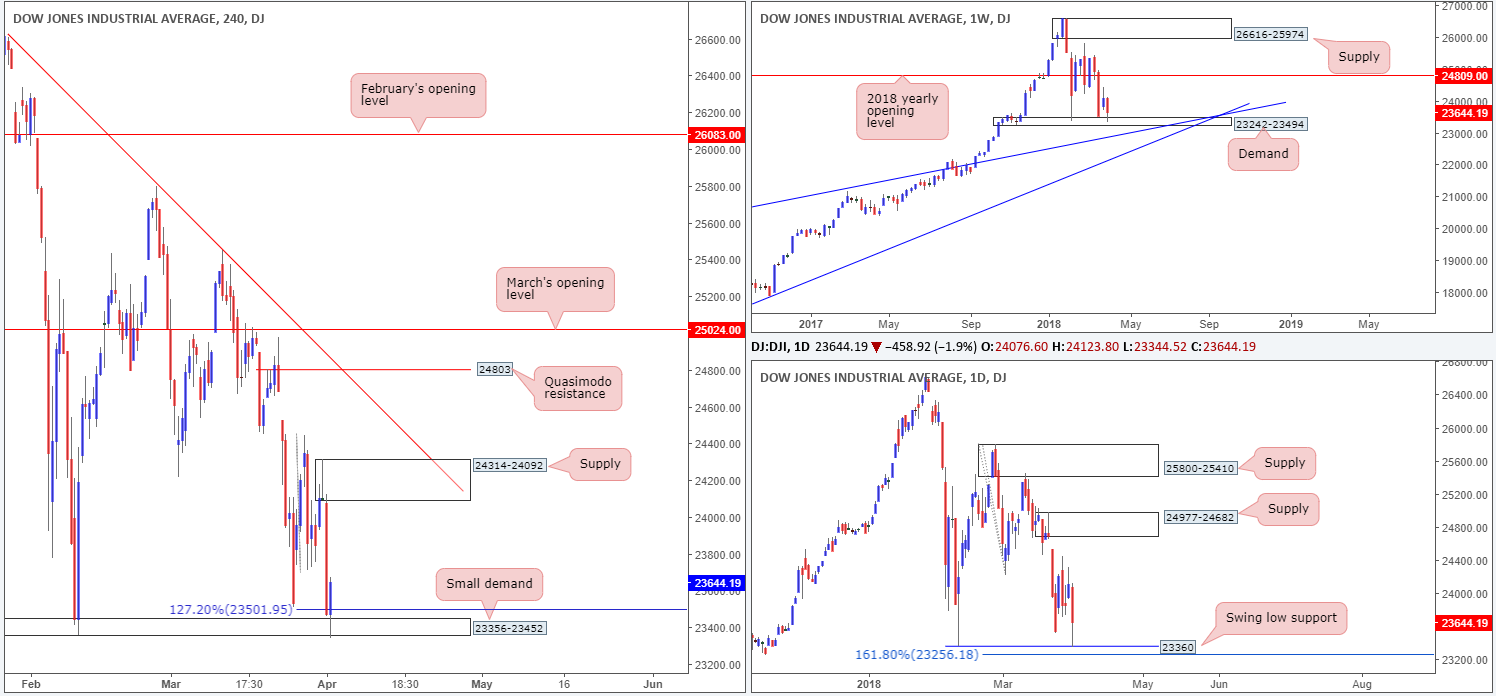
DOW 30:
In recent sessions, US equity indexes fell to fresh lows of 23344, with the Technology sector leading the way (NASDAQ 100 down nearly 3 percent) following a Twitter attack on Amazon via US President Trump.
Recent movement has brought the weekly demand area at 23242-23494 back in focus. A decisive move from this angle could very well see the unit retest the 2018 yearly opening level printed on the weekly timeframe at 24809. Daily price, on the other hand, shook hands with the Feb 9 low 23360 (shadowed closely by a 161.8% daily Fib ext. point at 23256) and printed a mild end-of-day correction tail. Given that both values are encapsulated within the walls of the aforementioned weekly demand base, a bounce up to the daily supply zone at 24977-24682 (houses the aforementioned 2018 yearly opening level) could be seen.
Sliding across to the H4 timeframe, we can also see that yesterday’s trade brought a small H4 demand base into the fray at 23356-23452, which happens to converge nicely with a 127.2% H4 Fib ext. point at 23501. A rotation to the upside has the H4 supply at 24314-24092 to target.
Potential trading zones:
In light of the recent rejection printed off of the current H4 demand closing near its highs, this, given where price is positioned on the bigger picture, is likely to attract buyers into the market, targeting the noted H4 supply. Should buyers chew through this supply, the next port of call can be seen around the underside of the aforesaid daily supply.
Data points to consider today: FOMC Brainard speech.
Areas worthy of attention:
Supports: 23356-23452; 23501; 23360; 23242-23494.
Resistances: 24314-24092; 24809; 24977-24682.
GOLD:
After coming within a few pips of February’s opening level at 1345.1 on Monday, bullion mildly pared gains. As far as we’re concerned, H4 action shows little support in view until we connect with a Quasimodo support coming in at 1323.2. A break of February’s opening level, however, may set the stage for a continuation move north up to a H4 Quasimodo resistance priced in at 1357.1.
Gold’s weekly timeframe is seen floating between the 2018 yearly opening level at 1302.5 (fuses closely with a long-term weekly channel support etched from the low 1122.8) and weekly resistance pegged at 1375.5/38.2% weekly Fib resistance at 1381.0. From another point of view, daily price is seen heading toward a daily channel resistance extended from the high 1366.0.
Potential trading zones:
Neither a long nor short seems attractive at the moment. That is, we do not see much confluence in this market and without a strong collection of converging structures, we always feel it best to remain on the sidelines and look at other markets.

Areas worthy of attention:
Supports: 1323.2; 1302.5; weekly channel support.
Resistances: 1345.1; 1357.1; 1375.5; daily channel resistance.
This site has been designed for informational and educational purposes only and does not constitute an offer to sell nor a solicitation of an offer to buy any products which may be referenced upon the site. The services and information provided through this site are for personal, non-commercial, educational use and display. IC Markets does not provide personal trading advice through this site and does not represent that the products or services discussed are suitable for any trader. Traders are advised not to rely on any information contained in the site in the process of making a fully informed decision.
This site may include market analysis. All ideas, opinions, and/or forecasts, expressed or implied herein, information, charts or examples contained in the lessons, are for informational and educational purposes only and should not be construed as a recommendation to invest, trade, and/or speculate in the markets. Any trades, and/or speculations made in light of the ideas, opinions, and/or forecasts, expressed or implied herein, are committed at your own risk, financial or otherwise.
The use of the site is agreement that the site is for informational and educational purposes only and does not constitute advice in any form in the furtherance of any trade or trading decisions.
The accuracy, completeness and timeliness of the information contained on this site cannot be guaranteed. IC Markets does not warranty, guarantee or make any representations, or assume any liability with regard to financial results based on the use of the information in the site.
News, views, opinions, recommendations and other information obtained from sources outside of www.icmarkets.com.au, used in this site are believed to be reliable, but we cannot guarantee their accuracy or completeness. All such information is subject to change at any time without notice. IC Markets assumes no responsibility for the content of any linked site. The fact that such links may exist does not indicate approval or endorsement of any material contained on any linked site.
IC Markets is not liable for any harm caused by the transmission, through accessing the services or information on this site, of a computer virus, or other computer code or programming device that might be used to access, delete, damage, disable, disrupt or otherwise impede in any manner, the operation of the site or of any user’s software, hardware, data or property.


