
EUR/USD:
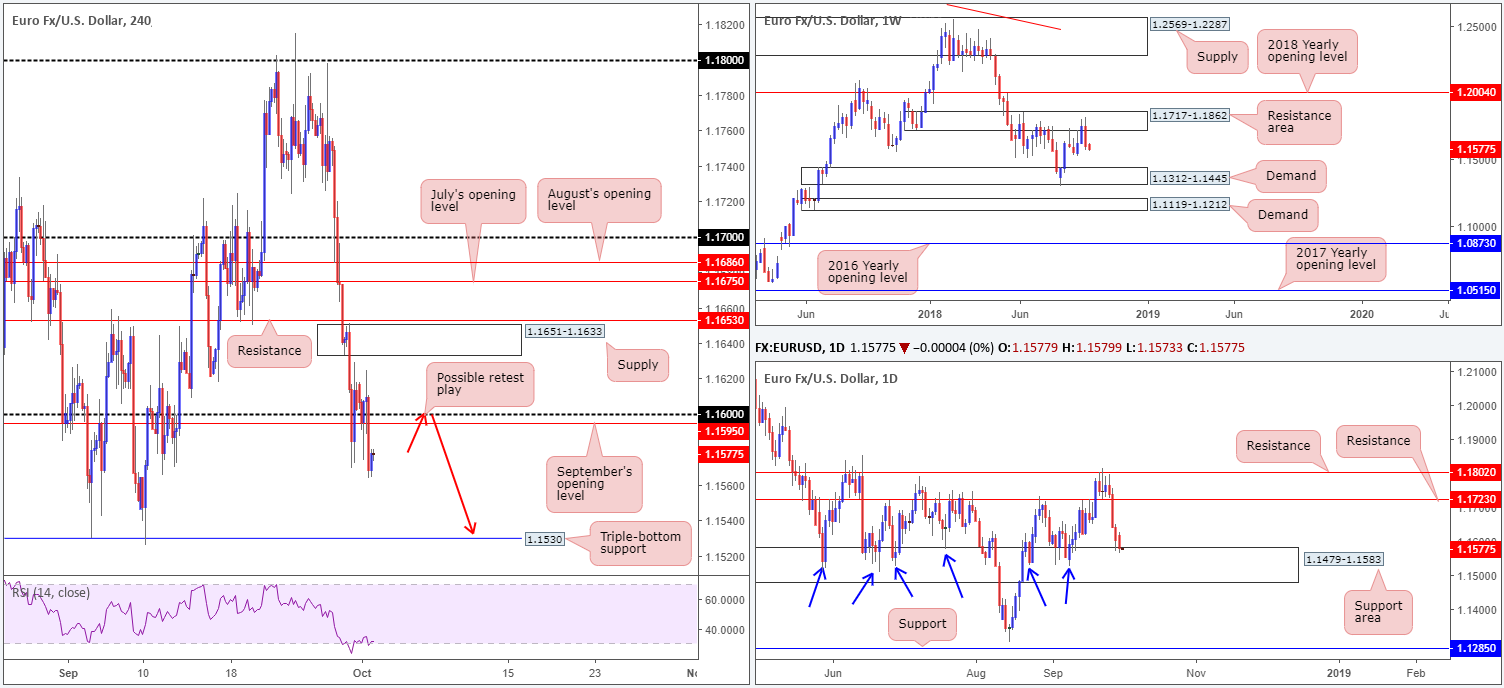
Mixed Eurozone manufacturing PMIs, alongside a miss on German retail sales m/m, kept the EUR/USD on the losing side of the table on Monday, concluding trade sub 1.16. With stop-loss orders suffering beneath 1.16 on the H4 timeframe, the triple-bottom support located at 1.1530 is likely on the radar for many today.
On a wider focus, the key observation out of the weekly timeframe is its bearish engulfing formation printed from a resistance area at 1.1717-1.1862. Assuming further selling takes place this week, traders could attempt a run towards demand drawn from 1.1312-1.1445.
The daily timeframe, however, is seen grappling with the top edge of a support area penciled in at 1.1479-1.1583. It might be worth noting a break of this zone almost immediately places weekly traders within close proximity of its demand mentioned above at 1.1312-1.1445.
Areas of consideration:
While weekly price supports a short from the underside of 1.16/September’s opening level at 1.1595 today (a retest play), daily action has unfortunately thrown up its red flag given the unit recently shook hands with a support area coming in at 1.1479-1.1583.
On account of the above, traders are urged to exercise caution around 1.16. Waiting for additional H4 candlestick confirmation is certainly worth considering before pressing the sell button, as this will help determine seller intent and provide a location for both entry and stops. In the event this trade comes to fruition, the initial downside target falls in around 1.1530: the triple-bottom support highlighted above.
Today’s data points: FOMC member Quarles speaks; Fed Chairman Powell speaks.
GBP/USD:
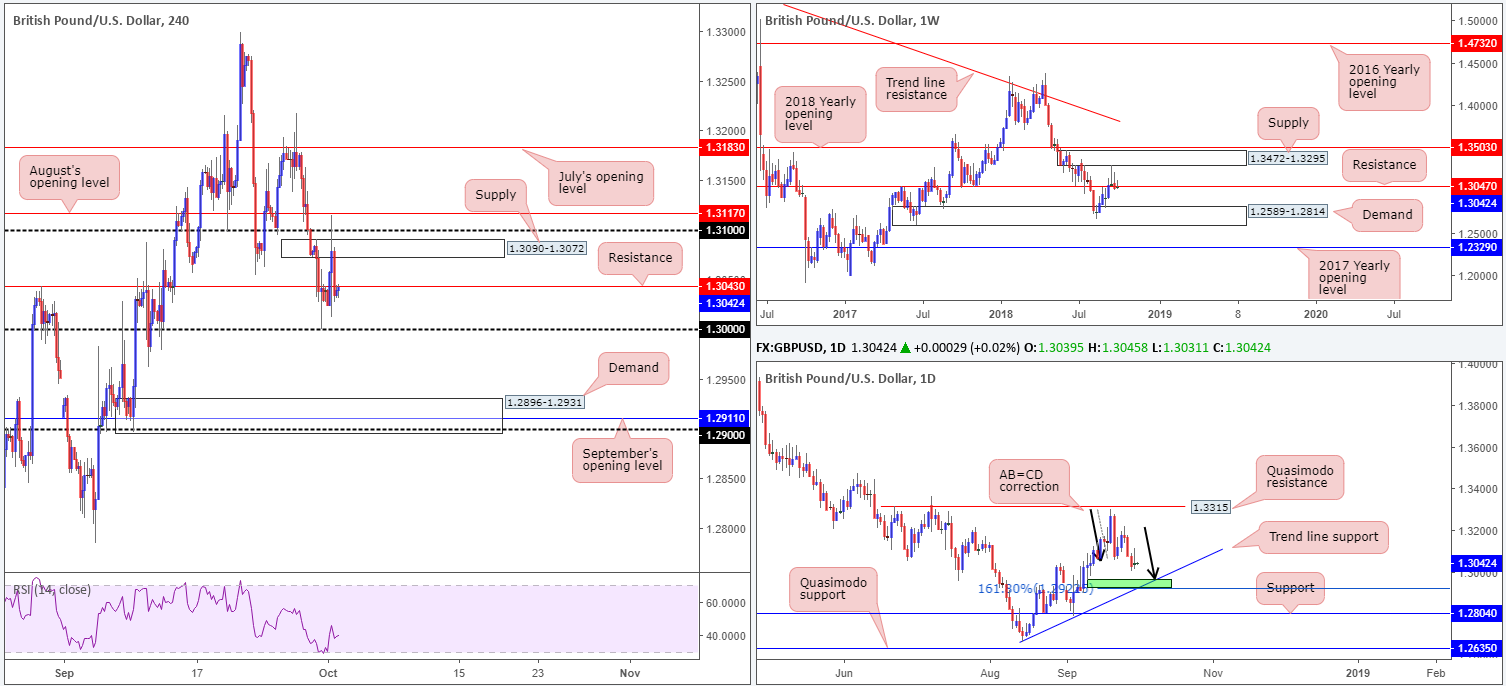
The pound received fresh impetus on Brexit-related momentum during yesterday’s session, amid news the UK may be considering an Irish border compromise on customs to facilitate a deal with the EU. H4 movement, as you can see, hit highs of 1.3115, momentarily exploring levels beyond supply at 1.3090-1.3072 and the 1.31 handle.
Despite the above, Cable ended the day a handful of pips above where it started: beneath H4 resistance at 1.3043.
In terms of where we stand on the bigger picture, the weekly timeframe concluded last week forming a bearish pin-bar pattern that marginally closed beneath support at 1.3047 (now acting resistance). This – coupled with a second-rate recovery from demand at 1.2589-1.2814 over the past month (indicating weakness from the buy-side of this market) – could see the unit retest the noted demand with force this week.
Daily candles remain in the process of printing a nice-looking AB=CD bullish correction pattern (black arrows). Pattern completion, however, in our humble view, does not occur until we reach 1.2927 (green zone): its 161.8% Fib ext. point (frequently labelled an AB=CD alternate pattern). What’s also notable from a technical perspective is the trend line support seen intersecting with this region (taken from the low 1.2661).
Areas of consideration:
Technically speaking, 1.30 continues to emphasize a fragile state. Aside from 1.3043: the H4 resistance seen stationed nearby, we also have to take into account both weekly and daily flow suggests further downside may be in store for the time being.
With this in mind, two tradable scenarios remain in the offing:
- Simply watch for 1.30 to be taken out. A H4 close beyond this number that’s followed up with a retest in the shape of a bearish candlestick formation would likely be enough evidence to suggest further selling towards H4 demand at 1.2896-1.2931. Stop-loss orders and entry are dictated by the candlestick structure selected.
- The H4 demand, aside from being a take-profit target for shorts, is also a zone worthy of longs. Not only does it house September’s opening level at 1.2911 and the 1.29 handle, it also converges with the daily AB=CD termination point marked in green at 1.2927. Collectively, this is likely enough confluence to produce a bounce, at the very least.
Today’s data points: UK construction PMI; FOMC member Quarles speaks; Fed Chairman Powell speaks.
AUD/USD:
AUD/USD movement on Monday was as about exciting as watching paint dry!
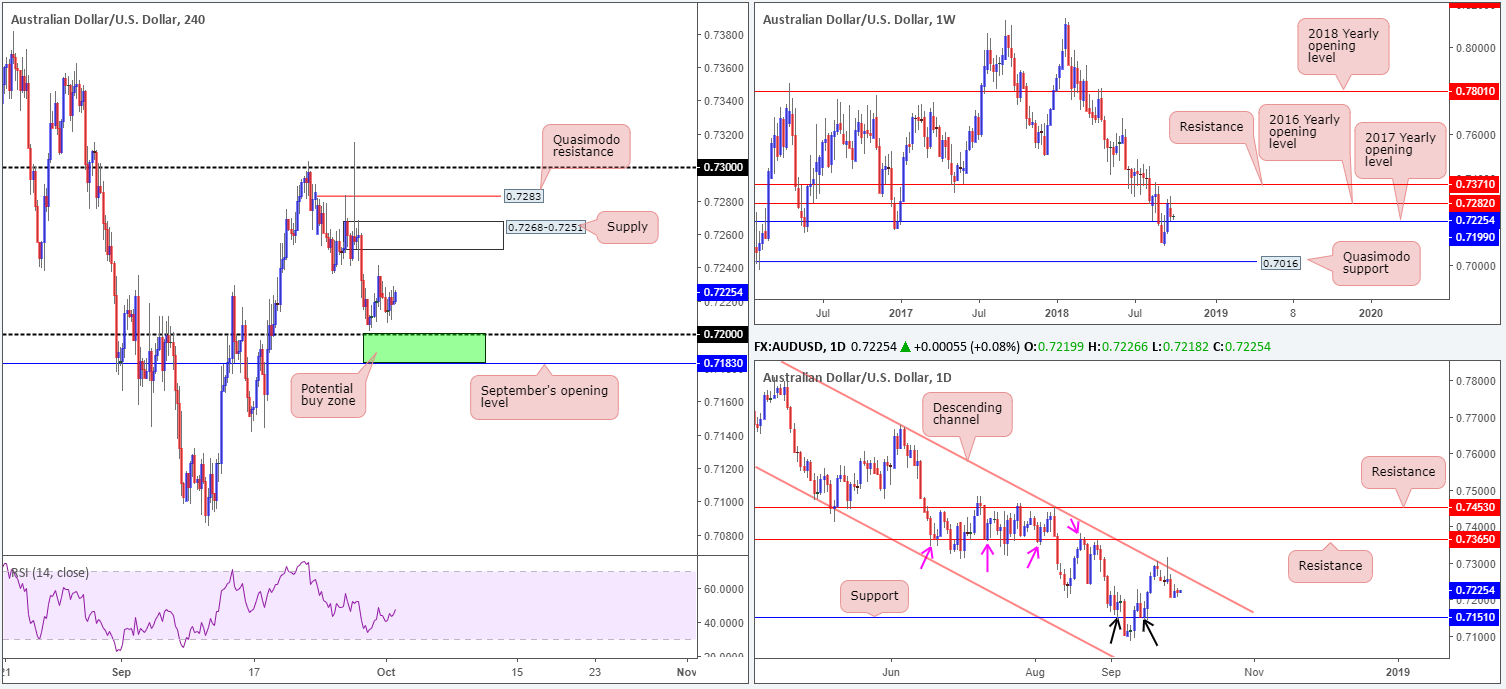
The commodity currency heads into Tuesday’s session consolidating just north of its 0.72 handle on the H4 timeframe, consequently ending the session pretty much unchanged.
As a result of this, much of the following report will echo thoughts put forward in Monday’s analysis.
Weekly flow remains firm just ahead of its 2017 yearly opening level placed at 0.7199 (also represents 0.72 on the H4). Overhead, traders are likely honing in on the 2016 yearly opening level at 0.7282. Should we get beyond 0.7199 this week, the September 10 lows of 0.7085 are in view, followed by Quasimodo support at 0.7016.
Fading a long-term channel resistance (penciled in from the high of 0.8135) in the shape of a bearish pin-bar formation on Wednesday, along with Thursday’s precipitous decline last week, the daily timeframe continues to communicate a bearish tone towards support at 0.7151.
Areas of consideration:
Although daily price emphasizes a southerly tone, both H4 and weekly structure show support nearby. As a matter of fact, the team feels the 0.7183/0.72 (green area comprised of September’s opening level and the round number 0.72/2017 yearly opening level at 0.7199 on the weekly) H4 zone is worthy of consideration for longs. Conservative traders may wish to wait and see if H4 price can chalk up a bullish candlestick formation before pulling trigger from here, given the threat of further downside on the daily timeframe. The initial upside target from the noted buy zone falls in around the September 28 high 0.7241, followed by H4 supply at 0.7268-0.7251.
Ahead of this morning’s showing from the Reserve Bank of Australia (RBA), however, we do not anticipate much action being seen.
Today’s data points: AUD rate statement and cash rate decision; FOMC member Quarles speaks; Fed Chairman Powell speaks.
USD/JPY:
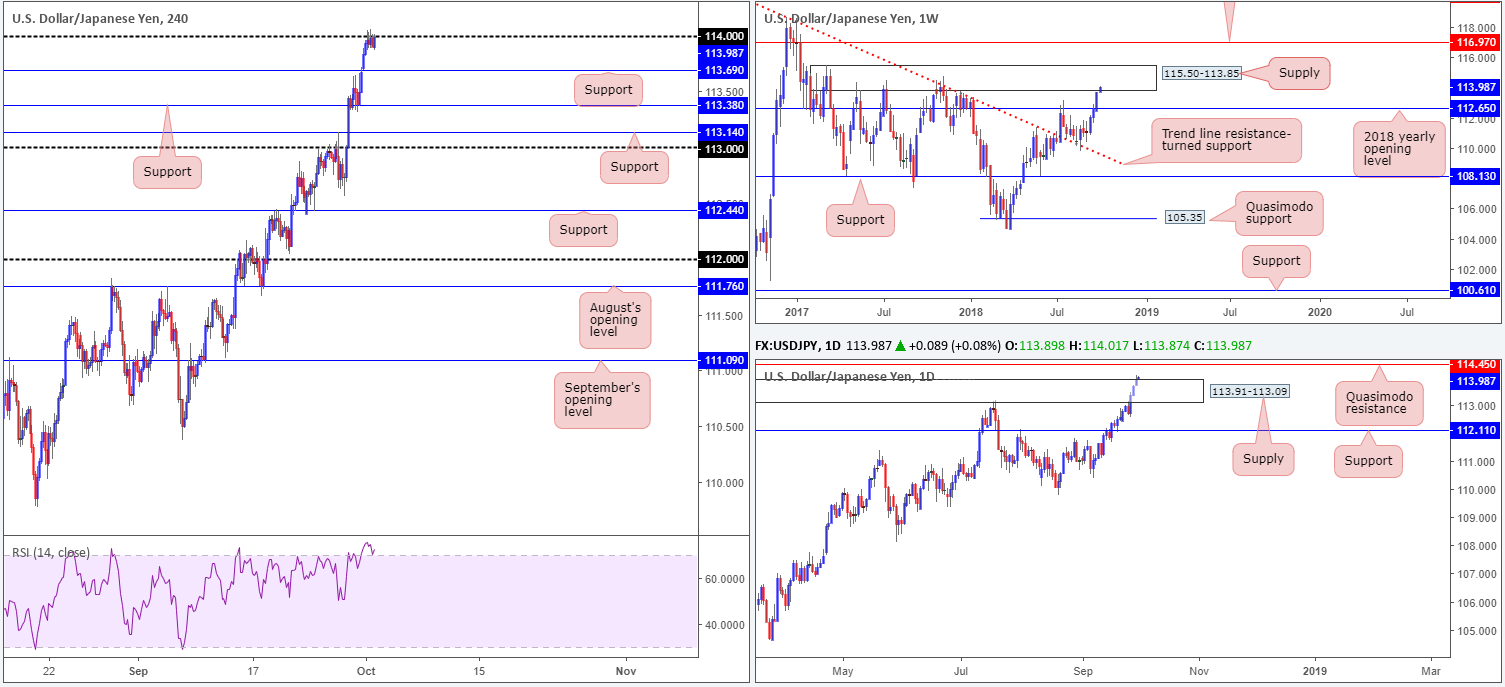
USD/JPY bulls kicked off October on a high note, reaching fresh 2018 highs of 114.06. Following dips in Japan’s Q3 Tankan survey and September’s manufacturing PMI, the pair eventually shook hands with its 114 handle on the H4 timeframe.
As is evident from the H4, price remains in a consolidative state just south of 114 at the moment, with the H4 RSI exploring higher ground in overbought territory.
Can 114 hold up to further bullish momentum?
In terms of the daily chart, technicals suggest we’re heading higher. In recent sessions, supply at 113.91-113.09 was engulfed, potentially clearing the pathway north towards Quasimodo resistance at 114.50. On the other hand, though, traders are also urged to consider weekly action, which happens to be crossing swords with the lower edge of a supply zone at 115.50-113.85.
Note, the aforementioned daily Quasimodo resistance is sited within the lower limits of the said weekly supply.
Areas of consideration:
From a technical standpoint, the radar is firmly fixed on a possible short from the daily Quasimodo resistance mentioned above at 114.45. With stop-loss orders positioned above the apex of this Quasimodo formation at 114.73 (114.75 to include spread/slippage), this equates to a 30-pip stop. The first take-profit target from 114.45 rests at the 114 handle on the H4, offering reasonable risk/reward: 1.5 times the position risk.
Today’s data points: FOMC member Quarles speaks; Fed Chairman Powell speaks.
USD/CAD:
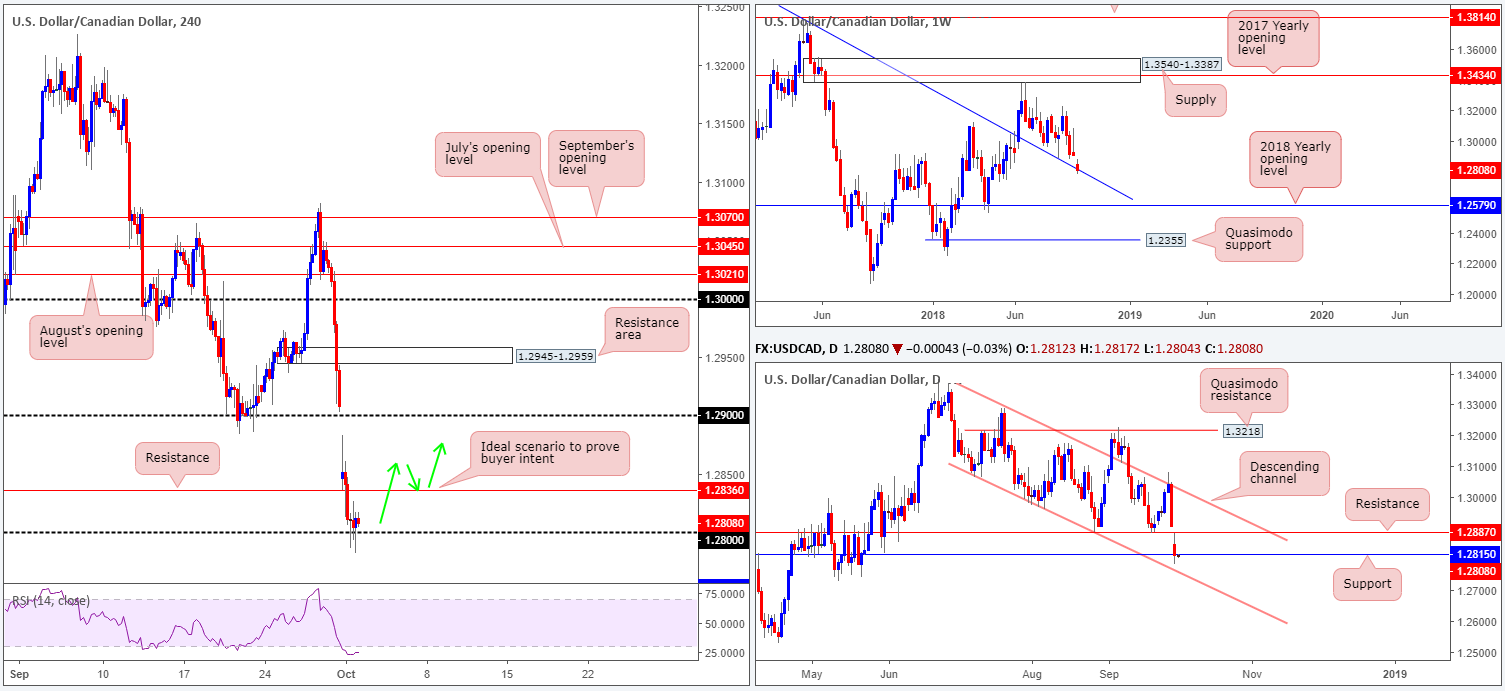
The USD/CAD gapped south at the open as the Canadian dollar gathered momentum amid news the US, Canada and Mexico reached a deal. US President Trump held a conference on a new trade deal with Canada and Mexico where he announced to expect to sign the new trilateral deal by the end of November.
The H4 candles, as you can see, momentarily explored space beyond its 1.28 mark, tapping levels not seen since May 2018. 1.28, however, remained defensive into the close, poised to retest the underside of support-turned resistance at 1.2836. Also worth taking into account on this scale is the RSI indicator displaying a strong oversold reading.
Price action on the weekly scale, thanks to yesterday’s precipitous decline, is seen tackling a trend line resistance-turned support (extended from the high 1.4689). This barrier supported this market once already back in late August, so there’s a chance we may see history repeat itself. The story on the daily timeframe, nevertheless, brings attention to support at 1.2815 that’s sited just north of a channel support (extended from the low 1.3066).
Areas of consideration:
From a technical perspective, support is present on all three timeframes we watch:
- Weekly trend line resistance-turned support (extended from the high 1.4689).
- Daily support at 1.2815.
- The 1.28 level on the H4 timeframe.
To prove buyer intent out of these supports, an engulf of nearby H4 resistance at 1.2836 would be ideal. A H4 close above this level that’s followed up with a retest in the shape of a bullish candlestick formation would likely be enough to draw in buyer momentum towards daily resistance at 1.2887, followed closely by the 1.29 handle.
As for entry and stop-loss placement, traders are urged to use the selected candlestick pattern to determine these parameters.
Today’s data points: FOMC member Quarles speaks; Fed Chairman Powell speaks.
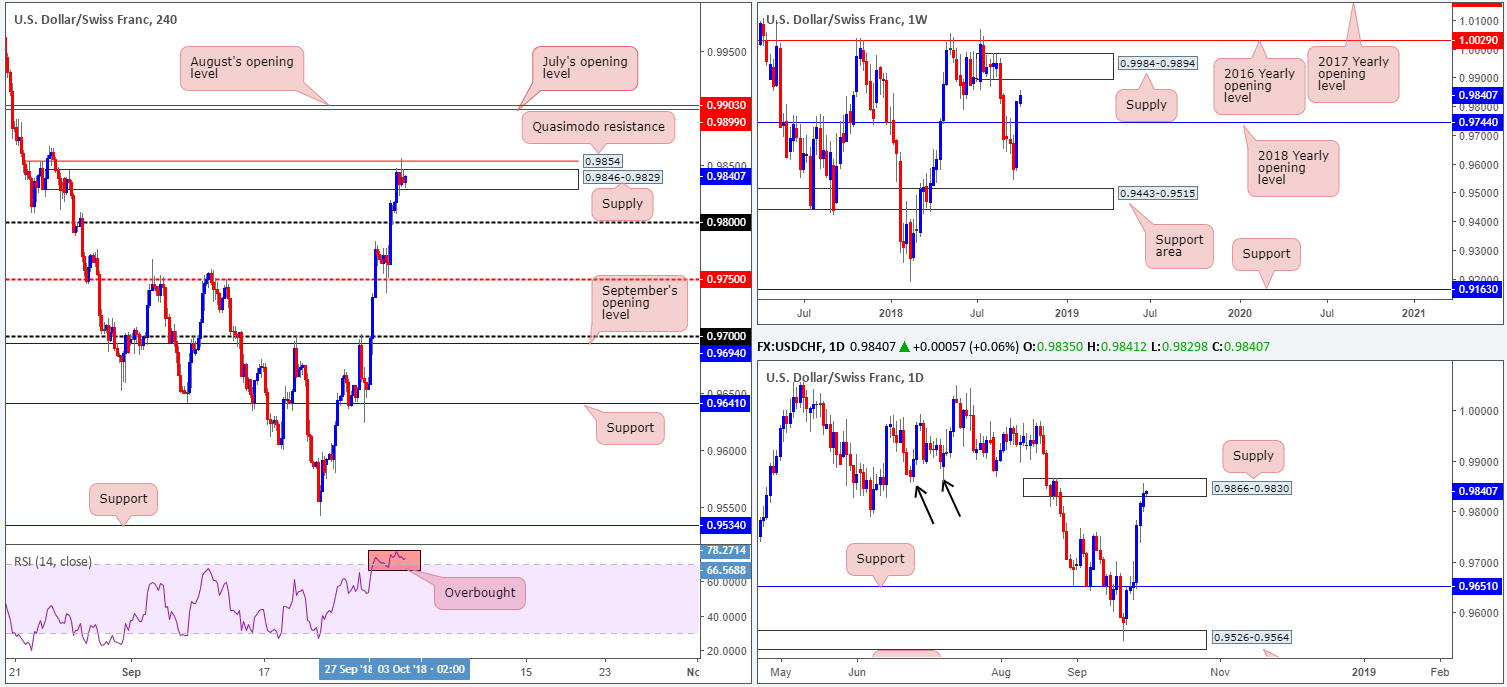
USD/CHF:
For those who read Monday’s briefing you may recall the team highlighted a H4 Quasimodo resistance level at 0.9854 for possible shorts this week. As you can see from the chart, price broke the top edge of H4 supply at 0.9846-0.9829, as expected, and tested 0.9854 almost to the pip.
The rationale behind selecting this level was due to it offering the best bang for our buck. Shorting from the noted Quasimodo resistance level not only allowed traders to position stops above its surrounding daily supply at 0.9866-0.9830, it also brought in stops taken from above the H4 supply to sell into (stops taken from sellers are automatically buy orders). What also drew attention was the fact the daily supply was attractive, by and of itself. Aside from this area delivering solid downside momentum from its base, it was effectively the decision point to break through support marked with two black arrows around the 0.9855 neighbourhood.
Well done to any of our readers who managed to jump aboard 0.9854!
Areas of consideration:
For folks who are short from 0.9854, the 0.98 handle on the H4 timeframe appears a logical downside target, despite price seen struggling to get beyond 0.9830. Should price retest 0.98, traders are looking at an impressive risk/reward calculation: nearly 4 times the position risk, assuming one has placed the stop two pips above the daily supply at 0.9868.
Conservative traders are urged to consider reducing risk to breakeven at this point, in the event price fails to extend beyond 0.9830.
Today’s data points: FOMC member Quarles speaks; Fed Chairman Powell speaks.
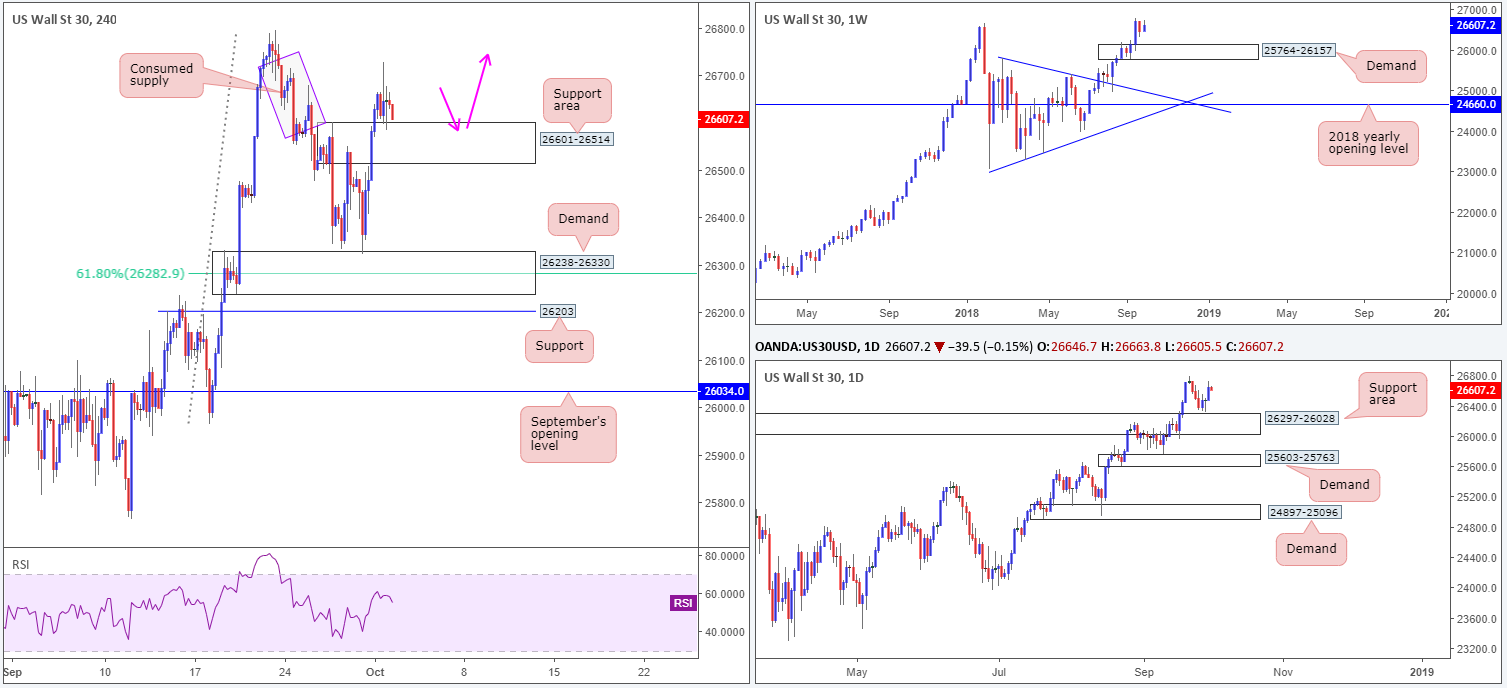
Dow Jones Industrial Average:
US equities began October on a positive note, with investors cheering news the US, Canada and Mexico reached a deal. US President Trump held a conference on a new trade deal with Canada and Mexico where he announced to expect to sign the new trilateral deal by the end of November.
In Monday’s report, our technical studies reported a possible break of H4 supply at 26601-26514 for traders long from H4 demand at 26238-26330. Beyond 26601-26514, now an acting support area thanks to yesterday’s push higher, we do not see much in the way of active supply stopping the unit from advancing to test record highs. For that reason, longs on any retest seen at 26601-26514 is still something to keep an eye on (pink arrows), both for traders who missed the initial buy from demand, and those who wish to pyramid their current long position.
It might also be worth noting where we’re coming from on the higher timeframes. The current H4 demand zone is positioned around the top edge of a daily support area marked at 26297-26028, which itself is reinforced by a weekly demand area visible from 25764-26157.
Areas of consideration:
Traders who believe the current H4 support area at 26601-26514 offers value to longs, stop-loss orders can be positioned a couple of points beneath the zone’s lower edge, with an initial take-profit target set at 26794: record highs. Conservative traders, on the other hand, may want to consider waiting for additional candlestick confirmation before pulling the trigger. That way traders are informed as to whether buyer intent exists here, though do bear in mind this is no way a guarantee the trade will enter favourable ground.
Today’s data points: FOMC member Quarles speaks; Fed Chairman Powell speaks.
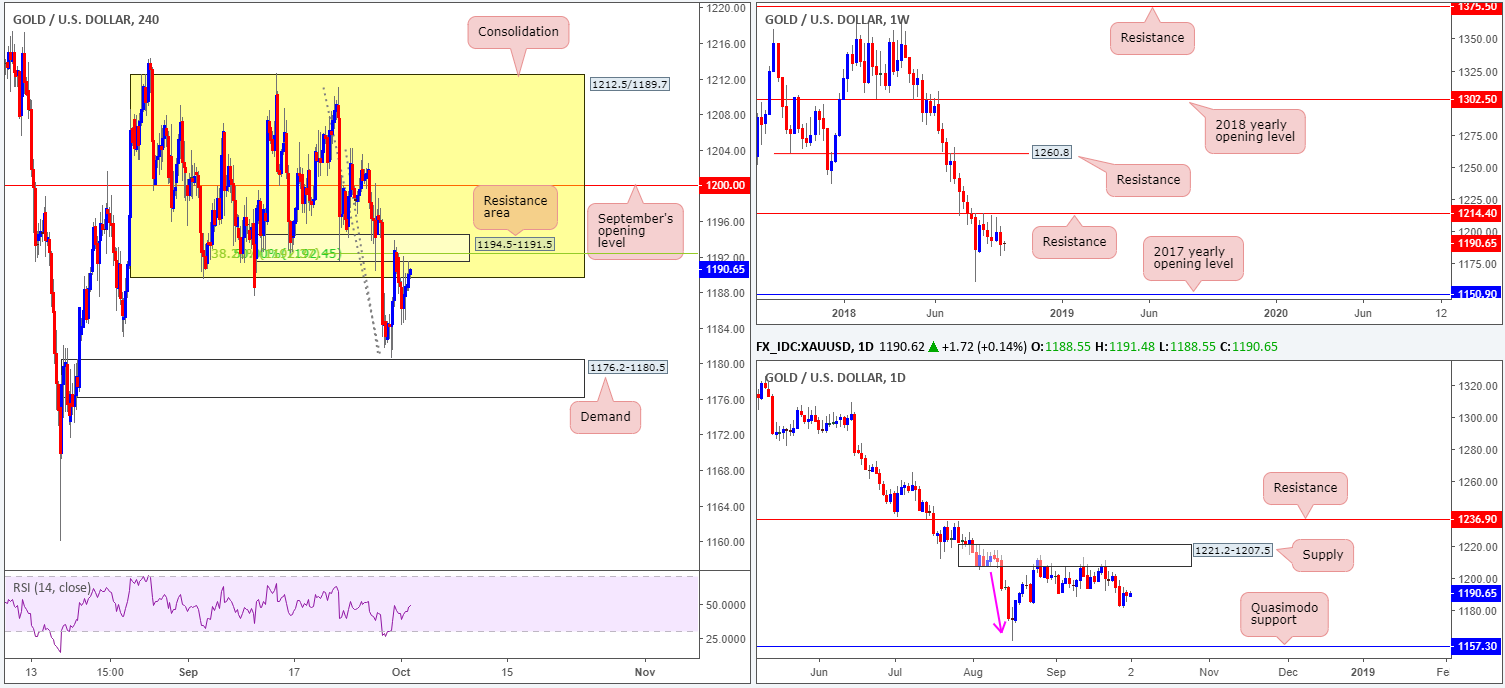
XAU/USD (Gold)
As can be seen from the H4 timeframe this morning, the yellow metal remains capped beneath a small resistance area at 1194.5-1191.5, which happens to not only be positioned around the underside of its consolidation zone (yellow) between 1212.5/1189.7, it also boasts a rather healthy Fibonacci resistance cluster seen sited around 1192.4.
With weekly price exploring ground beneath a key resistance level coming in at 1214.4, and daily price drawing in sellers from nearby supply at 1221.2-1207.5, further selling is still likely in store. Ultimately, the first downside support target on the bigger picture falls in around the daily Quasimodo support at 1157.3, followed closely by the 2017 yearly opening level at 1150.9.
Areas of consideration:
Given the above reading, shorts from the current H4 resistance area at 1194.5-1191.5 are still an option today. However, due to the threat of a possible 1:1 move up to September’s opening level at 1200.0, waiting for additional bearish candlestick confirmation is certainly worth considering before pulling the trigger. In terms of the first take-profit target, eyes are on the H4 demand area at 1176.2-1180.5.
The use of the site is agreement that the site is for informational and educational purposes only and does not constitute advice in any form in the furtherance of any trade or trading decisions.
The accuracy, completeness and timeliness of the information contained on this site cannot be guaranteed. IC Markets does not warranty, guarantee or make any representations, or assume any liability with regard to financial results based on the use of the information in the site.
News, views, opinions, recommendations and other information obtained from sources outside of www.icmarkets.com.au, used in this site are believed to be reliable, but we cannot guarantee their accuracy or completeness. All such information is subject to change at any time without notice. IC Markets assumes no responsibility for the content of any linked site. The fact that such links may exist does not indicate approval or endorsement of any material contained on any linked site.
IC Markets is not liable for any harm caused by the transmission, through accessing the services or information on this site, of a computer virus, or other computer code or programming device that might be used to access, delete, damage, disable, disrupt or otherwise impede in any manner, the operation of the site or of any user’s software, hardware, data or property.


