
EUR/USD:
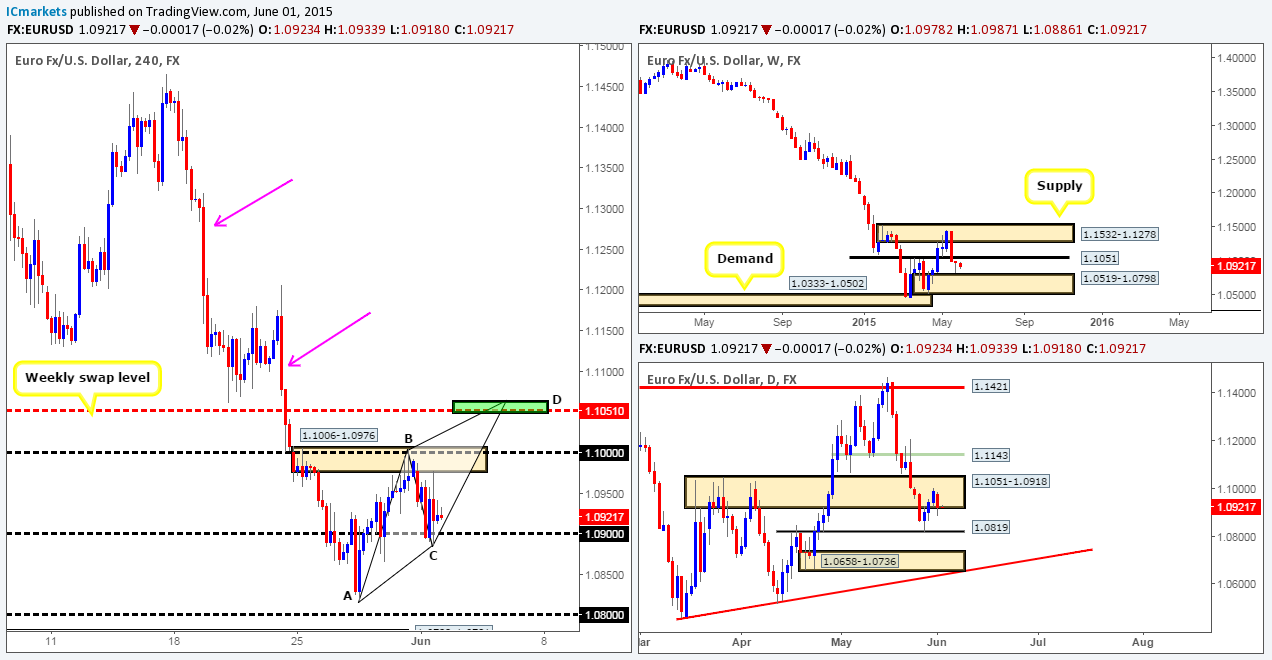
Weekly view – From a long-term standpoint, the trend on this pair is still southbound in our opinion, and will only change once price closes above the weekly supply area at 1.1532-1.1278.
Recent action, however, shows that the Euro is now trapped between a weekly swap level seen at 1.1051 and a weekly demand area coming in at 1.0519-1.0798.
Daily view: From this angle, we can see that selling interest came into the market yesterday from within a daily swap area visible at 1.1051-1.0918, erasing any gains the market had picked up on Friday.
4hr view: The recent decline saw the Euro sell off from a combined 4hr supply/round-number area seen at 1.1006-1.0976/1.1000. This move, as you can see forced price to test 1.0900, which has so far held firm. If 1.0900 continues to hold going into today’s sessions, a rally may ensue up to the weekly swap level 1.1051 (supply has likely been consumed around the aforementioned combined 4hr area now). If this does occur, we believe 1.1051 to be a high-probability turning point in the market for the following reasons:
- It converges with a near perfect AB=CD pattern. The green area (1.1063/1.1049) represents the AB=CD leg distance, and a 1.27 AB Fibonacci extension.
- The momentum on this timeframe is clearly south at the moment. Check out the pink arrows. Therefore, shorting at the AB=CD completion point would see you trading with current order flow, rather than against it.
If on the other hand a violation of 1.0900 is seen today, this could stimulate a decline in value down towards 1.0800 (essentially back down to the daily swap level region – 1.0819). Despite this, we’d only be interested in trading this move should price retest 1.0900 as resistance and show some form of lower timeframe selling signal.
Levels to watch/live orders:
- Buys: Flat (Predicative stop-loss orders seen at: N/A).
- Sells: 1.1063/1.1049 region [Tentative – confirmation required] (Predicative stop-loss orders seen at: dependent on where one confirms this area).
GBP/USD:
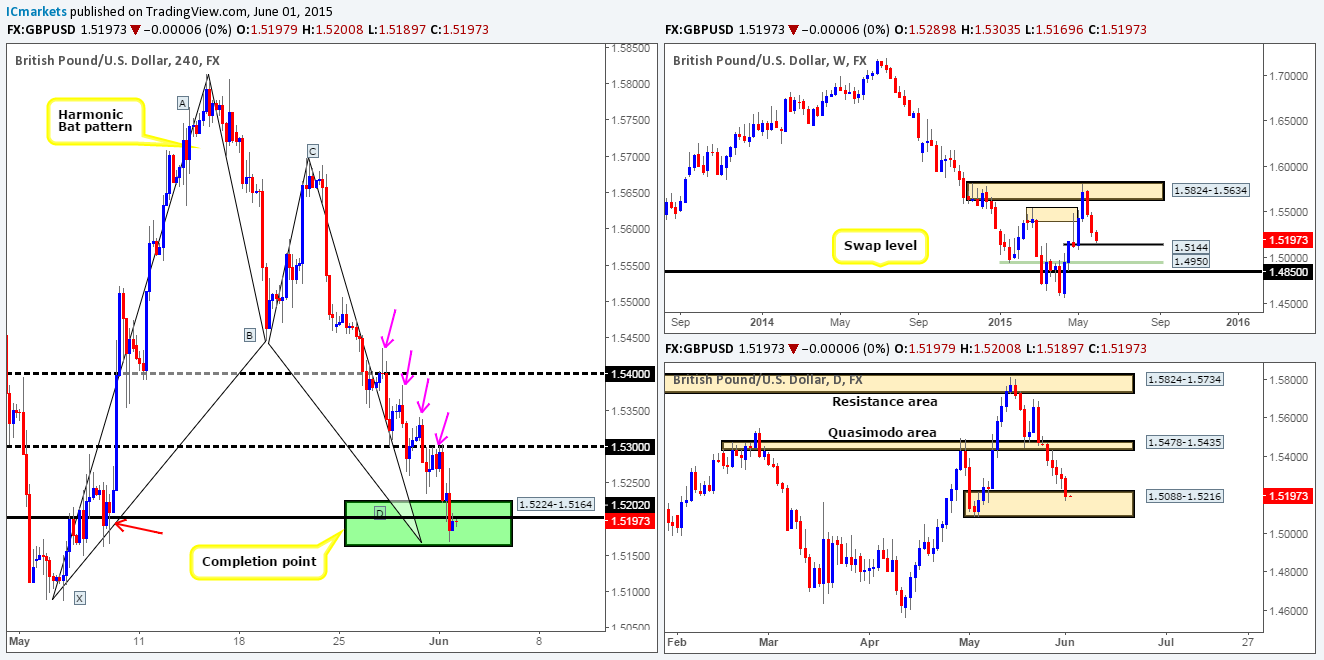
Weekly view – The weekly timeframe shows that price is now trading only a stone’s throw away from a weekly swap level coming in at 1.5144.
Daily view: From this viewpoint, we can see that the GBP has entered into the jaws of a daily demand zone seen at 1.5088-1.5216, which if you look back to the weekly chart, you’ll notice that this area surrounds the aforementioned weekly swap level.
4hr view: Amid yesterday’s sessions, price sold off from 1.5300 and drove itself deep into the 4hr Harmonic Bat completion area seen in green at 1.5224-1.5164 (located around the upper limits of the aforementioned daily demand area), consequently forming a near-perfect four-drive pattern on approach (pink arrows), and triggering our buy order at 1.5228. As already mentioned in our previous analysis, this 4hr Harmonic support zone also correlates with not only a 4hr demand area seen marked with a red arrow at 1.5162-1.5191, but also round-number support at 1.5200.
The drive into our 4hr Harmonic zone was strong, which as you can see broke below 1.5200 – not really what we wanted to see to be honest. If price can break back above this psychological threshold we may have a chance here. If things do start turning around for us, our first take-profit area will be 1.5300, the second at 1.5400 which converges with the Fibonacci retracement value 0.382 (A-D retracement), and finally the third and final take-profit zone will likely be set around the 1.5550 mark – the 0.618 Fibonacci retracement level.
Levels to watch/ live orders:
- Buys: 1.5228 [Live] (Predicative stop-loss orders seen at: 1.5140).
- Sells: Flat (Predicative stop-loss orders seen at: N/A).
AUD/USD:
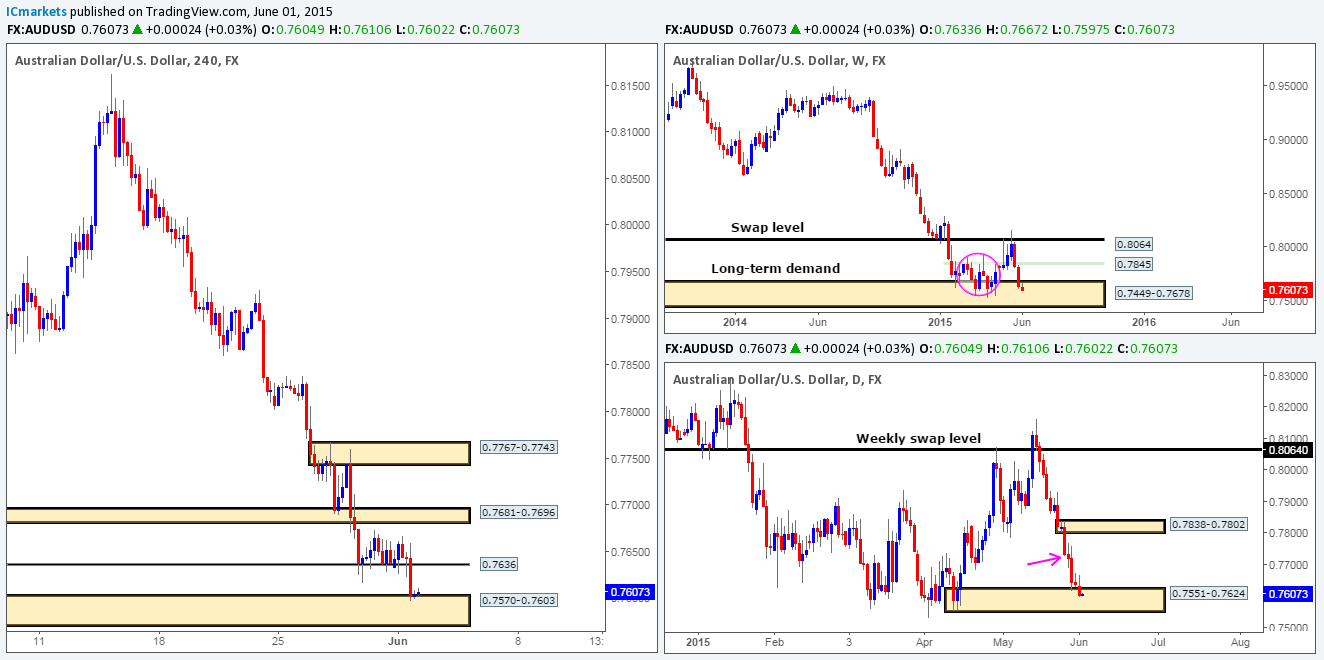
Weekly view – Long term, the trend on this pair is still southbound in our opinion, and will remain that way until we see a convincing push above 0.8064.
Current action on the other hand, shows that price is now trading within a long-term weekly demand area coming in at 0.7449-0.7678. Judging by the sloppy reaction seen (pink circle – 02/02/15-06/04/15) at this zone a few months earlier, however, things could potentially get messy here once again.
Daily view: From the pits of the daily scale, we can see that price recently touched base with a relatively strong- looking daily demand zone at 0.7551-0.7624 (located within the aforementioned weekly demand area). Assuming that buying interest comes into the market here this week, areas to keep an eye on for downward pressure come in at 0.7767-0.7734 (pink arrow), and the small daily supply area sitting just above it at 0.7838-0.7802.
4hr view: For those of you that have been following our previous reports on the AUD/USD pair, you may recall that we have had our eye on the 4hr demand area at 0.7570-0.7603 for quite some time now. We set a pending buy order just above this zone last week at 0.7605, which as you can see have now been triggered.
The reasons for entering here are as follows (repeated from the previous analysis):
- Positioned deep within the aforementioned daily demand zone. From our experience, areas located deep within higher timeframe zones have a higher probability of seeing a decent move.
- Lines up beautifully with the psychological threshold 0.7600.
- If you scroll back to the 15/04/15 where the 4hr demand zone formed, you’ll likely notice how strong the momentum from this area was! It was incredibly violent, indicating there may still be unfilled buy orders remaining with this area.
Our first take-profit target will be around 0.7636. A break above this barrier would be fantastic since we could then move our stop to breakeven and trail price up to at least the 4hr swap area seen at 0.7681-0.7696.
Levels to watch/ live orders:
- Buys: 0.7605 [Live] (Predicative stop-loss orders seen at: 0.7565).
- Sells: Flat (Predicative stop-loss orders seen at: N/A).
USD/JPY:
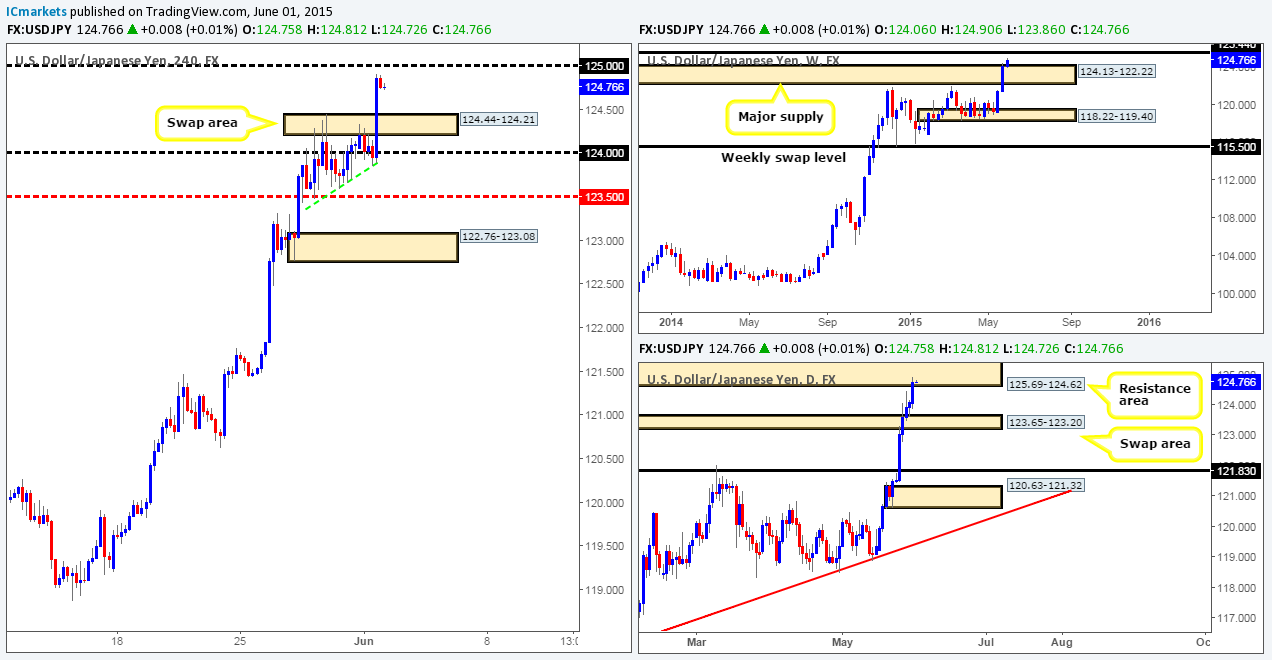
Weekly view – Essentially, the outlook on this pair remains positive. It is only once we see a close below the weekly swap level 115.50 will we be convinced the trend may be shifting.
Following the strong buying over the past two weeks, price continues to march north, pushing this market further above the major weekly supply area at 124.13-122.22. If this buying continues, we may see price shake hands with a major weekly swap level coming in at 125.44.
Daily view: From this viewpoint, it is clear to see that price has now connected with a daily resistance area visible at 125.69-124.62, which, if you look back to the weekly chart, you’ll notice that this zone surrounds the aforementioned weekly swap level.
4hr view: The 4hr timeframe shows that the recent surge from the 124.00 psychological threshold begun once the U.S session opened for business (the point where the London and U.S sessions overlap – volatility is usually seen). The push was strong, and took out a minor 4hr resistance area at 124.44-124.21. It was only once price hit 124.90 – only ten pips below 125.00, did we see the market stabilize.
So that we’re all on the same page here, let’s just quickly recap… The weekly chart shows price appears to be heading for the weekly swap level 125.44, while the daily chart shows price has already reached a daily resistance area at 125.69-124.62. So, where does this leave us on the 4hr chart? Well, we could short from 125.00 should price reach this number. In doing so, we would have higher-timeframe selling pressure from the aforementioned daily resistance area likely by our side. However, against us is the possibility that price may fake out above 125.00 to the mid-level number 125.50, which is effectively the weekly swap level 125.44.
Therefore, our team has come to a general consensus that shorting from 125.00 poses too much risk of a fakeout up to 125.50, since higher-timeframe information usually precedes that of the lower timeframe. Once, or indeed if we see price break 125.00 and connect with 125.50, we may then consider a short trade.
Levels to watch/ live orders:
- Buys: Flat (Predicative stop-loss orders seen at: N/A).
- Sells: Flat (Predicative stop-loss orders seen at: N/A).
USD/CAD:
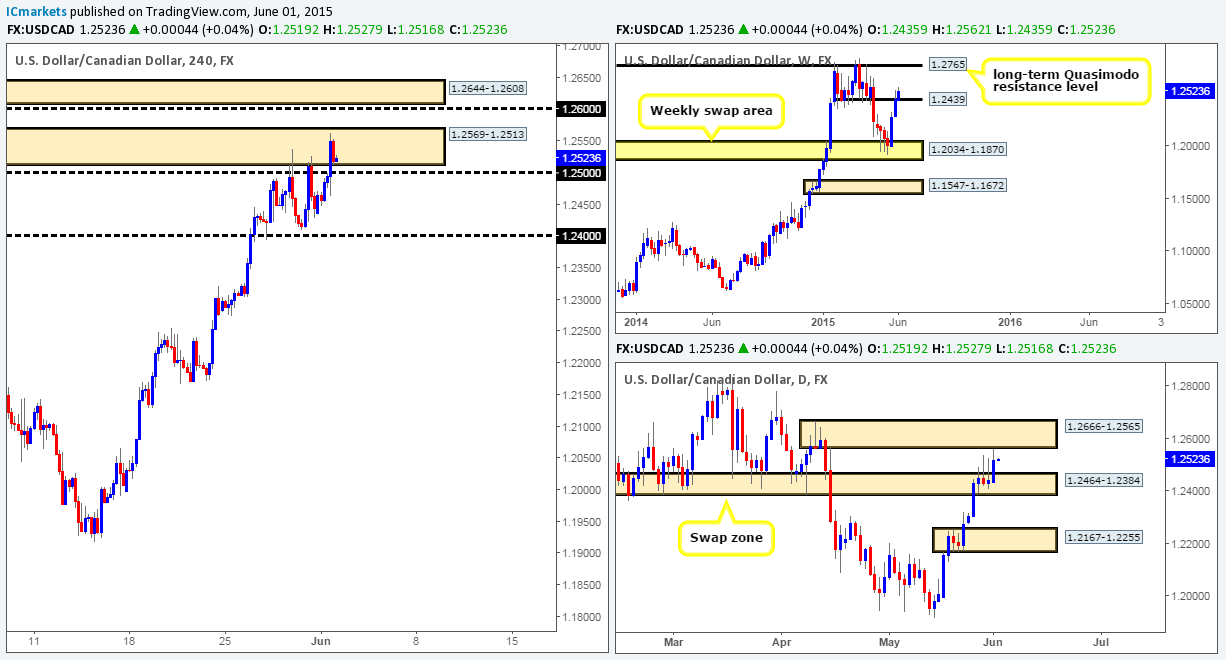
Weekly view – Overall, the trend on this pair is still pointing north. A break below the weekly swap area 1.2034-1.1870 would be required to invalidate this bias. Current action, however, is showing that the bulls continue to press forward despite only recently connecting with a weekly swap level coming in at 1.2439.
Daily view: From this angle, we can see that price is now trapped between a strong-looking daily supply area seen at 1.2666-1.2565 and a daily swap area at 1.2464-1.2384.
4hr view: For those who read yesterday’s report, you may recall that we had a sell position in the market at 1.2509 just below the 4hr supply zone at 1.2569-1.2513, which has now been closed for a very small profit as we bailed near breakeven during yesterday’s sessions.
The recent advance, as you can see, has pushed price deep into the aforementioned 4hr supply area. Trading short from this zone once more is not really something our team is interested in doing as we believe this area to be relatively weak now. As such, a long from 1.2500 could be a viable trade today, targeting the 4hr supply area above at 1.2644-1.2608 (located deep within the daily supply area mentioned above at 1.2666-1.2565). However, lower timeframe confirming price action is a MUST for us at this psychological number, since without it, this trade would be considered low probability and liable to a deep test/fakeout, so trade carefully here!
Levels to watch/ live orders:
- Buys: 1.2500 [Tentative – confirmation required] (Predicative stop-loss orders seen at: dependent on where one confirms this level).
- Sells: Flat (Predicative stop-loss orders seen at: N/A).
USD/CHF:
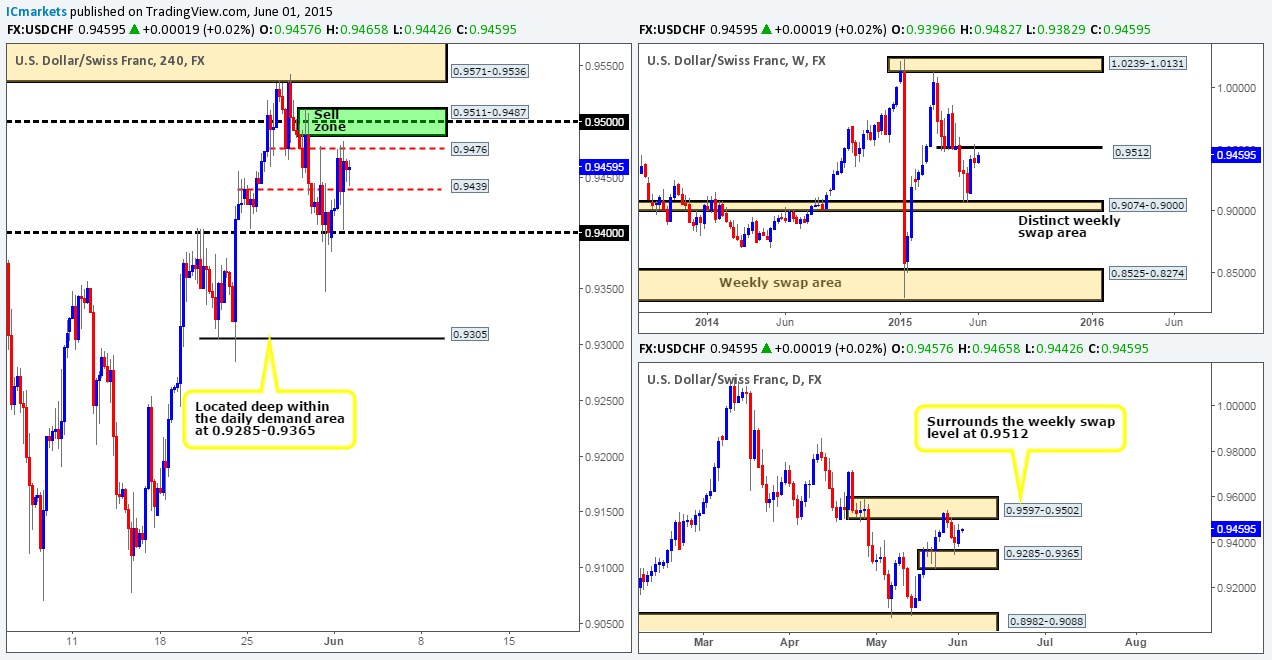
Weekly view – Following the rebound from the weekly swap level 0.9512, there has been little follow-through selling seen so far…
Daily view: The reason for why there has been little follow-through selling on the weekly timeframe is likely due to the daily demand area at 0.9285-0.9365 currently holding the market higher.
4hr view: From the 4hr timeframe, we can see that price did indeed rally from 0.9400, as expected. Nonetheless, price was unable to connect with 0.9500, which is where we believed price was headed.
For the time being, this pair is jammed between two minor 4hr swap levels – 0.9476 and 0.9439. Above this small consolidative branch, sits 0.9500, but more importantly, the weekly swap level 0.9512. We know that the first reaction from the weekly swap hurdle has so far not shown much progress (check the weekly chart), but there is a good chance a second retest will be far more active since some of the 4hr demand/buy-side liquidity below this area has likely been taken out now. Therefore, we have set a pending sell order at 0.9484 using 50% of our usual position. The remaining 50% will be entered once, or indeed if we see lower timeframe confirming price action.
Levels to watch/ live orders:
- Buys: Flat (Predicative stop-loss orders seen at: N/A).
- Sells: 0.9484 [50% of our usual position] (Predicative stop-loss orders seen at: 0.9545).
US 30:
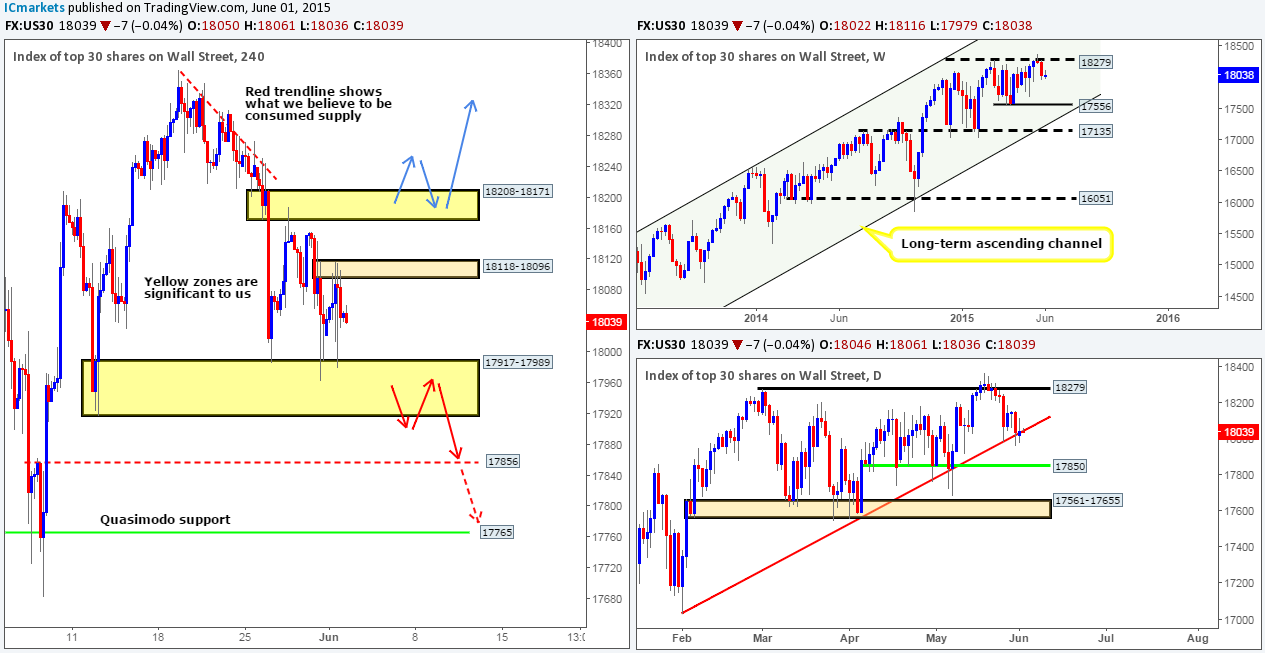
Weekly view – Overall, this index is still in a very strong uptrend. A push below the weekly support level 16051 would be required to invalidate this bias.
(Slightly revised) The weekly timeframe shows that relatively strong resistance came into the market recently from the 18279 region. In the event that further selling is seen from here, we may see price challenge the weekly swing low 17556.
Daily view: The view from here reveals that price continues to nibble at a daily trendline taken from the low 17033, with no real decision seen yet from either side of the market. Assuming that the buyers can hold out here, we may see a rally back up to the 18279 weekly level. Conversely, a break below this daily trendline would likely attract further selling down towards the daily support level 17850.
4hr view: From the 4hr scale, we can see price rebounded nicely from the 4hr demand 17917-17989. However, the rally from this 4hr zone was short lived since there was clearly very strong sell-side liquidity sitting around a small 4hr supply area sitting just above at 18118-18096. Our team has no interest in trying to trade in between these two zones. What we are interested in though is trading the break of either the aforementioned 4hr demand area, or the 4hr supply area seen at 18208-18171 (zones marked in yellow).
A push below the 4hr demand area would likely pave the way south towards the 4hr swap level at 17856 (positioned a few points above the aforementioned daily support level), or given enough time, the 4hr Quasimodo support level at 17765 (see red arrows). Conversely, a violation of the 4hr supply zone at 18208-18171 could potentially suggest further upside towards at least 18340. The reason we believe price could stretch that far is simply because above this 4hr supply area we see nothing but consumed sellers. The wicks you see poking above the red trendline was likely the work of pro money spiking north to fill any unfilled sell orders to continue shorting this market, thus once/if price reaches this area, the market should slice through this congested zone like a hot knife through butter (see blue arrows).
Entering on the break of either of the above 4hr zones will (for us) require a retest along with corresponding support from the lower timeframes to execute a position.
Levels to watch/ live orders:
- Buys: Flat (Predicative stop-loss orders seen at: N/A).
- Sells: Flat (Predicative stop-loss orders seen at: N/A).
XAU/USD (Gold)
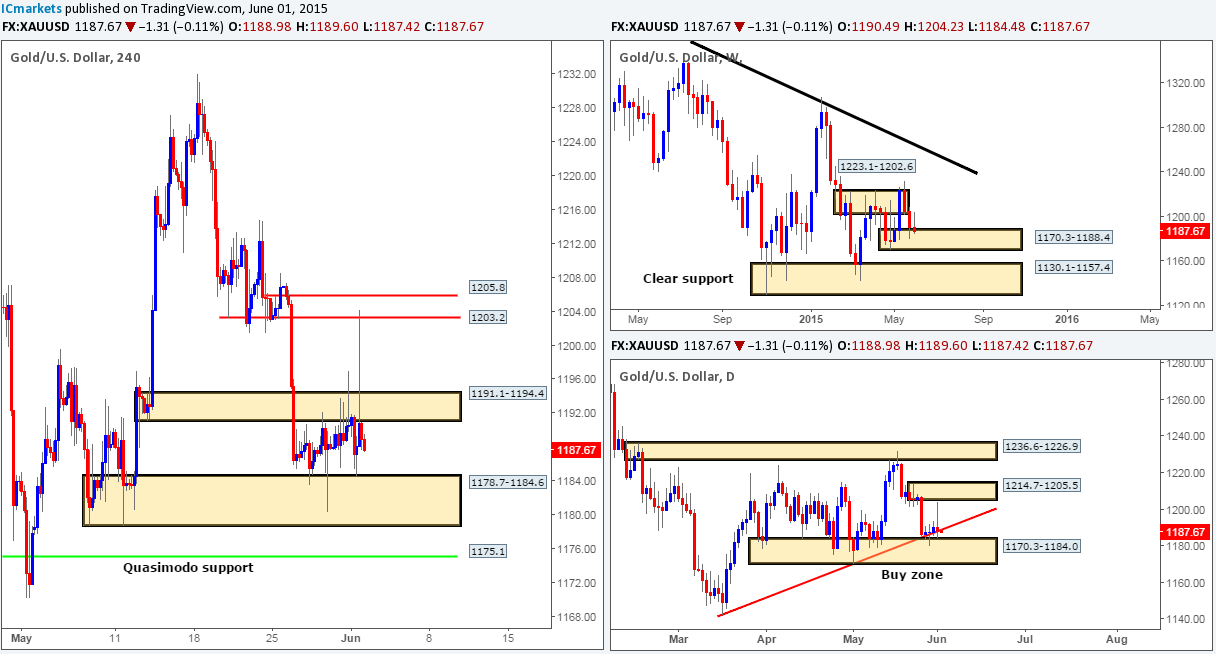
Weekly view – From a long-term perspective, the gold market is still trending south in our opinion. For this bias to be invalidated, a push above the weekly trendline extended from the high 1488.0 would need to be seen.
Recent action, however, shows that the buyers and sellers are currently battling for position around the top of a small weekly demand area seen at 1170.3-1188.4. Assuming this zone holds and a rally ensues, we could potentially see price attack the aforementioned weekly trendline sometime in the next few weeks.
Daily view: From this angle, we can see that the gold market saw quite a lot of volatility yesterday. The buyers attempted to push price north from daily buy zone at 1170.3-1184.0 (trendline convergence from the low 1142.5), but there was clearly far too much sell-side liquidity sitting just below the daily supply area at 1214.7-1205.5. If the buyers take a second shot at a push higher today, there’s a good chance price will connect with the daily supply area this time since the majority of supply below this zone is likely consumed consumed now.
4hr view: The 4hr timeframe shows that a violent spike north was seen amid yesterday’s sessions. This move broke above the 4hr swap area at 1191.1-1194.4, and connected with the 1203.2 level. However, after all of this, price ended up back where it started – trading in between the aforementioned 4hr swap area and the buy zone seen at 1178.7-1184.6.
As of now, we see two things potentially happening in this market. Firstly, price could rally once more (likely a little slower though this time) and close above the aforementioned 4hr swap area. This could be a good opportunity to begin watching for price to retest this area as demand for a continuation move north back up to the 1203.2 region.
Secondly, price may continue to munch its way south and fakeout below the aforementioned 4hr buy zone into the 4hr Quasimodo support level (located deep within the daily buy area mentioned above at 1170.3-1184.0). This barrier, in our opinion, is a fantastic area to look for longs should price reach this far south today (We have placed a small pending buy order at 1175.6, with a stop set just below at 1169.4).
Levels to watch/ live orders:
- Buys: 1175.6 (Predicative stop-loss orders seen at: 1169.4).
- Sells: Flat (Predicative stop-loss orders seen at: N/A).
