
EUR/USD:
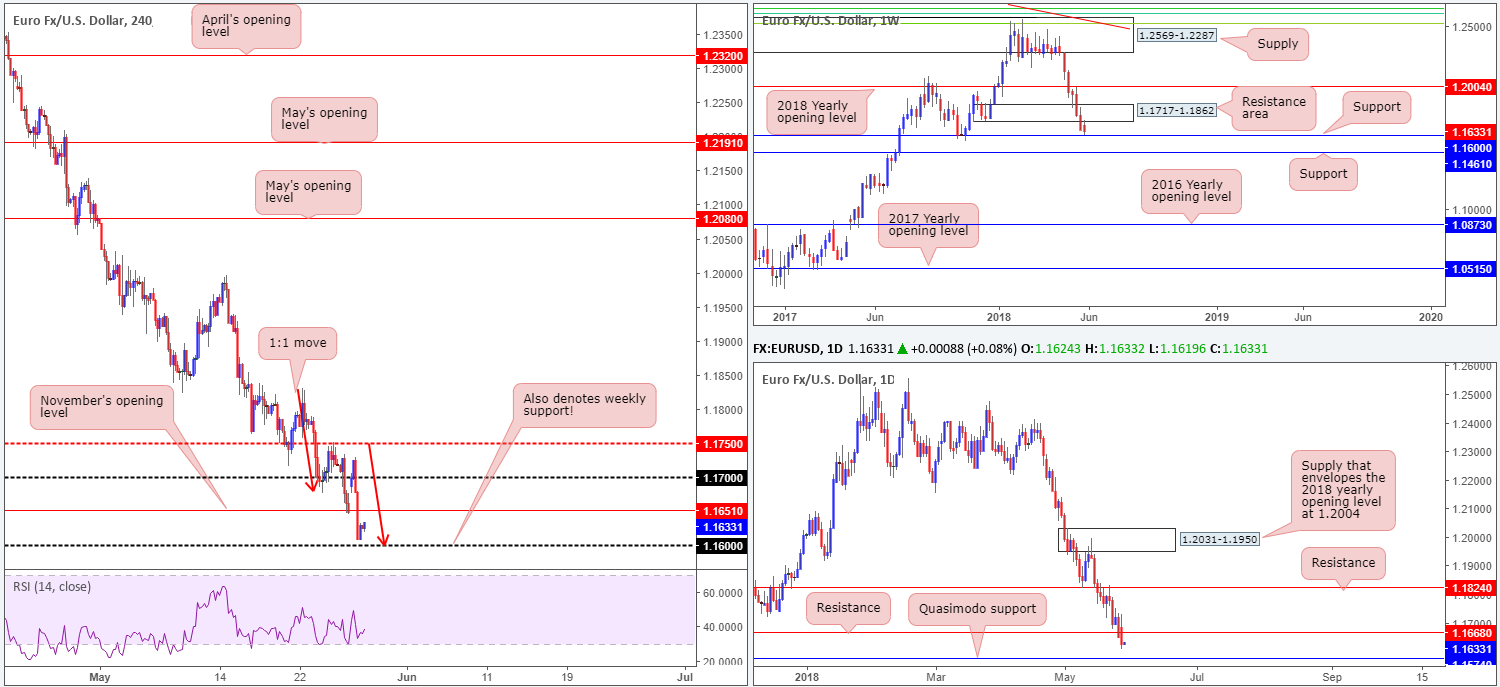
Despite a solid bounce to the upside from November’s opening level (2017) seen on the H4 timeframe at 1.1651 in early trade on Monday, upside momentum diminished above the 1.17 handle. In the absence of economic data and both US and UK banks closed, political tensions led the way in European hours.
1.17 was swiftly reclaimed, as was November’s opening level, leaving price free to conclude trading just north of the 1.16 handle, which happens to fuse beautifully with a 1:1 (H4) downside move (see red arrows) taken from the high 1.1829.
The story over on the higher timeframes is interesting! Weekly price recently eliminated weekly demand at 1.1717-1.1862 (now acting resistance area) and is now seen trading within touching distance of weekly support at 1.1600. We feel price is likely to find support from here with it having been a strong barrier of resistance in past and also serving as stiff support back in November 2017. Lower down on the curve reveals that daily price firmly closed below daily support at 1.1668 (now acting resistance) in strong fashion yesterday, potentially freeing downside to a daily Quasimodo support line at 1.1574.
Areas of consideration:
The 1.16 area is appealing. As highlighted above, not only is it a round number, it’s also a weekly support and a termination point for a H4 1:1 downside move. This, in our humble view, deserves attention as a rotation to the upside is likely from here.
While we anticipate a rebound to the upside from 1.16 that’s likely to at least reach the underside of November’s opening level, there are a few cautionary points to bear in mind:
- Round numbers are prone to fakeouts.
- A long in this market places one against overall sentiment (trend).
- Daily price suggests further selling down to 1.1574.
Therefore, do trade with caution.
Today’s data points: EUR M3 money supply y/y; US CB consumer confidence.
GBP/USD:
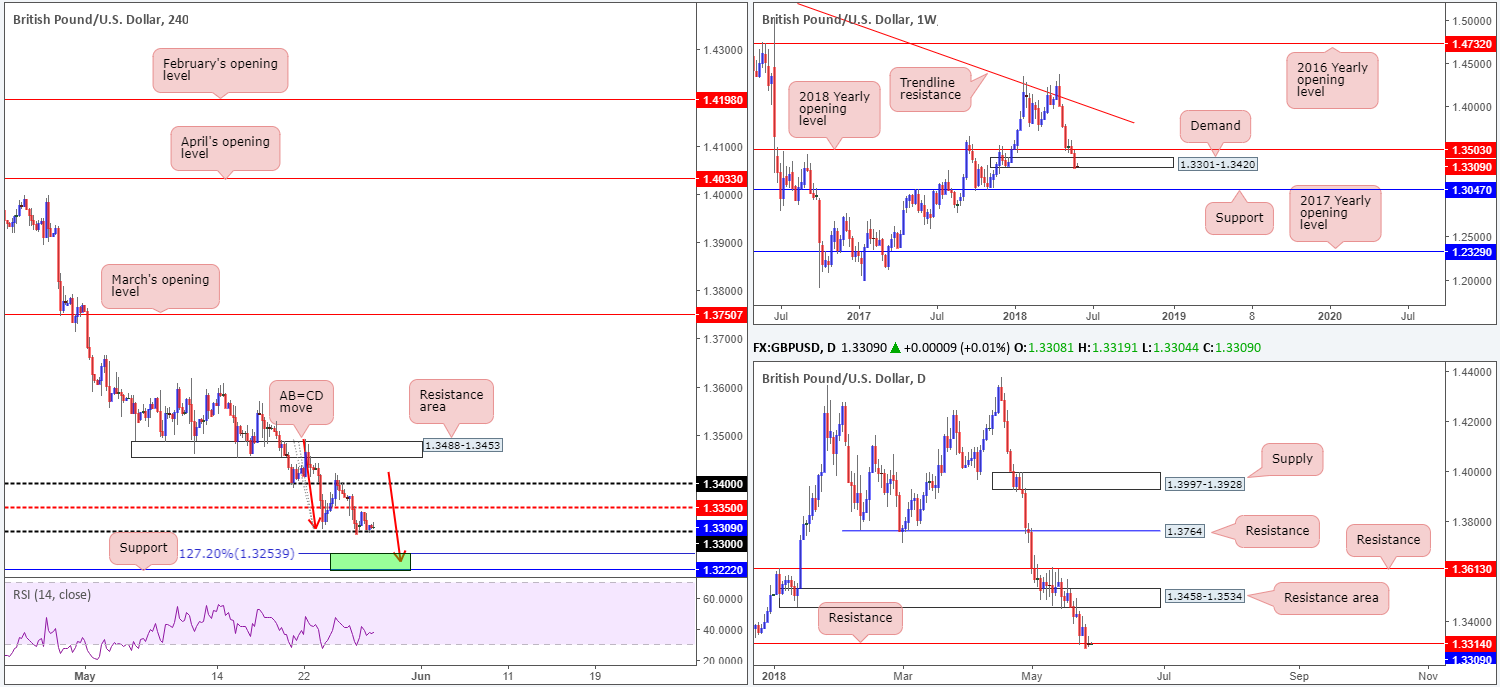
With little economic data to shout about and both US and UK banks closed, price action employed a somewhat subdued stance on Monday. Having spent the day confined within a tight range above the 1.33 handle, the team’s outlook remains unchanged.
Last week’s movement on the weekly timeframe penciled in a near-full-bodied weekly bearish candle, finishing the week closing marginally outside the walls of a nearby weekly demand at 1.3301-1.3420. The next support target on this scale can be found at 1.3047.
The story on the daily timeframe emphasizes just how severe selling pressure has been of late. Note that although we’ve dropped in excess of 1000 pips since mid-April, the unit has been unable to correct with any substance. In addition to this, the pair is seen trading marginally beneath daily support (now labelled as resistance) fixed at 1.3314. This is interesting since beneath here we do not see a whole lot of support until reaching 1.3063: a daily support that’s sited just north of the aforementioned weekly support (not seen on the screen).
Across on the H4 candles, the 1.33 handle continue to express a fragile stance. What’s also notable from a technical perspective here is below 1.33 we have clean H4 support visible at 1.3222 and a nearby H4 AB=CD (red arrows) 127.2% Fib ext. completion point at 1.3253, which forms the green zone.
Areas of consideration:
All three timeframes, at least according to our analysis, point to further depreciation. Further adding to this, we absolutely love the H4 AB=CD formation in play and believe it will eventually complete.
As such, intraday shorts beyond 1.33 are an option going forward, targeting the green H4 zone mentioned above at 1.3222/1.3253. In addition to being a take-profit zone, 1.3222/1.3253 could also be considered a buy zone. Yes, by entering long from here you’d effectively be trading into higher-timeframe flow, but a pullback up to 1.33 is certainly not out of the question, in our opinion.
Today’s data points: US CB consumer confidence.
AUD/USD:
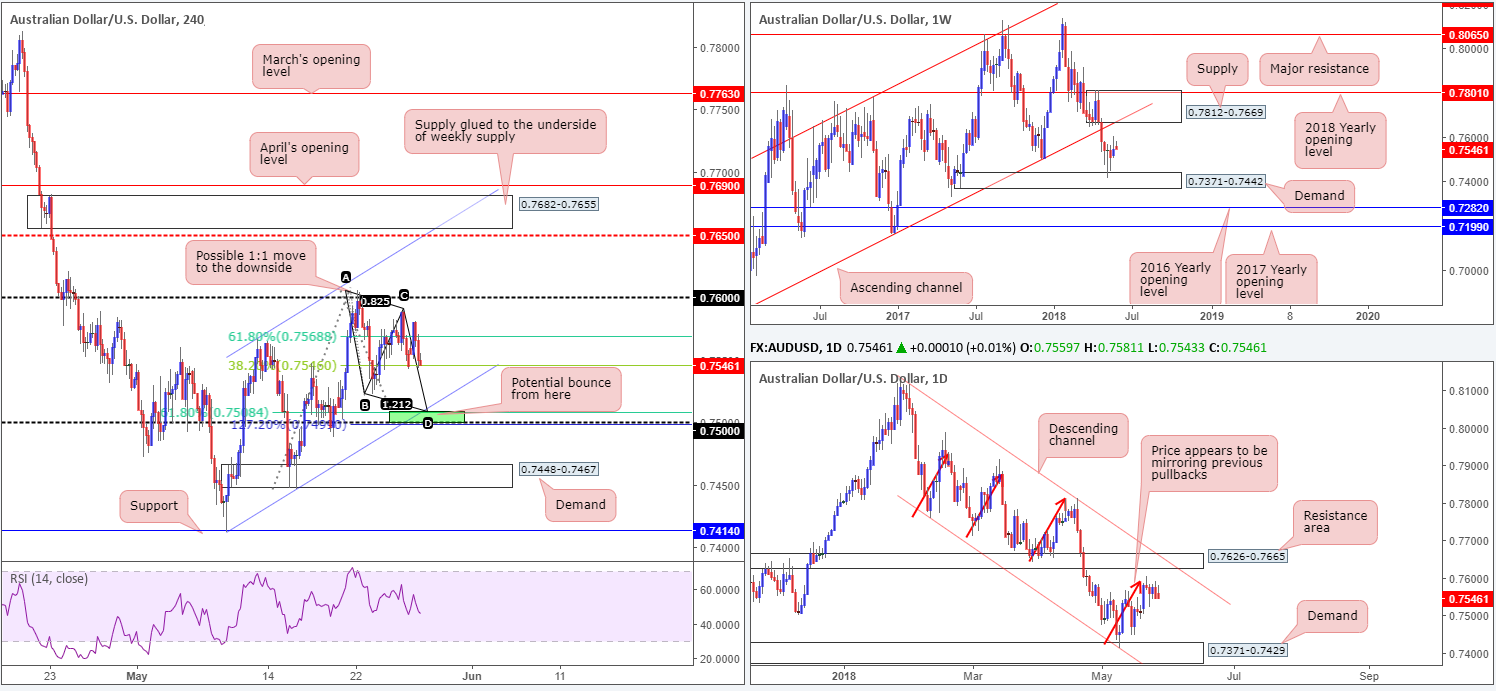
Owing to a somewhat lackluster session on Monday, technical structure remains unchanged.
H4 price, as you can see, remains under pressure, weighed down by a resumption of greenback buying. As we highlighted in Monday morning’s report, this has set the stage for a possible 1:1 move down to a H4 127.2% Fib ext. point at 0.7508, which happens to be bolstered by a H4 channel support taken from the low 0.7412 and the 0.75 handle.
Over on the bigger picture, weekly price remains bid from weekly demand at 0.7371-0.7442. Should the buyers remain in the driving seat, it’s possible the weekly supply zone at 0.7812-0.7669 and its intersecting weekly channel support-turned resistance (taken from the low 0.6827) are going to be brought into play. Drilling down to the daily timeframe, price is clearly seen compressing within a descending channel formation (0.8135/0.7758) right now. Areas also worthy of note are the daily demand base at 0.7371-0.7429 and daily resistance area plotted at 0.7626-0.7665. It may also be worth penciling in that price is finding resistance around the 0.7590 mark, mirroring previous pullbacks (see red arrows).
Areas of consideration:
Although 0.75 on the H4 timeframe has limited confluence off the higher timeframes, H4 confluence remains of interest. A H4 full or near-full-bodied bull candle printed from 0.75 would, in our technical view, be enough evidence to suggest that the buyers are interested in taking things higher.
Stop-loss orders are best placed beyond the confirming candle’s low. As for take-profit targets, the 38.2% H4 Fib resistance value taken from the 1:1 move (legs A-D) at 0.7548 can be used as a breakeven trigger, and the 61.8% H4 retracement value of legs A-D at 0.7568 for the final/partial take-profit target.
Today’s data points: US CB consumer confidence.
USD/JPY:
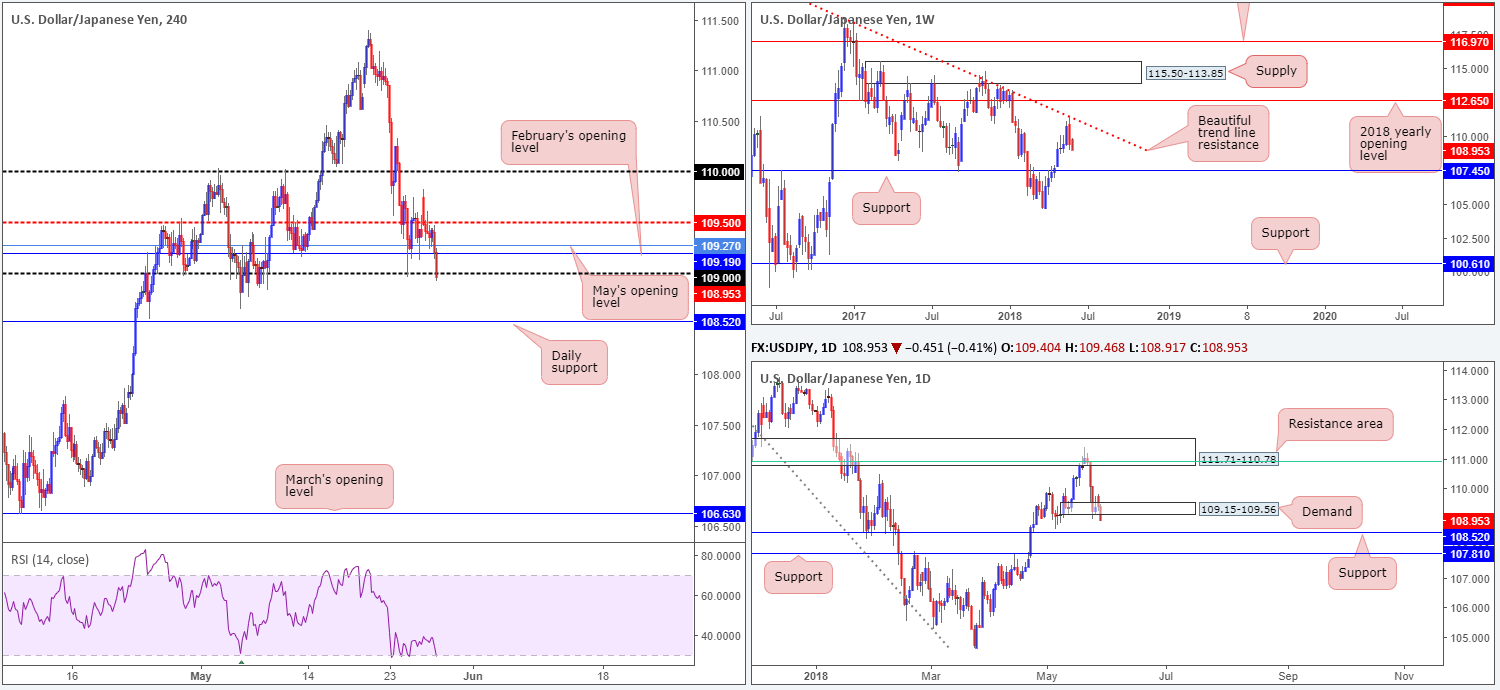
Trade was relatively thin amid yesterday’s sessions due to bank closures in the US, despite an upbeat start to the day. The pair initially advanced to highs of 109.83, but quickly pared gains and brought H4 price back beneath the mid-level support at 109.50 to nearby monthly opening levels (February and May) at 109.19/109.27, where it remained for the rest of the day.
Led by 10-year US Treasury yields, now firmly seen below the 3% neighborhood, the USD/JPY recently broke the 109 handle. What’s also apparent is the break of daily demand at 109.15-109.56. This – coupled with weekly action showing room to press as far south as weekly support coming in at 107.45 – certainly places this market in a bearish climate today.
Areas of consideration:
Should a H4 CLOSE below 109 take shape, intraday shorting opportunities on the retest of 109 are an option, targeting nearby daily support at 108.52 as the initial port of call. In order to achieve better risk/reward, drilling down to the lower timeframes may be necessary. This will likely help lock in a tighter stop.
Today’s data points: US CB consumer confidence.
USD/CAD:
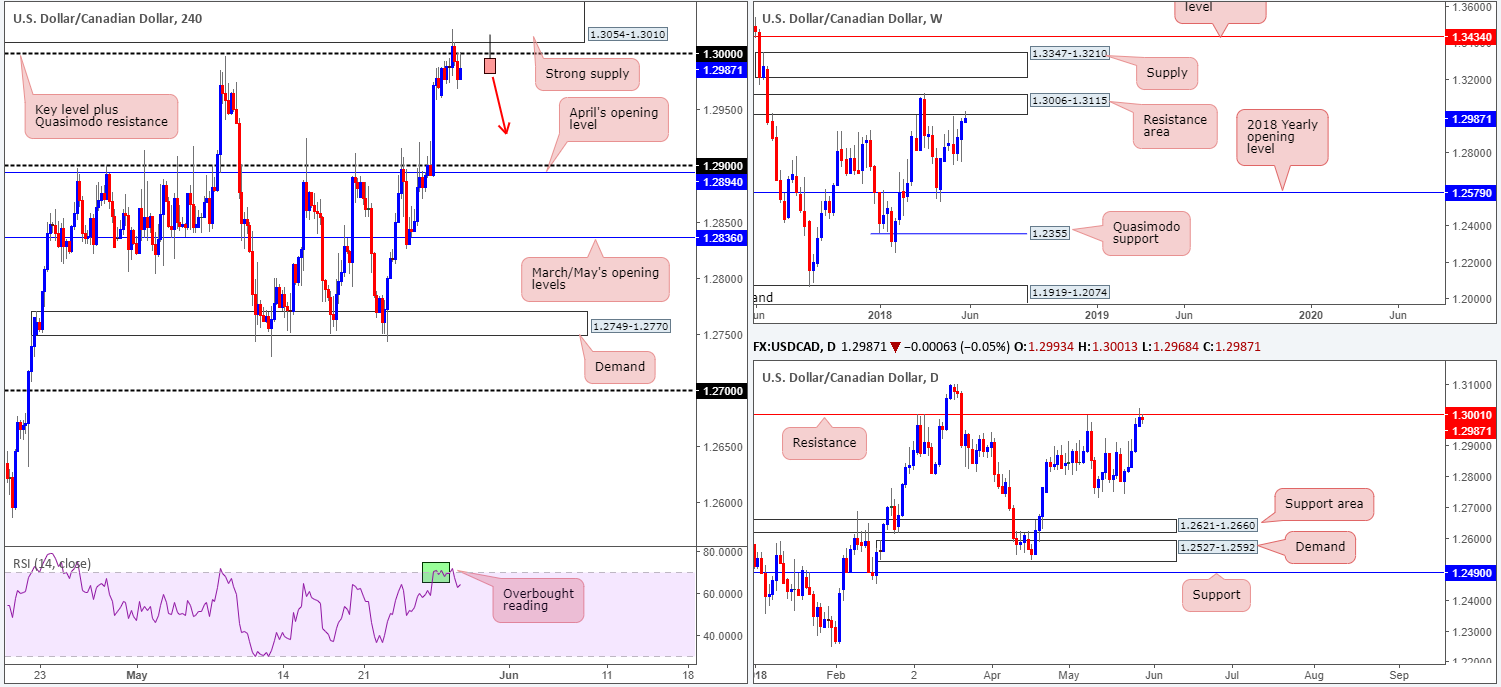
For those who read Monday’s report you may recall the team highlighting that a selloff could be imminent. We went on to say that an ideal sell signal in this market would be for H4 price to produce a bearish pin-bar formation that pierces through 1.30 and tags the nearby H4 supply (as per the chart drawing) at 1.3054-1.3010. Although we did not get a bearish pin-bar formation we did get a solid fakeout above 1.30.
Why we favor shorts here simply came down to the following:
- A fakeout of 1.30 will very likely create a pool of liquidity to sell into from the stop-loss orders planted above.
- The H4 supply noted above happens to be glued to the underside of a weekly resistance area at 1.3006-1.3115.
- 1.30 also represents a daily resistance level at 1.3001.
- H4 RSI indicator displaying an overbought reading.
Areas of consideration:
From our perspective, selling this market is high probability at the moment given the confluence in play right now. The first take-profit target, as of current price, can be seen around the 1.29 neighborhood. As for stop-loss orders, conservative traders may look to position above the current H4 supply, whereas aggressive traders might hone in on yesterday’s high point: 1.3021.
Today’s data points: US CB consumer confidence.
USD/CHF:
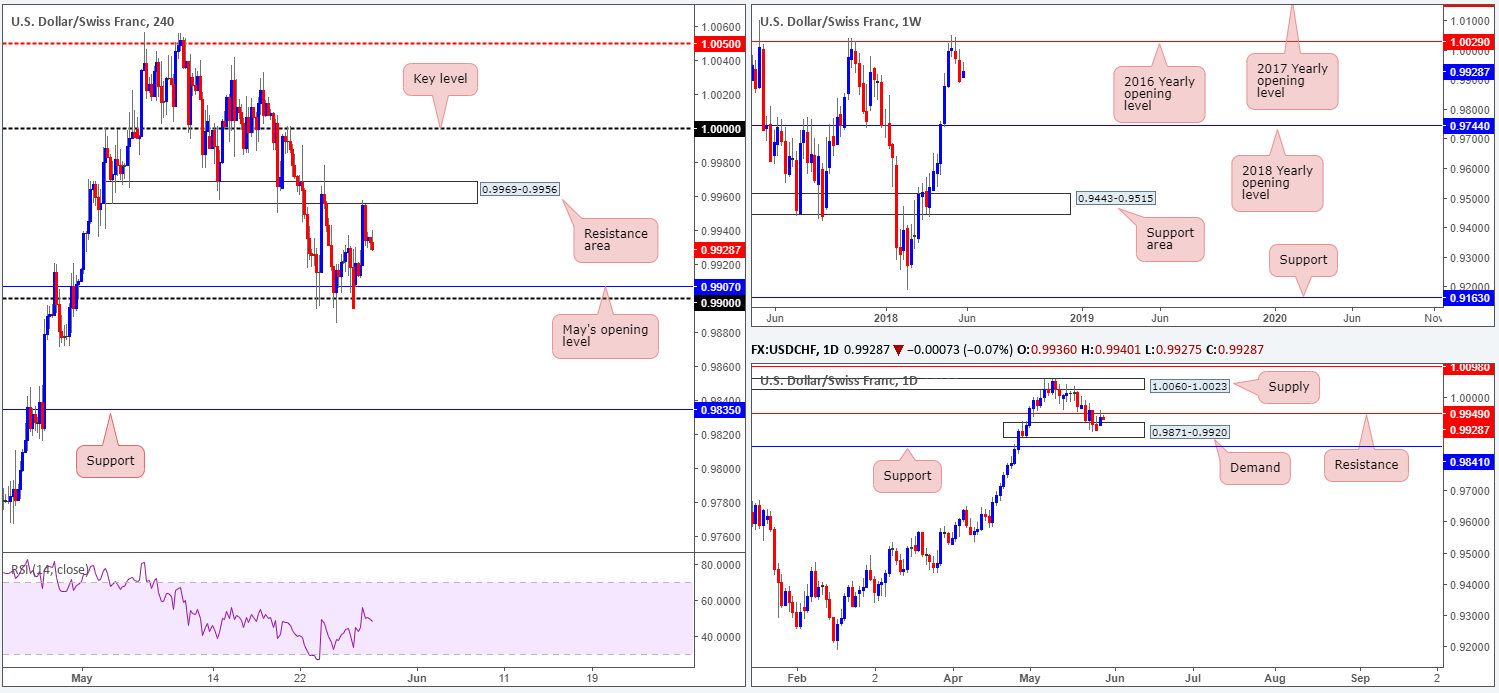
Recent activity on the USD/CHF shows the pair rotated beautifully to the upside on Monday from the 0.99 handle/May’s opening level at 0.9907 and shook hands with a H4 resistance positioned at 0.9969-0.9956. What’s also notable from a technical perspective is daily price rejected daily demand at 0.9871-0.9920 and reconnected with daily resistance printed at 0.9949.
Longer term, however, let’s remember that weekly price is currently trading within a bearish climate. After a strong push lower from the 2016 yearly opening level at 1.0029, there’s really not very much support seen in view until the unit reaches the 2018 yearly opening level marked at 0.9744.
Areas of consideration:
A close below 0.99, we feel, is a strong enough cue to begin considering shorts in this market. Yes, price will still be engaged with the nearby daily demand at 0.9871-0.9920, but overhead pressure from weekly sellers should be enough to overcome buying around this zone.
Therefore, keep eyes out for a close below/retest of 0.99 for possible shorts. The first take-profit target from this point falls in around the daily support at 0.9841, followed closely by H4 support noted at 0.9835.
Today’s data points: US CB consumer confidence.
Dow Jones Industrial Average:
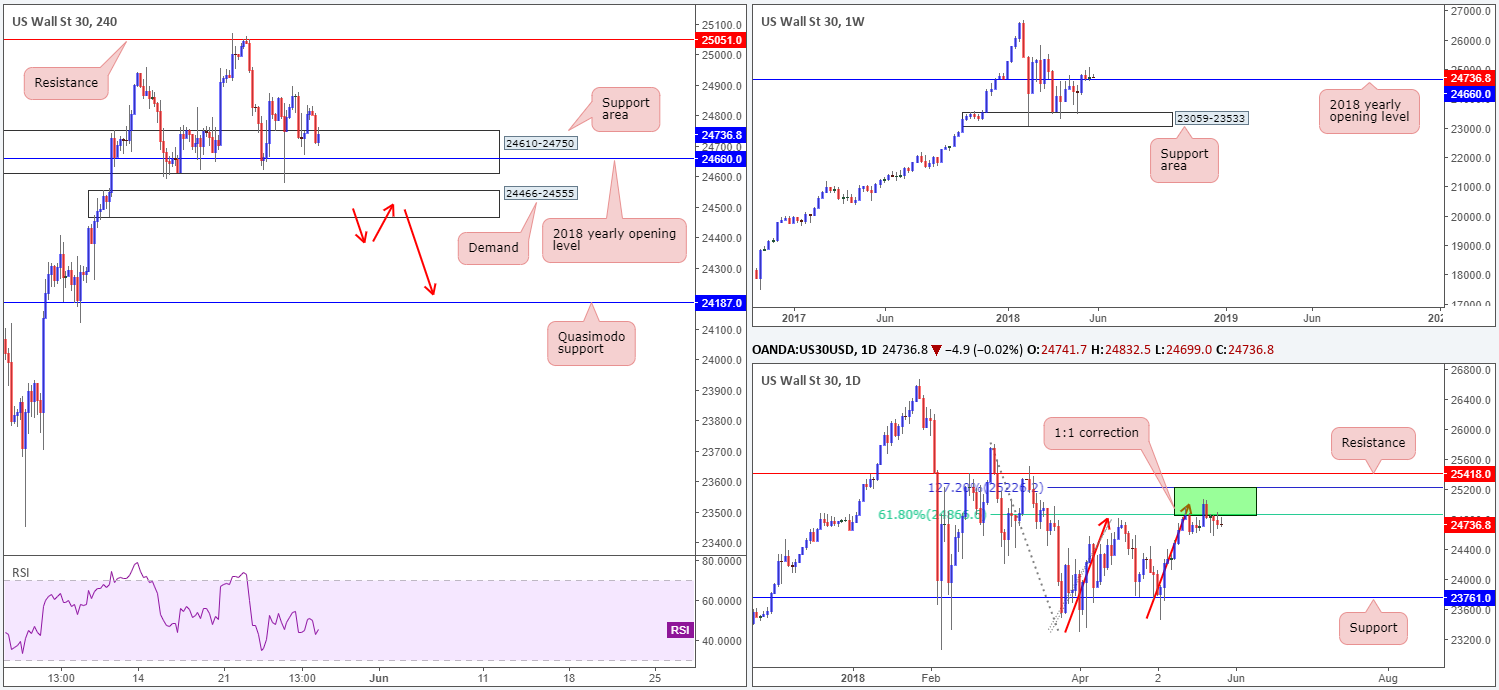
As expected, movement was somewhat limited in this market on Monday as US banks were closed in observance of Memorial Day. As a result, much of the following analysis will echo thoughts put forward in Monday morning’s briefing…
Longer term, buyers remain struggling to make headway above the 2018 yearly opening level seen on the weekly timeframe at 24660. In fact, last week’s action chalked up a reasonably clear bearish pin-bar formation! Daily sellers, on the other hand, appear to be defending 25229/24866: an area marked in green comprised of a 61.8% daily Fib resistance value and a 127.2% 1:1 correction (see red arrows) daily Fib ext. point.
Surrounding the 2018 yearly opening level mentioned above on the weekly timeframe is a H4 support area coming in at 24610-24750. Upside momentum from this zone looks somewhat weary as price has failed to print anything noteworthy over the past couple of sessions. Essentially, we see very little commitment from the bulls at this time. Traders, therefore may want to pencil in the possibility of a break lower to test a H4 demand base seen at 24466-24555.
Areas of consideration:
In essence, this market signifies a potential breakdown on the side of the bulls, despite weekly price remaining above the 2018 yearly opening band.
As a result of this, entering into long positions is not something the team would label as high probability. Shorting, on the other hand, is a possibility on the break of the noted H4 demand area. A H4 close beneath here, followed up with a retest as resistance (as per red arrows), is likely enough evidence to begin considering shorts down to (at least) the H4 Quasimodo support level marked at 24187.
Today’s data points: US CB consumer confidence.
XAU/USD (Gold)
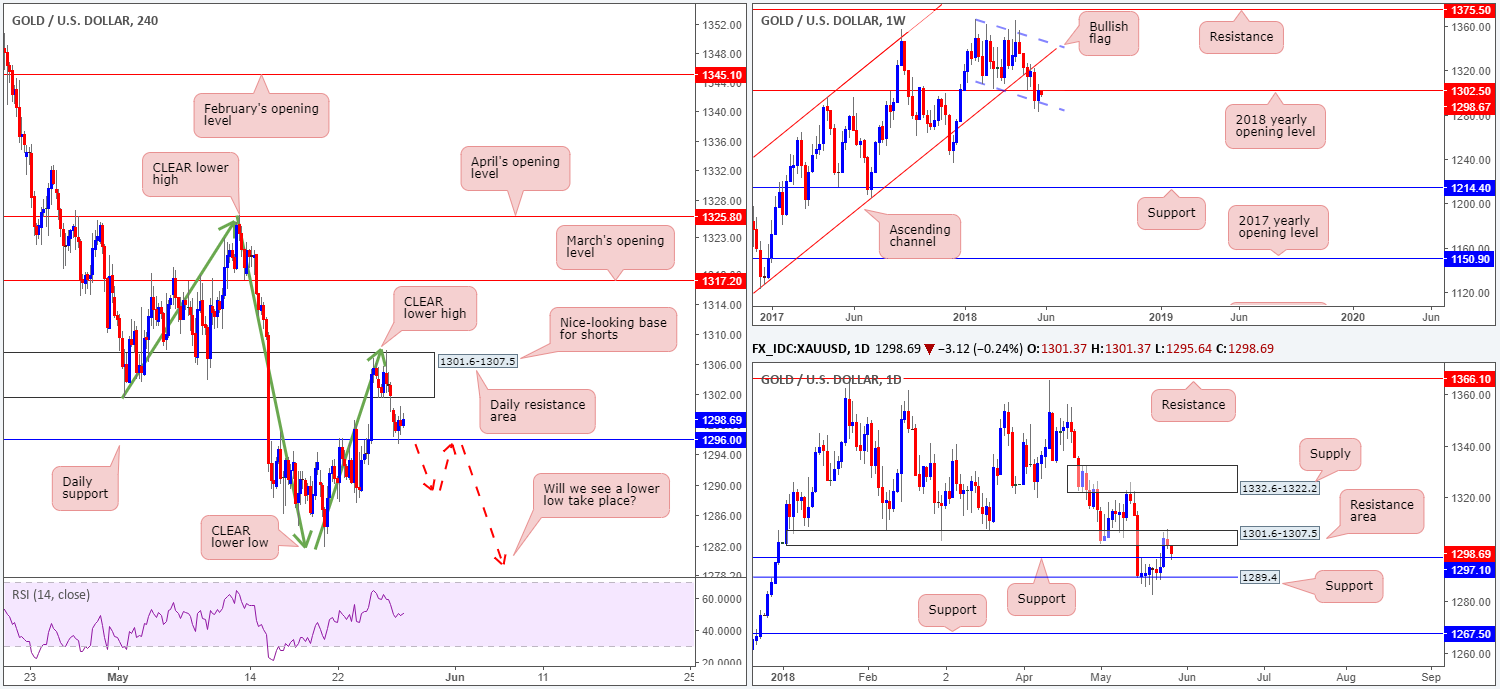
For those who read our weekly report you may recall the team highlighting a potential drop in price from the daily resistance area placed at 1301.6-1307.5. As you can see, this occurred in early trade, resulting in bullion challenging nearby daily support plotted at 1296.0. Our confidence in this area came from knowing that the 2018 yearly opening level sited on the weekly timeframe at 1302.5 resides within its walls.
So, the question going forward is will we see a continuation to the downside, knowing that we’re testing daily support? From a technical standpoint, we think so. Not only is the USD heavily bid right now, let’s also keep in mind the yellow metal is coming off WEEKLY resistance (2018 level)!
Areas of consideration:
Those who remain short this market from the current daily resistance area, risk should’ve already been reduced to breakeven, with the next expectation focused on a break of the current daily support line.
Overall, we’re eventually expecting a lower low to form on the H4 scale (a break of the swing low 1285.8), so for folks that missed the initial short, waiting and seeing if H4 price can close below the noted daily support and chalk up a retest as resistance (see red arrows) would, in our view, be considered a high-probability shorting opportunity.
The use of the site is agreement that the site is for informational and educational purposes only and does not constitute advice in any form in the furtherance of any trade or trading decisions.
The accuracy, completeness and timeliness of the information contained on this site cannot be guaranteed. IC Markets does not warranty, guarantee or make any representations, or assume any liability with regard to financial results based on the use of the information in the site.
News, views, opinions, recommendations and other information obtained from sources outside of www.icmarkets.com.au, used in this site are believed to be reliable, but we cannot guarantee their accuracy or completeness. All such information is subject to change at any time without notice. IC Markets assumes no responsibility for the content of any linked site. The fact that such links may exist does not indicate approval or endorsement of any material contained on any linked site.
IC Markets is not liable for any harm caused by the transmission, through accessing the services or information on this site, of a computer virus, or other computer code or programming device that might be used to access, delete, damage, disable, disrupt or otherwise impede in any manner, the operation of the site or of any user’s software, hardware, data or property.


