
Waiting for lower timeframe confirmation is our main tool to confirm strength within higher timeframe zones, and has really been the key to our trading success. It takes a little time to understand the subtle nuances, however, as each trade is never the same, but once you master the rhythm so to speak, you will be saved from countless unnecessary losing trades. The following is a list of what we look for:
- A break/retest of supply or demand dependent on which way you’re trading.
- A trendline break/retest.
- Buying/selling tails/wicks – essentially we look for a cluster of very obvious spikes off of lower timeframe support and resistance levels within the higher timeframe zone.
We typically search for lower-timeframe confirmation between the M15 and H1 timeframes, since most of our higher-timeframe areas begin with the H4. Stops are usually placed 1-3 pips beyond confirming structures.
EUR/USD:
After reaching a high of 1.1961 in the early hours of Monday’s US segment, the single currency came under fresh pressure. The move quickly intensified following the release of hotter-than-expected US new home sales data, consequently breaking below September’s opening line seen on the H4 timeframe at 1.1913 and shaking hands with the 1.19 handle.
Stop-loss orders beneath 1.19 have likely been triggered, as have any breakout sellers’ orders. Intraday sellers are now likely targeting nearby H4 support at 1.1861/H4 demand at 1.1836-1.1854, both equally weighted, in our opinion. Unbeknownst to these traders though is that there is a daily support level sitting nearby at 1.1878, which also represents the top edge of a recently broken weekly supply zone-turned support area at 1.1880.
Suggestions: Owing to the noted higher-timeframe supports, a sell sub 1.19 is a low-probability trade, as far as we can see. Buying the market on the hand could be a possibility following a H4 bullish close above 1.1913. From here, we believe upside would be reasonably free until the large psychological band 1.20, which, if you remember from Monday’s report, forms the underside of a rather substantial sell zone:
The trading area that offers the most quality right now is a sell zone fixed between the 1.20 line on the H4 timeframe and the weekly resistance level/AB=CD completion point at 1.2053. A full or near-full-bodied H4 bearish candle printed within this area would, in our view, be a mouthwatering setup, and one that we would have little hesitation getting involved in.
Data points to consider: EUR M3 Money supply y/y at 09.00am; FOMC member Dudley speaks at 2.15pm; US CB consumer confidence and Fed Chair designate Powell speaks at 3pm; Treasury Sec Mnuchin speaks at 8.45pm GMT.

Levels to watch/live orders:
- Buys: Watch for H4 price to engulf 1.1913 and then look to trade any retest seen thereafter ([waiting for a reasonably sized H4 bullish candle to form following the retest – preferably a full or near-full-bodied candle – is advised] stop loss: ideally beyond the candle’s tail).
- Sells: 1.2053/1.20 ([waiting for a reasonably sized H4 bearish candle to form – preferably a full or near-full-bodied candle – is advised] stop loss: ideally beyond the candle’s wick).
GBP/USD:
Trading almost identically to the EUR/USD, the GBP/USD topped at a high of 1.3383 in early US hours on Monday and fell sharply. Exacerbated by the release of upbeat US new home sales data, the unit concluded the day closing below H4 support at 1.3324, which, as you can see, is currently being retested as resistance. Supporting the recent move lower was daily resistance seen at 1.3371 and October’s opening level seen on the H4 timeframe at 1.3367.
Seeing as how the British pound is currently trading slightly above weekly resistance at 1.3301, the 1.33 handle on the H4 timeframe, alongside November’s opening level at 1.3290, could offer support today. Even if H4 price manages to close beneath 1.3290, sellers will still likely struggle as the unit almost immediately has to contend with a broken daily Quasimodo line at 1.3279! For that reason, selling this market is out of the question for us at this time.
Unfortunately, buying is much the same story. Entering long into the current H4 resistance, and knowing that daily resistance is less than 50 pips away, would be a difficult trade unless one is able to drill down to the lower timeframes and find something that requires a small stop-loss order above 1.3324.
Suggestions: On account of the above findings, we’ll be remaining on the sidelines for the time being.
Data points to consider: UK bank stress test results and BoE financial stability report at 07.00am; BoE Gov. Carney speaks at 07.30am; FOMC member Dudley speaks at 2.15pm; US CB consumer confidence and Fed Chair designate Powell speaks at 3pm; Treasury Sec Mnuchin speaks at 8.45pm GMT.

Levels to watch/live orders:
- Buys: Flat (stop loss: N/A).
- Sells: Flat (stop loss: N/A).
AUD/USD:
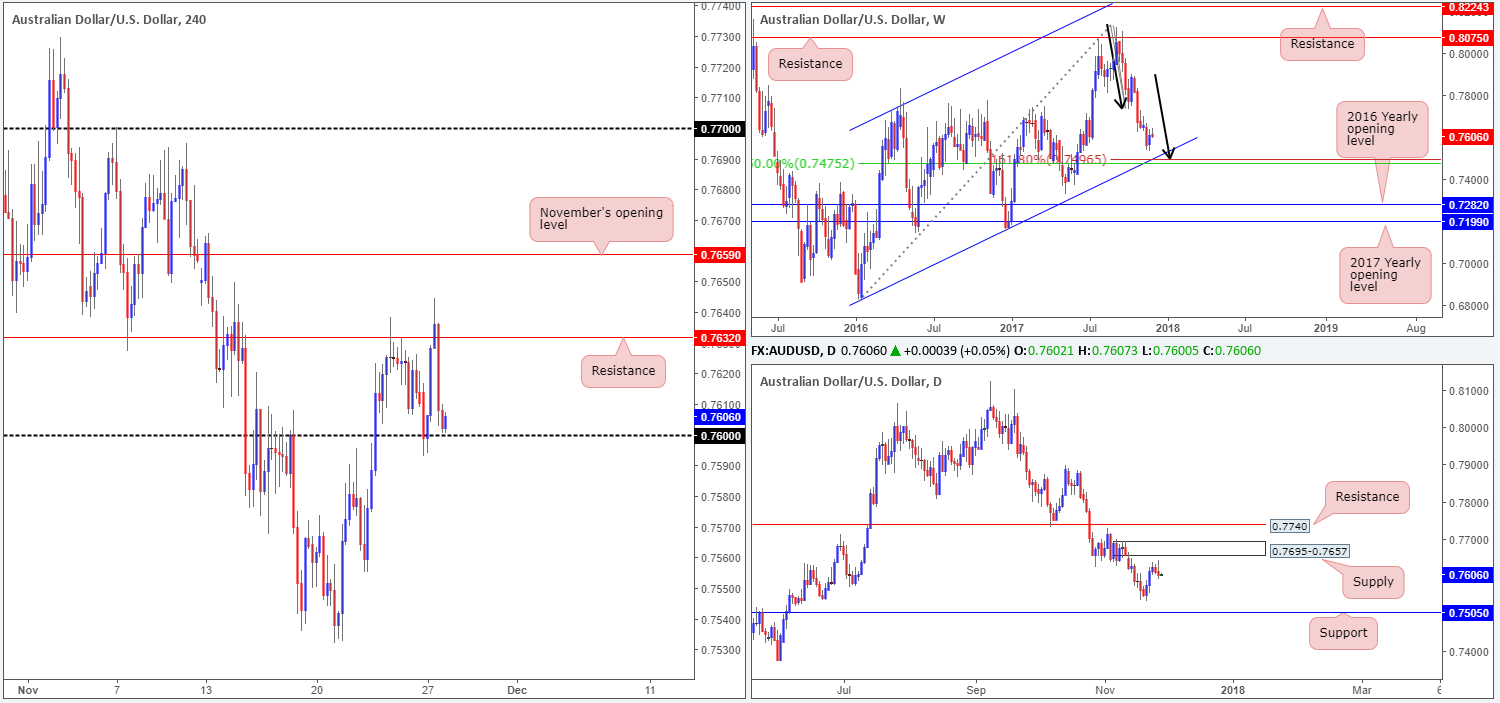
The AUD/USD is effectively unchanged this morning, marginally down 0.08% on Monday. Despite this, H4 price ranged over 50 pips, whipsawing through H4 resistance at 0.7632, before ending the day closing just ahead of the 0.76 handle.
Although the commodity currency recouped some of its recent losses last week, weekly structure, in our view, remains unchanged from the previous weekly outlook. To the downside there is a particularly interesting weekly support we have our eye on. Merging with a weekly channel support extended from the low 0.6827, there’s a nice-looking weekly AB=CD (see black arrows) 161.8% Fib ext. point at 0.7496 that also aligns with a weekly 50.0% value at 0.7475 taken from the high 0.8125.
The story on the daily timeframe, nevertheless, shows that there is room for price to advance up to a nearby daily supply area coming in at 0.7695-0.7657. Looking to the downside, we do not see much stopping price from challenging last Tuesday’s low at 0.7532, followed closely by daily support penciled in at 0.7505.
Suggestions: Although the higher timeframes shows space to move to the downside (see above), H4 sellers will need to prove themselves further before we consider a short in this market. A decisive H4 close below 0.76, followed up with a retest and a reasonably sized H4 full or near-full-bodied bearish candle would, in our book, be enough to warrant a sell, with an ultimate target set at 0.75 (a strong buy zone).
Data points to consider: FOMC member Dudley speaks at 2.15pm; US CB consumer confidence and Fed Chair designate Powell speaks at 3pm; Treasury Sec Mnuchin speaks at 8.45pm GMT.
Levels to watch/live orders:
- Buys: Flat (stop loss: N/A).
- Sells: Watch for H4 price to engulf 0.76 and then look to trade any retest seen thereafter ([waiting for a reasonably sized H4 bearish candle to form following the retest – preferably a full or near-full-bodied candle – is advised] stop loss: ideally beyond the candle’s wick).
USD/JPY:
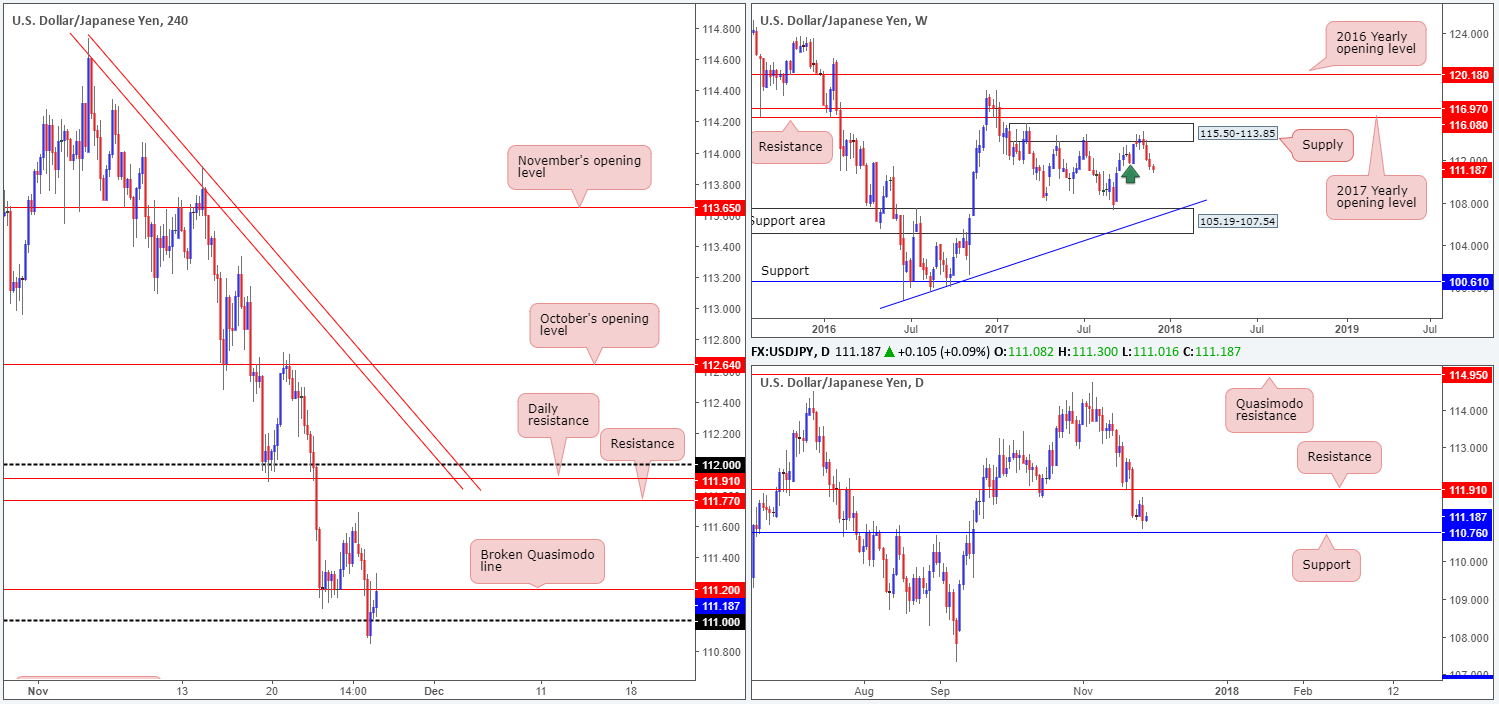
Looking at this market from the top this morning, the weekly timeframe shows that price extended losses last week, reaching lows of 111.06. With 111.68 (the low marked with a green arrow) now potentially out of the picture, there is, according to weekly structure, room for weekly price to trade as far south as the weekly support area at 105.19-107.54, which aligns with a weekly trendline support taken from the low 98.78.
A closer look at price action on the daily timeframe reveals that amid Monday’s segment daily price chalked up a nice-looking bearish engulfing candle. This, alongside the points made on the weekly timeframe, the nearby daily support level at 110.76 could be taken out today/sometime this week.
Yesterday’s selling, as you can see on the H4 timeframe, cracked through the H4 Quasimodo at 111.20 and whipsawed through the 111 handle. As we write, price is seen retesting the underside of 111.20.
Suggestions: Although stop-loss orders have likely been triggered beneath the 111 level, thus potentially weakening the area, selling from the 111.20 barrier is still a risky play we feel. Choosing to wait for a more decisive move below 111, however, will almost immediately position one within striking distance of the aforementioned daily support. As such, current trading conditions are tricky for the sellers, despite the position of price on the weekly timeframe.
A buy would be just as challenging, in our opinion. Even if you waited for the daily support to enter the equation, you’d still be going up against potential weekly selling.
Data points to consider: FOMC member Dudley speaks at 2.15pm; US CB consumer confidence and Fed Chair designate Powell speaks at 3pm; Treasury Sec Mnuchin speaks at 8.45pm GMT.
Levels to watch/live orders:
- Buys: Flat (stop loss: N/A).
- Sells: Flat (stop loss: N/A).
USD/CAD:
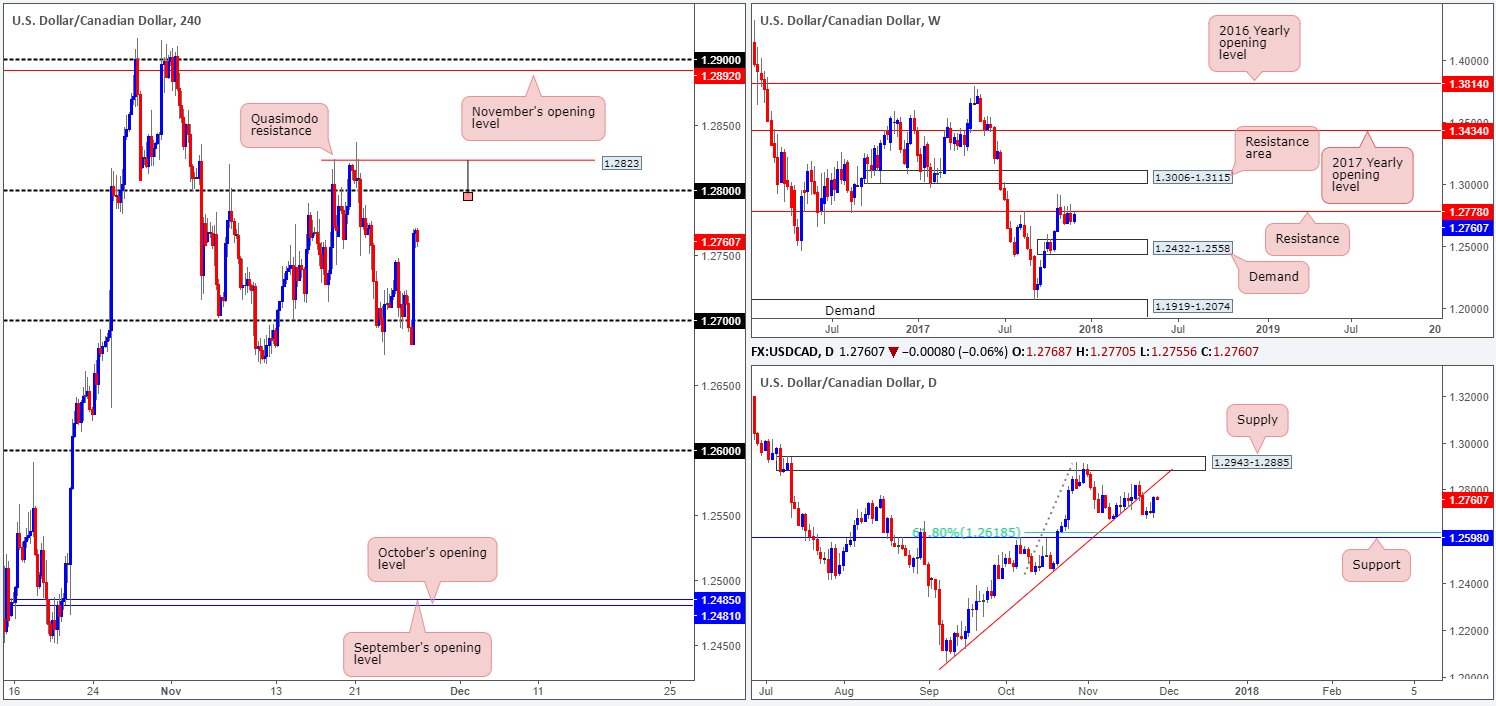
After briefly pushing below the 1.27 handle during Monday’s sessions, the value of the dollar strengthened against its Canadian counterpart, reaching highs of 1.2770 on the day. The slide in crude oil prices was a factor behind the Canadian dollar’s weakness, which is currently trading at 57.83/barrel. Should the bulls maintain this pressure today, the next upside target on the H4 scale is likely going to be the 1.28 handle, followed closely by a H4 Quasimodo resistance pegged at 1.2823. However, before these levels can be achieved, traders may want to note that there is also a weekly resistance plotted nearby at 1.2778.
Suggestions: A sell at the noted H4 Quasimodo resistance level is of interest to our team for two reasons. The first reason should be obvious: how close the level is positioned to the noted weekly resistance barrier. The second reason is due to the stop-loss orders likely planted above 1.28. A lot of traders will be looking to sell 1.28 and will have stops located 10-20 pips above. 1.2823, therefore, is an ideal place for traders to be selling! Remember, sellers’ stop-loss orders become buy orders once filled, consequently providing liquidity for sellers with big pockets!
An ideal scenario would be for H4 price to chalk up a bearish selling wick (as drawn on the chart) that pierces through 1.28 and taps orders around 1.2833. A sell on the close of this candle is a high-probability trade, in our book.
Data points to consider: FOMC member Dudley speaks at 2.15pm; US CB consumer confidence and Fed Chair designate Powell speaks at 3pm; Treasury Sec Mnuchin speaks at 8.45pm; CAD RMPI m/m at 1.30pm; BoC Gov. Poloz speaks at 4.30pm GMT.
Levels to watch/live orders:
- Buys: Flat (stop loss: N/A).
- Sells: Watch for H4 price to whipsaw through 1.28 and tap 1.2833 ([waiting for a reasonably sized H4 bearish selling wick to form is advised] stop loss: ideally beyond the candle’s wick).
USD/CHF:
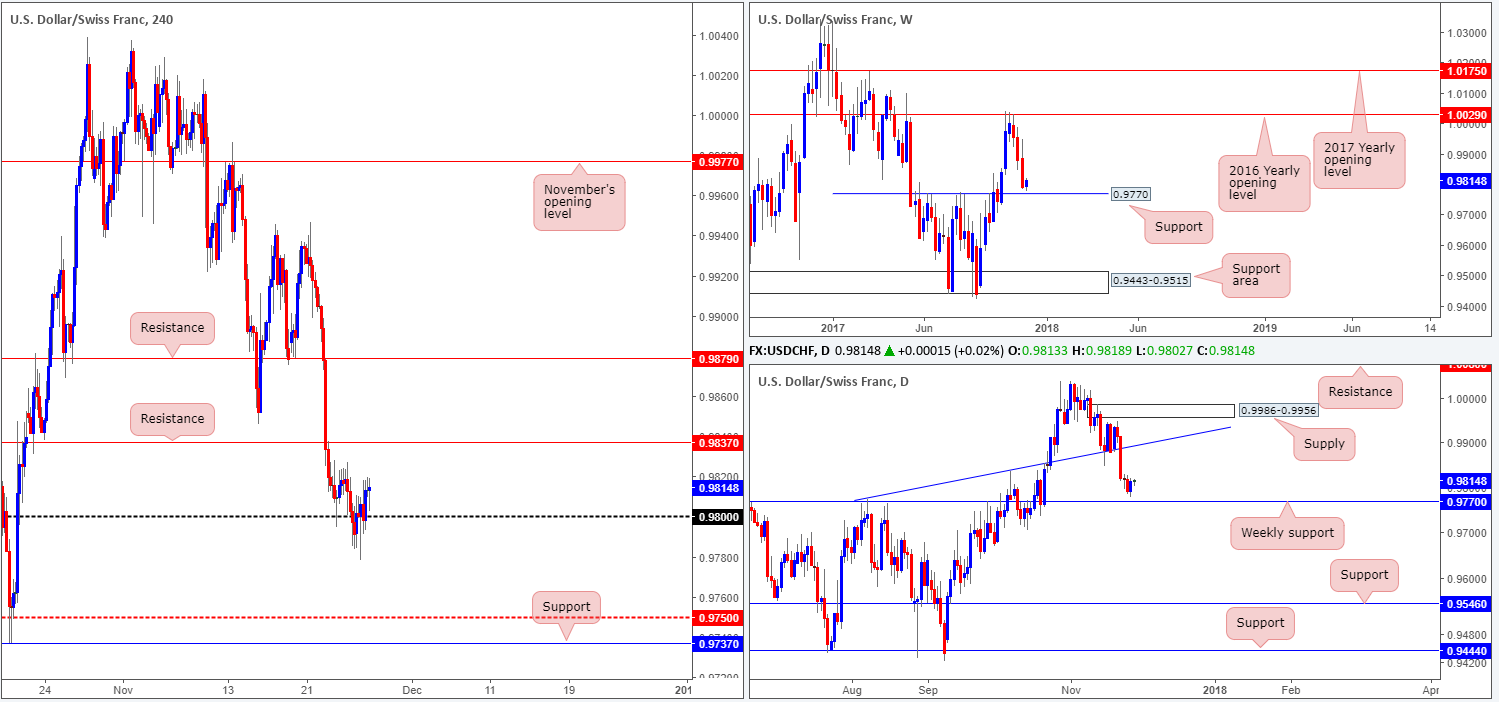
As can be seen from the H4 timeframe this morning, the H4 candles failed to sustain losses sub 0.98 on Monday. Bolstered by dollar strength across the board, the Swissie was able to end the day marginally in the green, up 0.06%. Before further buying can be seen, nevertheless, there’s some wood to chop through around the 0.9826/0.9820 area, and then H4 price will have to contend with resistance plotted at 0.9837.
Over on the bigger picture, we can see that yesterday’s movement came within 8 pips of weekly support at 0.9770, before advancing higher. This may be enough to elevate price into the week’s close. However, we won’t be looking to become buyers until we see a decisive H4 close print above 0.9837, as this will, in our view, show buyer intent.
Suggestions: Keeping it Simple Simon, wait for a H4 close to form above the current H4 resistance at 0.9837.This, followed up with a retest and a H4 full or near-full-bodied bull candle would, in our book, be enough to validate a long position, targeting H4 resistance at 0.9879 as your initial take-profit zone.
Data points to consider: FOMC member Dudley speaks at 2.15pm; US CB consumer confidence and Fed Chair designate Powell speaks at 3pm; Treasury Sec Mnuchin speaks at 8.45pm GMT.
Levels to watch/live orders:
- Buys: Watch for H4 price to engulf 0.9837 and then look to trade any retest seen thereafter ([waiting for a reasonably sized H4 bullish candle to form following the retest – preferably a full or near-full-bodied candle – is advised] stop loss: ideally beyond the candle’s tail).
- Sells: Flat (stop loss: N/A).
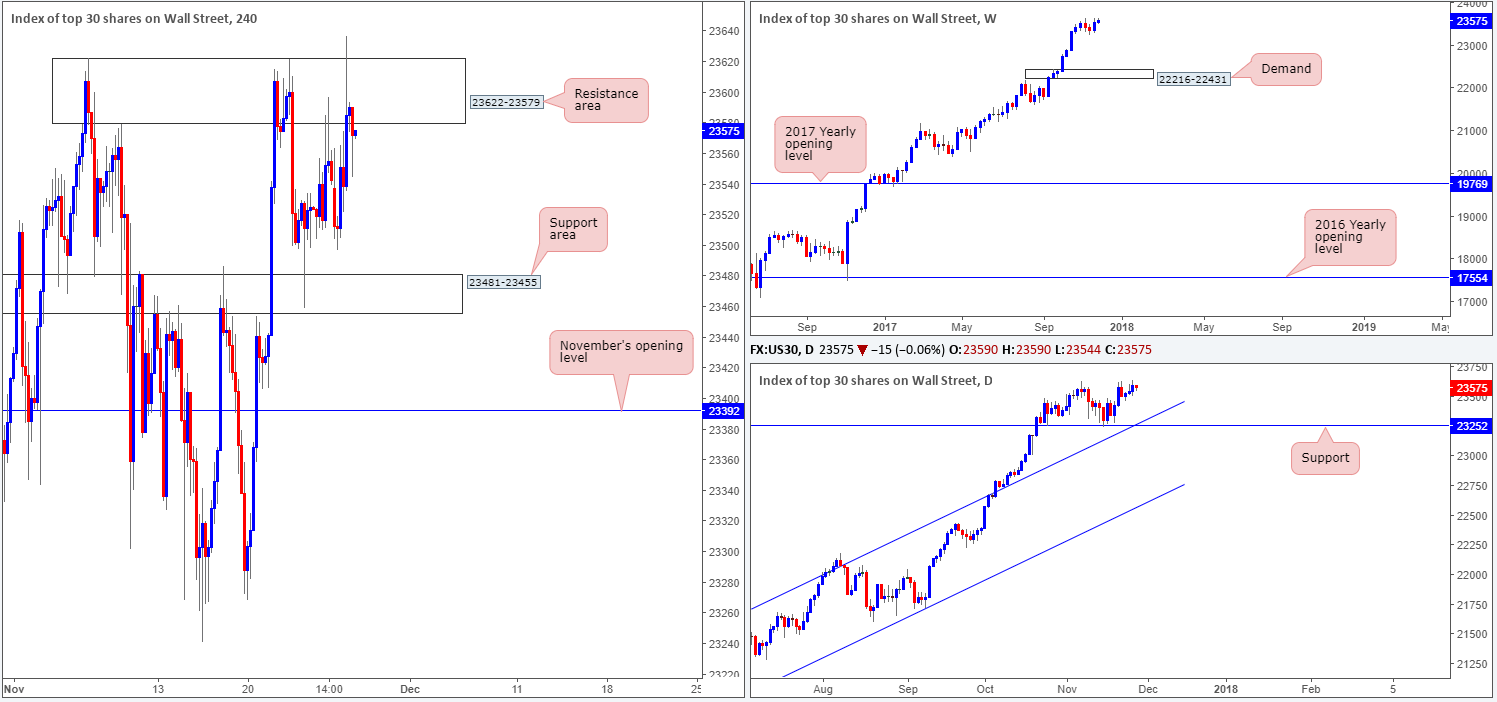
DOW 30:
During the course of yesterday’s sessions, the DJIA struck a fresh record high of 23637 but failed to print much of a follow-through. This, according to H4 structure, was due to the resistance area plotted at 23622-23579. Having said this though, sellers were likely stopped out here and breakout buyers are likely feeling the pain right now (closing their positions). This, in our view, opens up the path north to further buying today.
Suggestions: We feel the safest approach to trading this market is to simply wait. Wait for H4 price to engulf (close above) the noted H4 resistance area. That way, one would be in a position to potentially take advantage of any retest seen at the top edge of the broken area as support. Considering the strength of the underlying trend, we believe this would be a tasty location to look for long opportunities.
Data points to consider: FOMC member Dudley speaks at 2.15pm; US CB consumer confidence and Fed Chair designate Powell speaks at 3pm; Treasury Sec Mnuchin speaks at 8.45pm GMT.
Levels to watch/live orders:
- Buys: Watch for H4 price to engulf 23622-23579 and then look to trade any retest seen thereafter ([waiting for a reasonably sized H4 bullish candle to form following the retest – preferably a full or near-full-bodied candle – is advised] stop loss: ideally beyond the candle’s tail).
- Sells: Flat (stop loss: N/A).
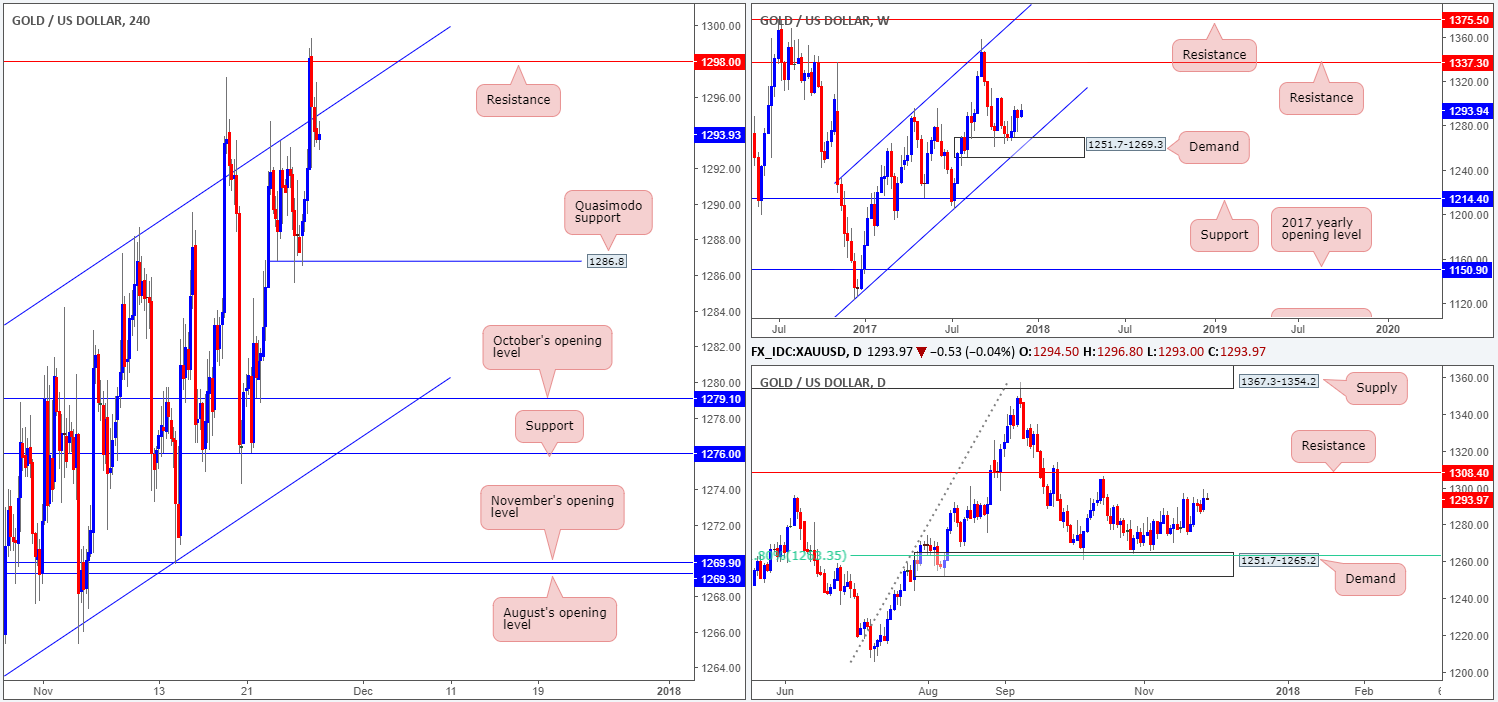
GOLD:
The yellow metal ran into a strong ceiling of offers around H4 resistance at 1298.0 on Monday, after breaking above the H4 channel resistance extended from the high 1282.5. Despite the H4 candles managing to break back below the H4 channel resistance, upside momentum remains favored. We say this because of where gold is trading from on the bigger picture:
- Weekly demand at 1251.7-1269.3.
- Daily demand at 1251.7-1265.2 (housed within the lower limits of a weekly demand base).
Until the current H4 resistance is taken out, however, we would be wary of buying this market. Likewise, selling, knowing that you’re potentially selling into higher-timeframe flow is equally as risky, in our opinion.
Suggestions: Opting to stand on the sidelines is, in our opinion, still the much safer path to take at this time.
Levels to watch/live orders:
- Buys: Flat (stop loss: N/A).
- Sells: Flat (stop loss: N/A).


