
EUR/USD:
The euro was among the top performers on Monday.
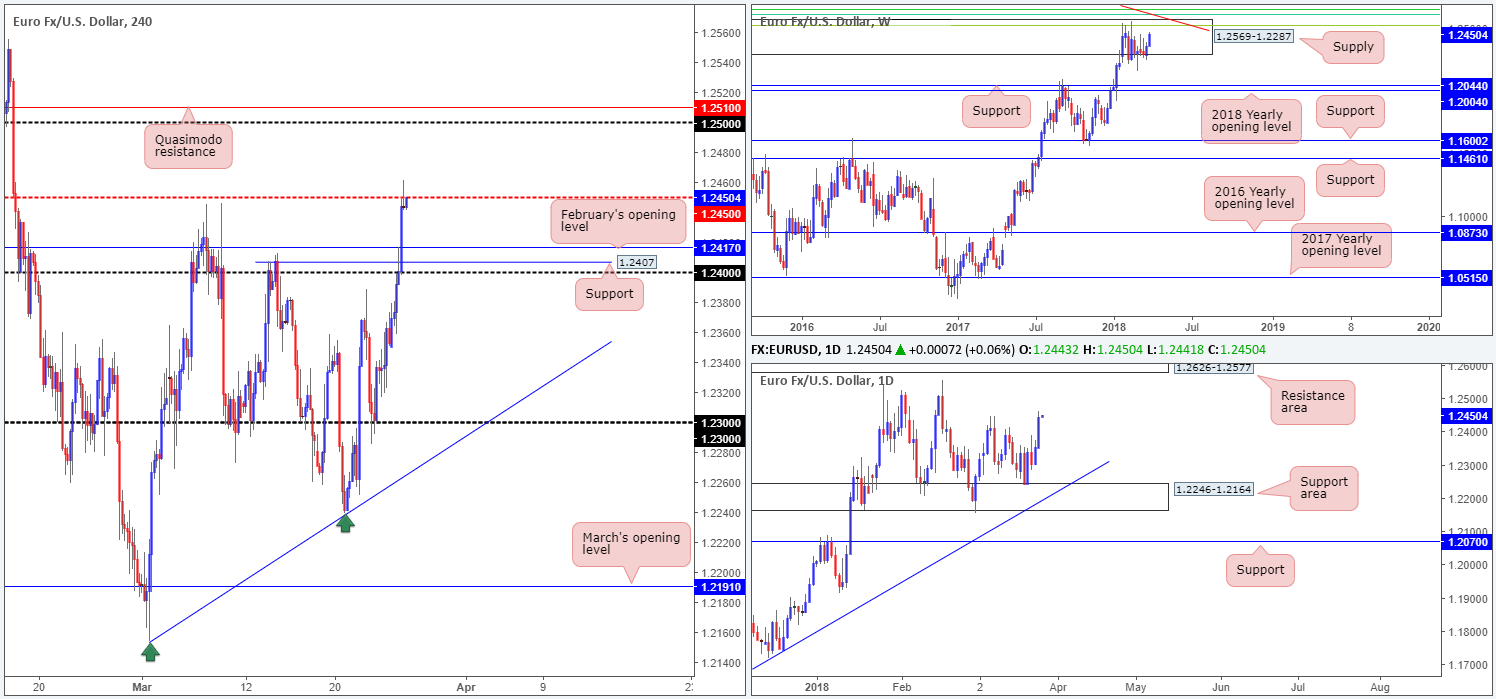
With the DXY continuing to retreat and comments from ECB official Jens Weidmann regarding the possibility of a rate hike next year, the EUR/USD cut through multiple H4 tech resistances and ended the day testing a H4 mid-level resistance coming in at 1.2450.
This latest move, as you can see, has also pushed weekly action higher into the walls of a major-league weekly supply zone at 1.2569-1.2287.Seen circling around the top edge of this zone is a weekly Fibonacci resistance cluster (see below for the values) and long-term weekly trendline resistance (extended from the high 1.6038).
- 61.8% Fib resistance at 1.2604 taken from the high 1.3993.
- 50.0% Fib resistance at 1.2644 taken from the high 1.4940.
- 38.2% Fib resistance at 1.2519 taken from the high 1.6038.
Looking down to the daily timeframe, however, we can see that the unit’s next upside target can be seen in the form of a daily resistance area drawn from 1.2626-1.2577 (seen positioned directly above the weekly supply zone noted above).
Potential trading zones:
Should 1.2450 give way, we could be looking at a move being seen up to the 1.25 handle, followed closely by a H4 Quasimodo resistance level at 1.2510. Seeing as how these levels are positioned within the upper limits of the aforementioned weekly supply and also nearby the 38.2% weekly Fib resistance at 1.2519, active sellers may make an appearance here.
Data points to consider today: Spanish flash CPI y/y; EUR M3 money supply y/y; US CB consumer confidence; FOMC Bostic speech.
Areas worthy of attention:
Supports: 1.24; 1.2407; 1.2417.
Resistances: 1.2569-1.2287; weekly Fib resistance cluster; 1.2450; 1.25; 1.2510; 1.2626-1.2577.
GBP/USD:
In recent news, UK PM May said dedicated talks have begun on the Northern Irish border with Ireland and the EU commission. With optimism of a soft-Brexit and the USD remaining on the back foot, the British pound managed to extend Friday’s gains in strong fashion on Monday.
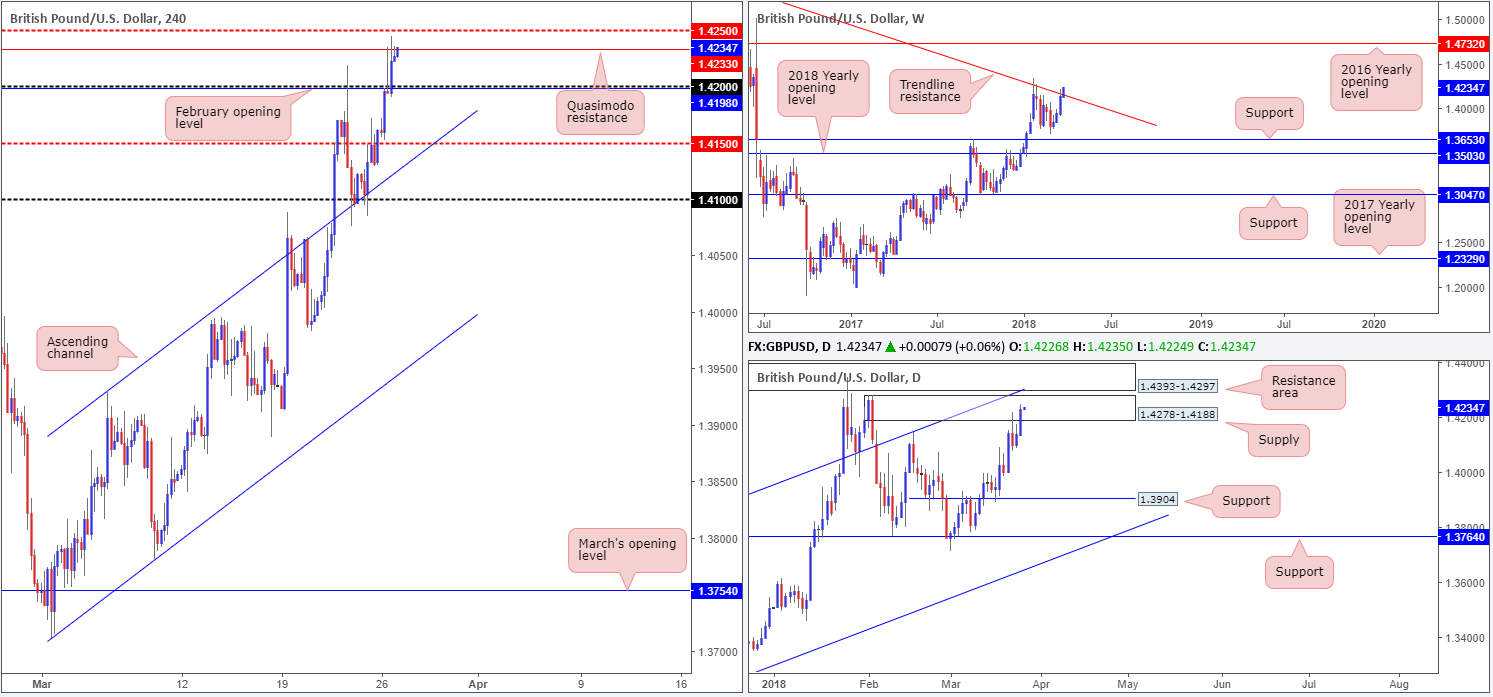
Weekly price is currently crossing above a long-term weekly trendline resistance (taken from the high 1.5930). Continued buying from this point would likely bring the pair into contact with the 2016 yearly opening level at 1.4732. The story on the daily timeframe, nevertheless, shows price interacting with a reasonably strong daily supply zone coming in at 1.4278-1.4188. Also worthy of note is the daily resistance area sited just above it at 1.4393-1.4297 and intersecting daily channel resistance (etched from the high 1.2903).
Across on the H4 timeframe, we can see that the candles are currently testing a H4 Quasimodo resistance at 1.4233, which is shadowed closely by a H4 mid-level resistance at 1.4250.
Potential trading zones:
There are a few cautionary points to consider if you are looking to short the H4 resistance mentioned above:
- The immediate trend is firmly pointing north.
- The initial H4 bearish pin bar failed to generate any follow-through selling.
- There is concern over the recent breach of the aforesaid weekly trendline resistance.
- Nearby H4 support in the form of February’s opening level at 1.4198.
To our way of seeing things, a sell at this point in time is not what we would label high probability. The same goes for longs, unfortunately. Yes, we see the breach of a major weekly trendline, but buying into H4 and daily structure highlighted above could be a frustrating endeavor and result in several days of drawdown!
Data points to consider today: US CB consumer confidence; FOMC Bostic speech.
Areas worthy of attention:
Supports: 1.42; 1.4198.
Resistances: weekly trendline resistance; 1.4278-1.4188; 1.4393-1.4297; daily channel resistance; 1.4233; 1.4250.
AUD/USD:
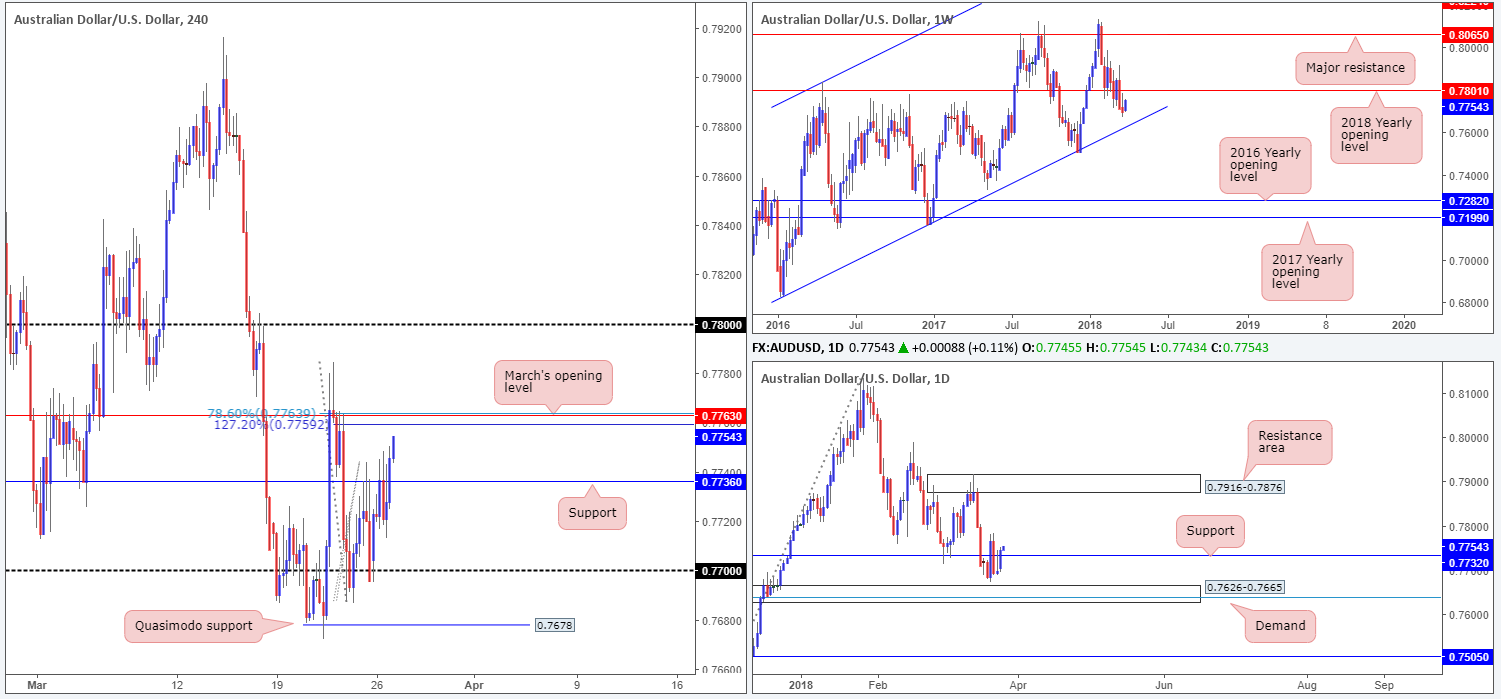
The commodity currency was generally higher against the buck on Monday, which, as you can see, marginally forced daily price back above 0.7732: a daily resistance, and positioned the Aussie within striking distance of March’s opening level seen on the H4 timeframe at 0.7763. What we like about this line is it fuses with a 127.2% H4 Fib ext. point at 0.7759 and a 78.6% H4 Fib resistance value at 0.7763. In the event that these lines fail to hold, the next port of call beyond here can be seen at around 0.78, which happens to converge beautifully with the 2018 yearly opening level at 0.7801 seen plotted on the weekly timeframe.
Potential trading zones:
In view of the surrounding H4 confluence, we would not be surprised to see the unit bounce lower from March’s open level and potentially attack nearby H4 support at 0.7736. However, traders may want to keep in mind that there is a possibility that price will be dragged up to 0.78 given its connection to a yearly opening level. Also, in addition to this, bear in mind that we have RBA Assist Gov. Kent speaking soon.
Data points to consider today: RBA Assist Gov. Kent speech; US CB consumer confidence; FOMC Bostic speech.
Areas worthy of attention:
Supports: 0.7736; 0.7732.
Resistances: 0.7763; 0.7759; 0.7801.
USD/JPY:
Trade war tensions have so far eased this week as both the US and China appear to be willing to work together to reach agreeable trade terms and find a solution to the current tariff threat exchange that has plagued market participants in recent weeks.
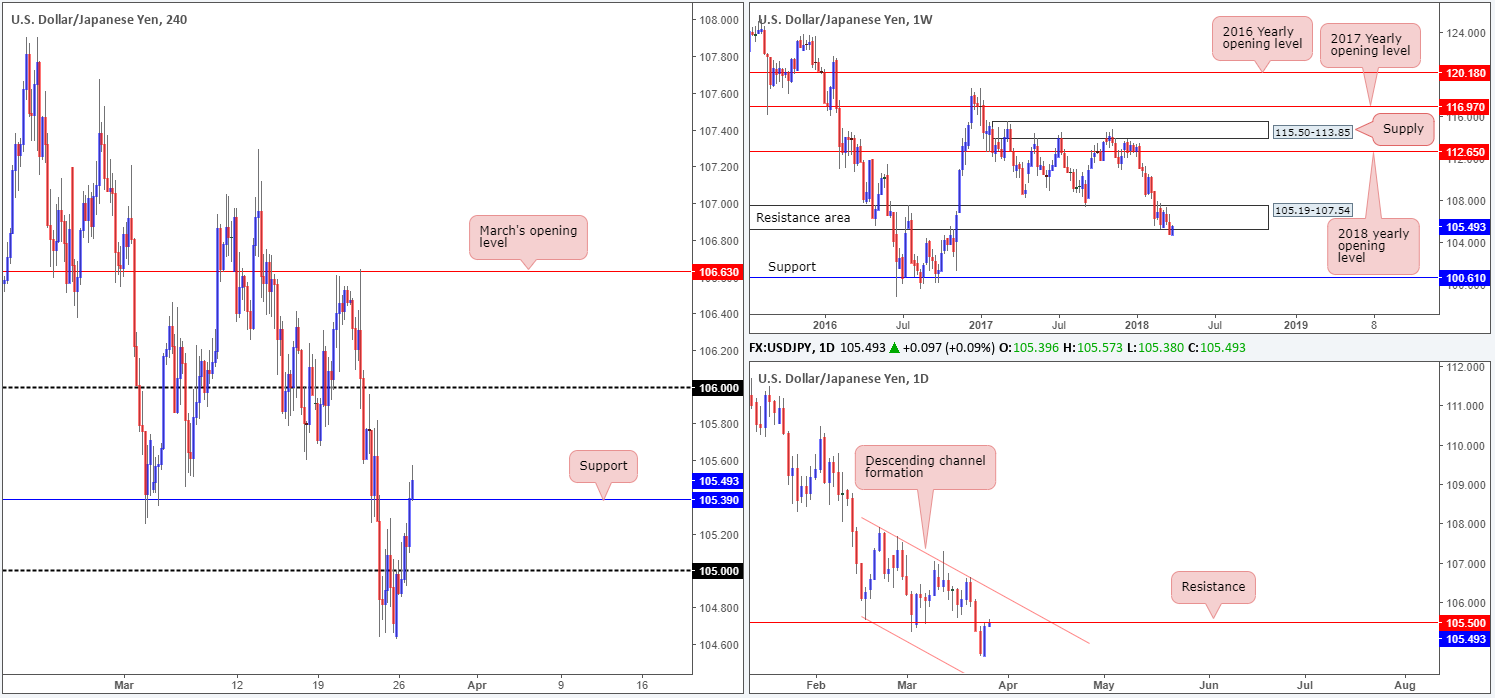
In recent sessions, we can see that the market bid risk assets broadly higher and sent the USD and the safe-haven yen lower against the majority of major currencies. In the shape of a near-full-bodied daily bull candle, the USD/JPY concluded trade closing at the underside of a H4 resistance at 105.39 and just south of a daily resistance level at 105.50. The other key thing to bear in mind here is weekly price is currently seen retesting the underside of a weekly resistance area at 105.19-107.54.
This morning’s trade, on the other hand, crossed above both noted H4 and daily resistances and now appears to be heading for the 106 handle and daily channel resistance (extended from the high 107.90), respectively.
Potential trading zones:
Despite H4 and daily price showing room for an extension to the upside, weekly sellers could make an appearance at any moment from the aforementioned weekly resistance area! What’s more the break above the daily resistance level is not yet confirmed on a closing basis, and therefore could still be just a fakeout to run stops. Should we close back below daily resistance on a closing basis in the shape of a daily bearish pin bar, this, in our view, would be a reasonably nice-looking sell signal for a medium/long-term trade, given where we’re trading from on the weekly scale right now!
Data points to consider today: US CB consumer confidence; FOMC Bostic speech.
Areas worthy of attention:
Supports: 105; 105.39.
Resistances: 105.50; 105.19-107.54.
USD/CAD:
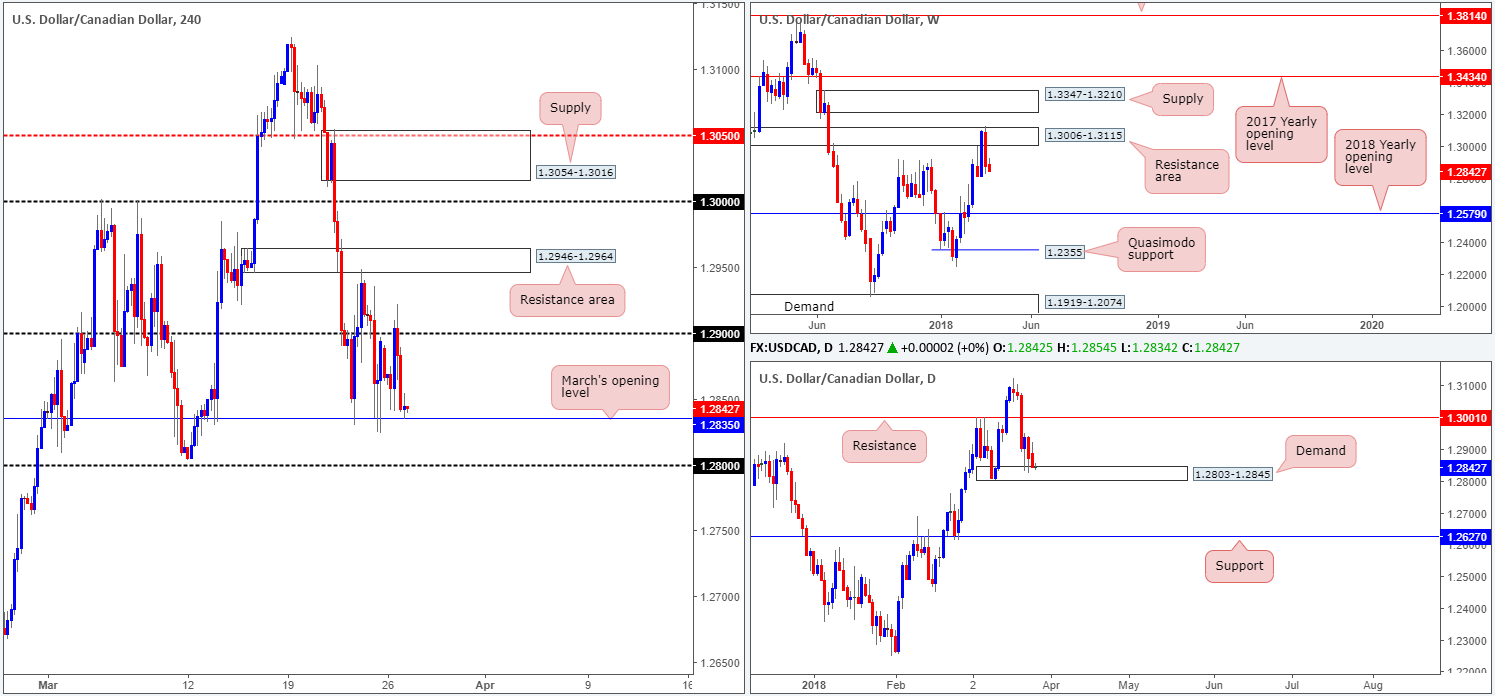
The USD/CAD, as you can see, extended Friday’s losses on Monday, despite a somewhat softer tone in oil prices. Yesterday’s move lower from the 1.29 handle on the H4 timeframe followed a risk-on theme, forcing price to navigate March’s opening level at 1.2835. A violation of this monthly level could see the 1.28 boundary enter the fray.
After shaking hands with a weekly resistance area at 1.3006-1.3115, the pair has reflected a bearish position. Should this continue, the next downside target in view is not seen until we reach the 2018 yearly opening level at 1.2579. Turning our attention over to the daily timeframe, daily demand at 1.2803-1.2845 remains in motion. Providing that daily bulls defend the current demand base, a run up to nearby daily resistance at 1.3001 could take place. Further selling, on the other hand, has the daily support level at 1.2627 to target.
Potential trading zones:
Medium term, this market is somewhat restricted given weekly and daily structure (highlighted in bold).
Short term, however, March’s opening level could hold for another round of buying and potentially rotate back up to 1.29, seeing as it is connected with daily demand. Failing this, traders will likely be honing in on the 1.28 line seen directly below, which is positioned three pips beneath the current daily demand. Remember, though, these support levels face possible selling pressure from weekly sellers!
Data points to consider today: US CB consumer confidence; FOMC Bostic speech.
Areas worthy of attention:
Supports: 1.2835; 1.28; 1.2803-1.2845; 1.2627; 1.2579.
Resistances: 1.29; 1.3006-1.3115.
USD/CHF:
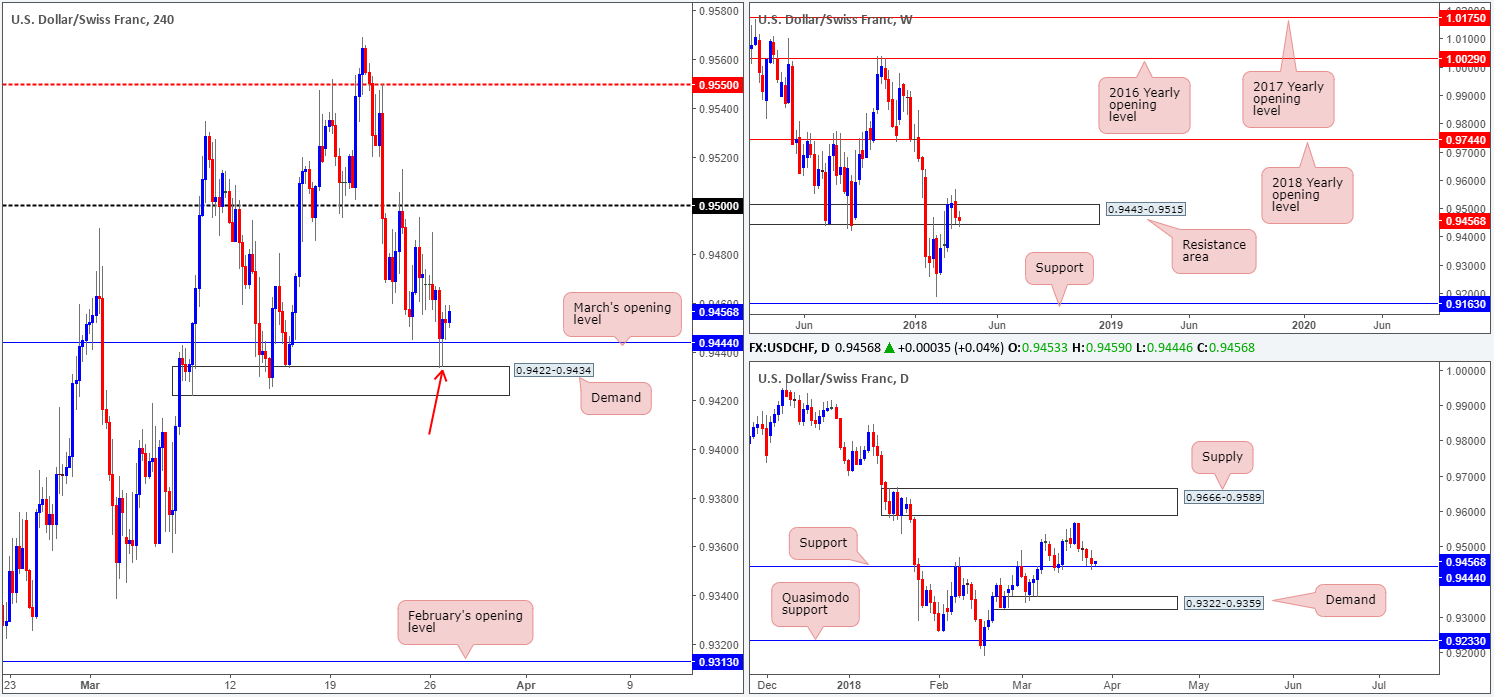
For those who read Monday’s report you may recall that the team highlighted March’s opening level seen on the H4 timeframe at 0.9444, which also happens to be a daily support level. We anticipated a fakeout of this barrier given how close an already proven H4 demand at 0.9422-0.9434 was positioned. As you can see, this has played out exactly as expected, and a strong signal to go long was seen after the close of the H4 bullish pin-bar formation marked with a red arrow. Well done to any of our readers who managed to jump aboard here! According to the daily timeframe, the next upside target – apart from the 20th March high 0.9569 – can be seen at a rather robust daily supply at 0.9666-0.9589.
Potential trading zones:
Apart from the recent buy setup emphasized above, we do not see much else to hang our hat on at this time. Traders who are currently long this market will likely have their crosshairs fixed on 0.95 as an initial take-profit zone.
Data points to consider today: US CB consumer confidence; FOMC Bostic speech.
Areas worthy of attention:
Supports: 0.9444; 0.9422-0.9434.
Resistances: 0.95; 0.9666-0.9589.
DOW 30:
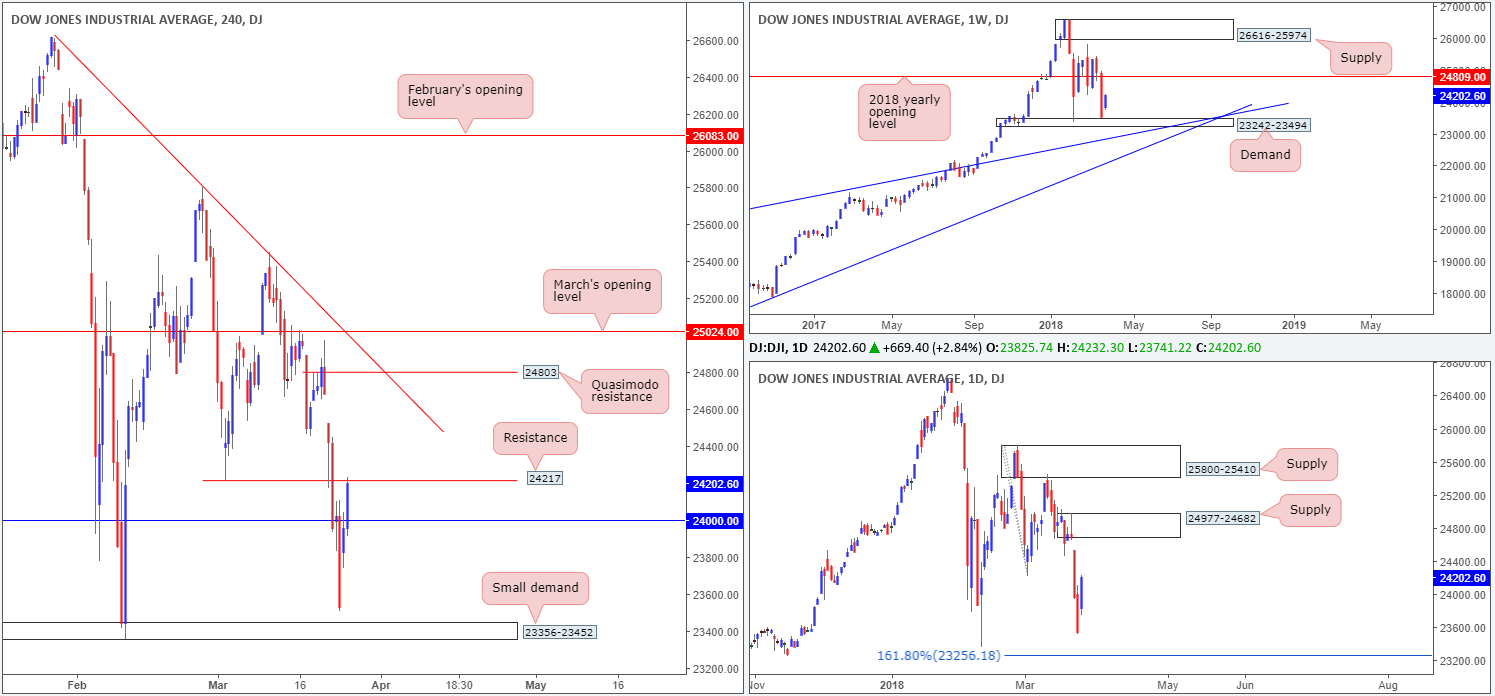
Wall Street trimmed nearly half of the previous week’s losses and posted its best percentage daily gain in almost three years on Monday. As Trade War tensions ease following the US and China’s decision to begin negotiating trade, this led to a risk-on market tone.
From a technical perspective, a rotation to the upside was to be expected as weekly price recently came within a few points of weekly demand based at 23242-23494. The next upside target on the weekly scale can be seen at the 2018 yearly opening level drawn from 24809. Looking down to the daily timeframe, however, the next port of call to the upside falls in at 24977-24682: a strong-looking daily supply that houses the 2018 yearly line.
H4 price, on the other hand, crossed above the 24K mark and connected with a H4 resistance formed at 24217 in recent trade. A break of this line would likely clear the pathway north up to a H4 Quasimodo resistance at 24803, which is seen located within the walls of the current daily supply zone and just south of the 2018 yearly line.
Potential trading zones:
Taking a short from the current H4 resistance will not likely turn up much, in our opinion. The most will likely be a pullback to 24000. Ultimately, we feel the best course of action would be to wait for a H4 close above the noted H4 resistance for a possible long trade, targeting the underside of the daily supply zone at 24682. A H4 close higher, followed up with a retest in the shape of a full or near-full-bodied H4 bull candle, would likely be sufficient enough to call in buyers and pull prices higher.
Data points to consider today: US CB consumer confidence; FOMC Bostic speech.
Areas worthy of attention:
Supports: 23242-23494; 24000.
Resistances: 24217; 24977-24682; 24809.
GOLD:
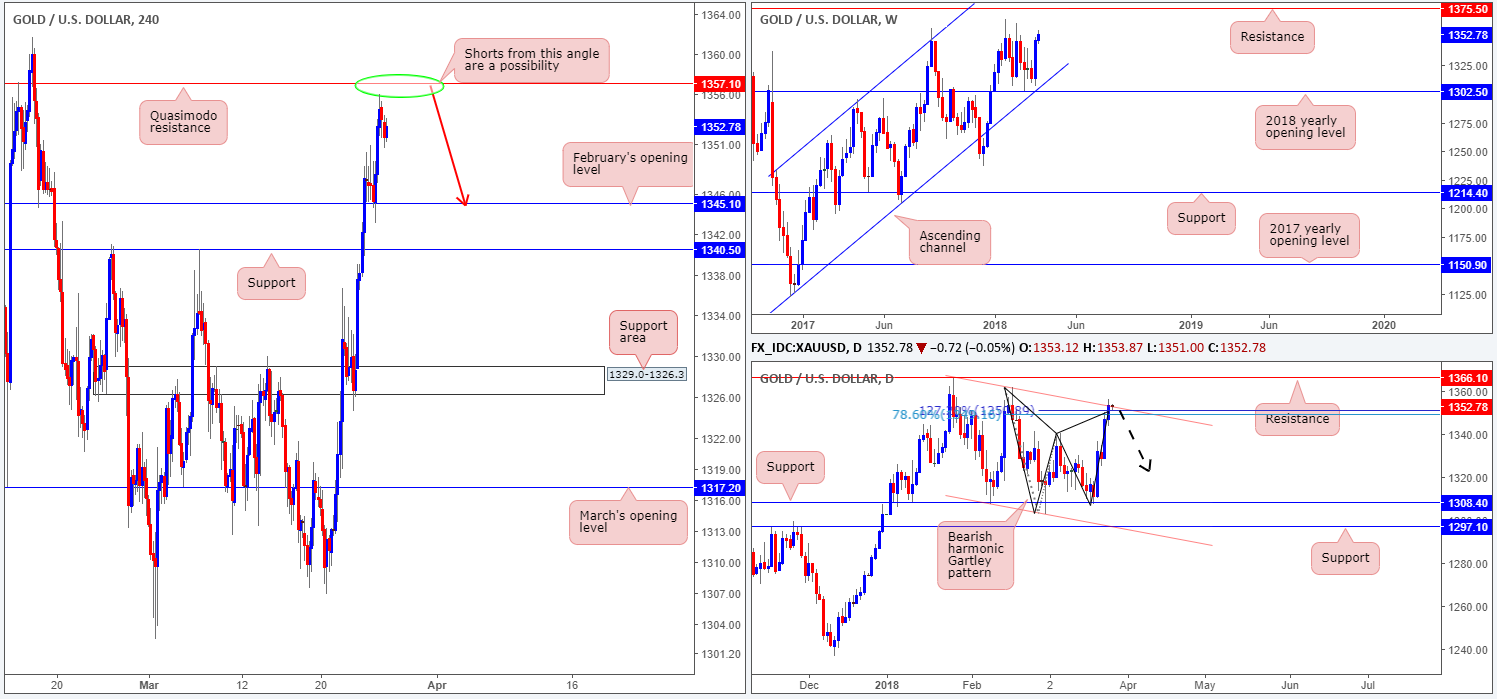
Kicking this morning’s report off from the top, we can clearly see weekly price is currently poised to challenge weekly resistance plotted at 1375.5. While this may be the case on the weekly scale, down on the daily timeframe we have ourselves a nice-looking daily bearish harmonic Gartley pattern that terminates (78.6% Fib retracement) around 1349.6, which is closely positioned to a daily channel resistance extended from the high 1366.0.
On the back of a waning USD, Monday’s movement saw H4 price advance after retesting a February’s level at 1345.1. As you can see, the move north brought price up to within shouting distance of a H4 Quasimodo resistance level coming in at 1357.1.
Potential trading zones:
The daily bearish harmonic Gartley pattern and the aforementioned H4 Quasimodo resistance are of interest. A test of this H4 level, followed up with a full or near-full-bodied H4 bearish candle would, in our humble view, be enough to warrant a short position. The only grumble, of course, is the fact that weekly price indicates further buying could be seen up to the weekly resistance level at 1375.5.
Downside targets from the H4 Quasimodo fall in at a February’s opening level mentioned above at 1345.1, a H4 support level drawn from 1340.5, followed by a H4 support area at 1329.0-1326.3 and then quite possibly March’s opening level at 1317.2.
Areas worthy of attention:
Supports: 1345.1; 1340.5; 1329.0-1326.3; 1317.2.
Resistances: 1349.6; daily channel resistance; 1375.5; 1357.1.
This site has been designed for informational and educational purposes only and does not constitute an offer to sell nor a solicitation of an offer to buy any products which may be referenced upon the site. The services and information provided through this site are for personal, non-commercial, educational use and display. IC Markets does not provide personal trading advice through this site and does not represent that the products or services discussed are suitable for any trader. Traders are advised not to rely on any information contained in the site in the process of making a fully informed decision.
This site may include market analysis. All ideas, opinions, and/or forecasts, expressed or implied herein, information, charts or examples contained in the lessons, are for informational and educational purposes only and should not be construed as a recommendation to invest, trade, and/or speculate in the markets. Any trades, and/or speculations made in light of the ideas, opinions, and/or forecasts, expressed or implied herein, are committed at your own risk, financial or otherwise.
The use of the site is agreement that the site is for informational and educational purposes only and does not constitute advice in any form in the furtherance of any trade or trading decisions.
The accuracy, completeness and timeliness of the information contained on this site cannot be guaranteed. IC Markets does not warranty, guarantee or make any representations, or assume any liability with regard to financial results based on the use of the information in the site.
News, views, opinions, recommendations and other information obtained from sources outside of www.icmarkets.com.au, used in this site are believed to be reliable, but we cannot guarantee their accuracy or completeness. All such information is subject to change at any time without notice. IC Markets assumes no responsibility for the content of any linked site. The fact that such links may exist does not indicate approval or endorsement of any material contained on any linked site.
IC Markets is not liable for any harm caused by the transmission, through accessing the services or information on this site, of a computer virus, or other computer code or programming device that might be used to access, delete, damage, disable, disrupt or otherwise impede in any manner, the operation of the site or of any user’s software, hardware, data or property.


