
A note on lower timeframe confirming price action…
Waiting for lower timeframe confirmation is our main tool to confirm strength within higher timeframe zones, and has really been the key to our trading success. It takes a little time to understand the subtle nuances, however, as each trade is never the same, but once you master the rhythm so to speak, you will be saved from countless unnecessary losing trades. The following is a list of what we look for:
- A break/retest of supply or demand dependent on which way you’re trading.
- A trendline break/retest.
- Buying/selling tails/wicks – essentially we look for a cluster of very obvious spikes off of lower timeframe support and resistance levels within the higher timeframe zone.
- Candlestick patterns. We tend to only stick with pin bars and engulfing bars as these have proven to be the most effective.
For us, lower timeframe confirmation starts on the M15 and finishes up on the H1, since most of our higher timeframe areas begin with the H4. Stops usually placed 5-10 pips beyond your confirming structures.
EUR/USD:
Following Sunday’s open 1.1216 the EUR took on a relatively bullish stance, stretching to highs of 1.1278 despite disappointing German IFO data. Given that this recent show of strength brought prices up to a minor resistance line over on the daily chart at 1.1265, and the single currency still remains loitering around a weekly supply zone drawn from 1.1533-1.1278, we feel a sell-off could be on the cards today…
As such, our focus remains on the H4 demand at 1.1168-1.1190 for a potential buy trade today/this week. As we mentioned in Friday’s report, we’ve built a case for a possible entry on the following points:
- The H4 demand has incredible bullish momentum from the base.
- It ties in nicely with a deep 88.6% Fibonacci support at 1.1180.
- Psychological support 1.1200 sits just above, which will likely be faked in order to hit our buy zone.
- The H4 demand also converges nicely with an AB=CD bullish formation (black arrows) which terminates relatively deep within the zone at around 1.1171. However, there is no longer clear symmetry seen within this formation.
- Over on the USDX, which is inversely correlated to the EUR/USD, there’s a nice-looking bearish AB=CD pattern forming which also completes within the extremes of a H4 supply (95.23-95.49) at 95.47. Similar to the EUR, there is also no longer symmetry seen within this formation.
- And finally, let’s not forget that the daily demand at 1.1143-1.1187 bolsters the current H4 demand area, which is the next downside target as per the daily timeframe.
Buying from this H4 demand base without lower timeframe confirmation (for confirmation techniques, please see the top of this report) is not really something we’d stamp high probability due to potential downside pressure coming in from the above said weekly supply. In the event that further bullish pressure is seen within this market today, nevertheless, we’ll look to reassess our stance for Wednesday’s trading.
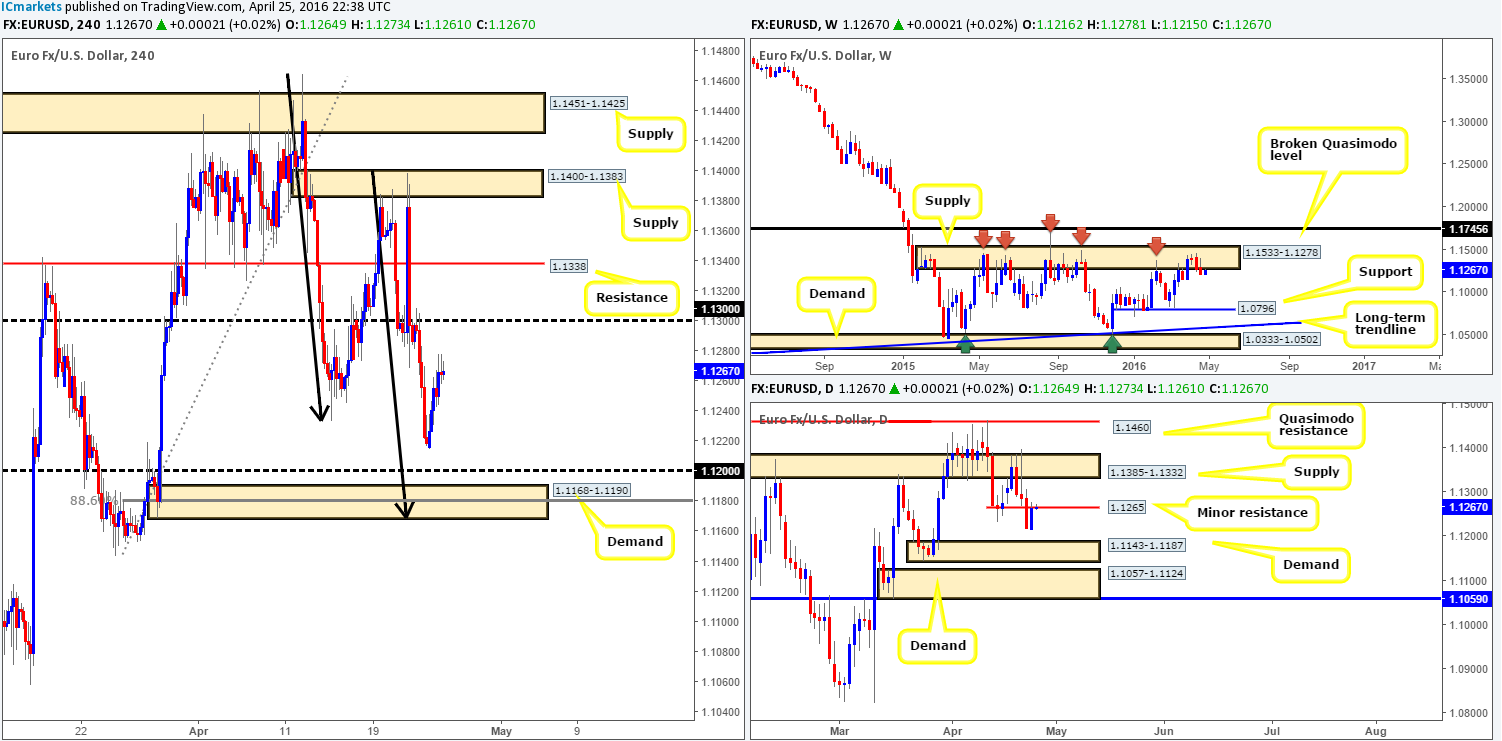
Levels to watch/live orders:
- Buys: 1.1168-1.1190 [Tentative – confirmation required] (Stop loss: dependent on where one confirms this area).
- Sells: Flat (Stop loss: N/A).
GBP/USD:
The week began with a 60-pip gap north to 1.4462, which, as you can see, was quickly filled. Shortly after this, Cable aggressively advanced north and whipsawed through both psychological resistance 1.4500 and H4 supply seen at 1.4514-1.4475. Looking over to the daily chart, yesterday’s movement on the H4 managed to chalk up an indecision candle, which despite closing within daily supply at 1.4578-1.4467 shows a slight edge going to the bulls. Alongside this, weekly action (in our opinion) still shows potential for a rally north up to the broken Quasimodo resistance line coming in at 1.4633. The main reason for this, other than the strong bounce seen from the broken Quasimodo support at 1.4051, is the weekly candle formed on the 28th March. Notice that it boasts a strong wick which stabbed as high as 1.4459 during that week. This likely consumed a truckload of supply and as a result might have cleared the path for a move higher.
Our team has absolutely no interest in shorting this market until the H4 mid-level support 1.4450 and the psychological support 1.4400 is taken out (likely clearing the path south down to 1.4300). The reason for requiring both numbers to be consumed simply comes down to what we’re currently seeing on the higher-timeframe picture (see above in bold). On the flip side, should price close above the current area of H4 supply, there’s little, as far as we see, from stopping price from rallying north to a H4 Quasimodo resistance at 1.4649 (sits just above the aforementioned broken weekly Quasimodo resistance line). Granted, entering long on a break/retest of the current H4 supply would place one heavily within daily supply at 1.4578-1.4467, but with the weekly flow indicating a move north is possible, we feel it’s a risk worth taking.
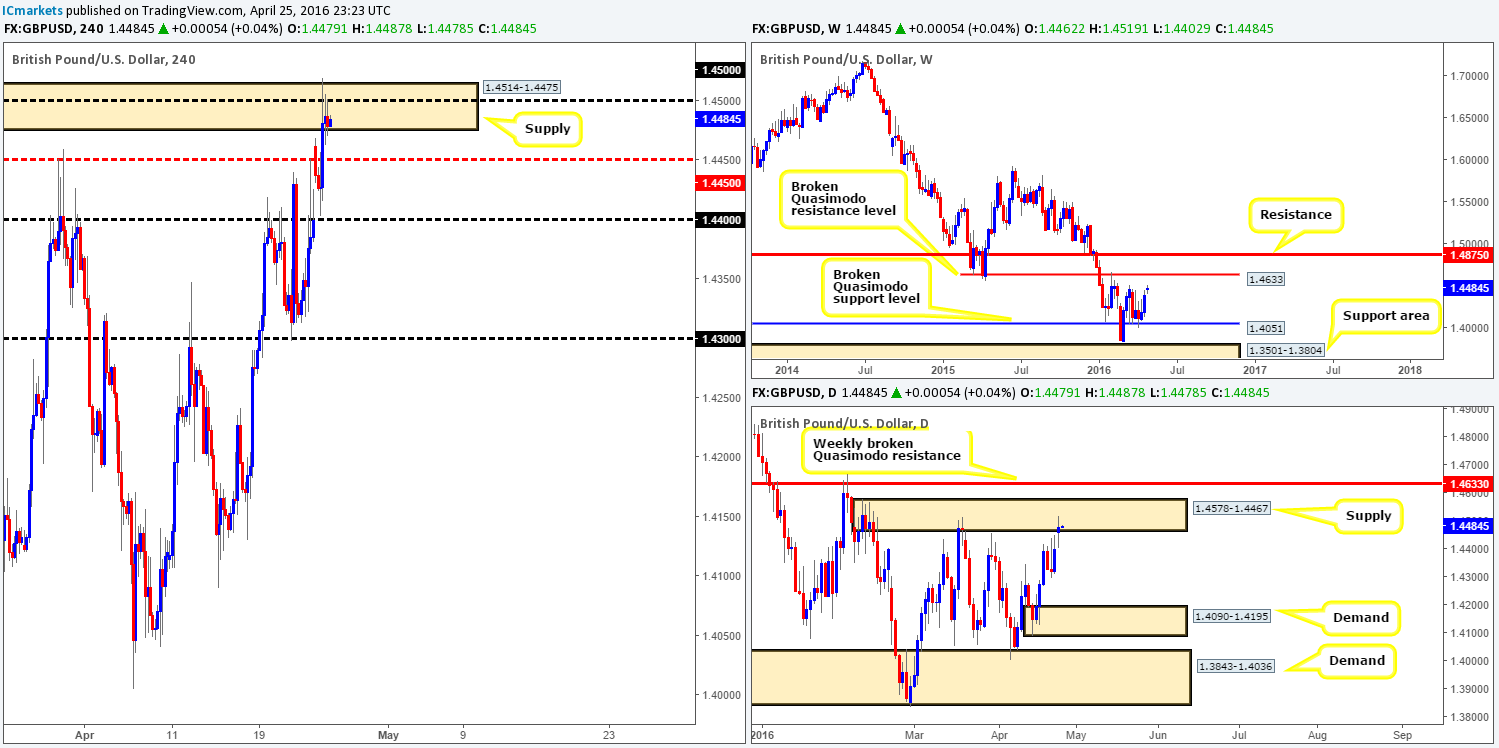
Levels to watch/live orders:
- Buys: Watch for price to consume 1.4514-1.4475 and look to trade any retest seen thereafter (lower timeframe confirmation required).
- Sells: Watch for price to consume 1.4400 and look to trade any retest seen thereafter (lower timeframe confirmation required).
AUD/USD:
Beginning this morning’s analysis with a quick look at the weekly chart shows that price remains loitering between resistance drawn from 0.7846 and support coming in at 0.7604. To us, both lines are well established and hold equal footing, so do keep the two noted down as either could play a significant role during trade this week. Climbing down to the daily chart, yesterday’s action found support within demand given at 0.7738-0.7678. That being said, the response has so far been soft with price only managing to close within 25% of the previous candle body.
From the H4 chart, we can see that during the course of yesterday’s sessions the bulls did a relatively good job of defending the 0.7700 handle. This may, alongside daily action being housed within demand (see above), be enough to force price to connect with the H4 mid-level resistance barrier 0.7750 today. Should this come into view, we feel the offers residing around this mid-way point will likely be weak judging by the amount of times it was retested before pushing lower (see green circle). Therefore, if one manages to spot a lower timeframe buy setup forming at 0.7700, it may be worth considering entering long (for confirmation techniques, please see the top of this report), since there’s potential for an advance up to the 0.7800 handle.
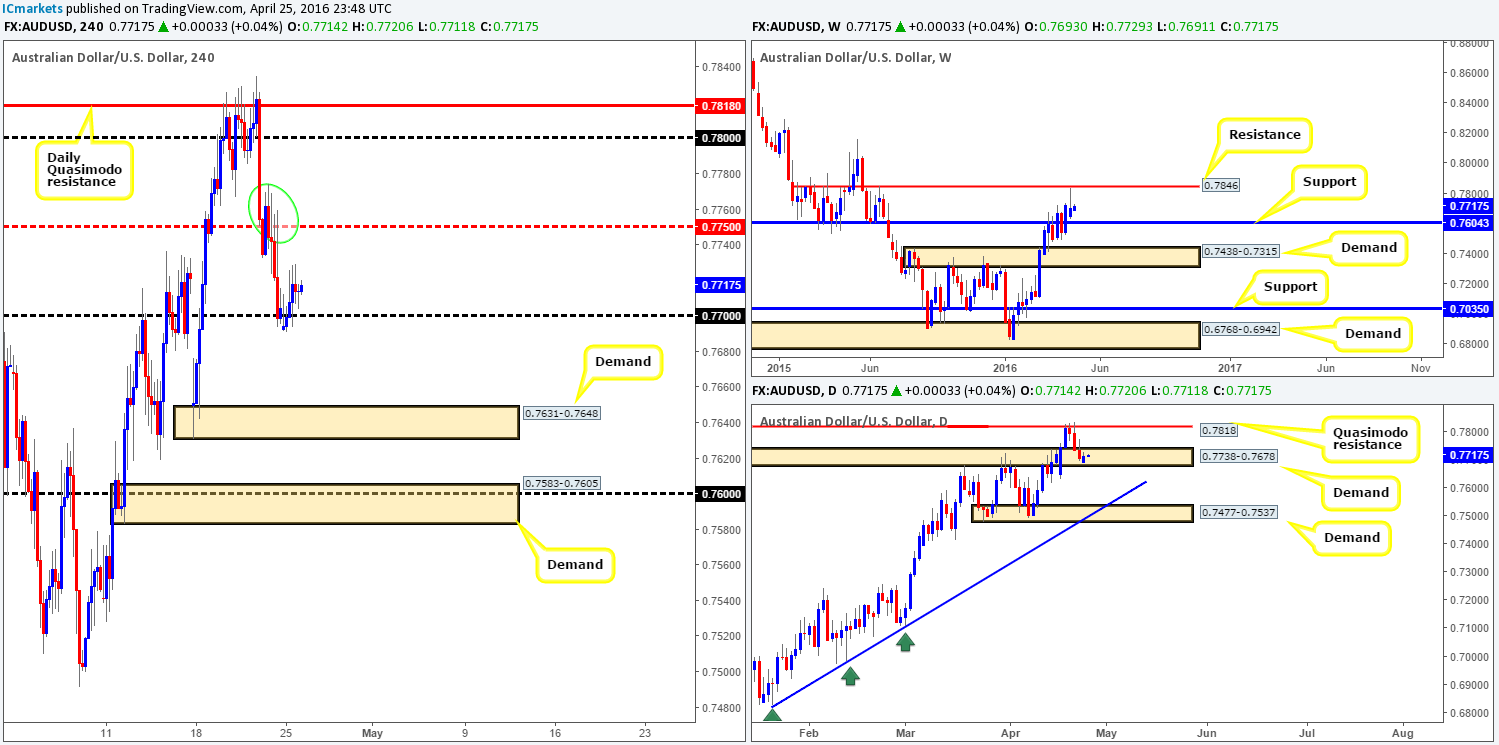
Levels to watch/live orders:
- Buys: 0.7700 region [Tentative – confirmation required] (Stop loss: dependent on where one confirms this area).
- Sells: Flat (Stop loss: N/A).
USD/JPY:
Reporting from the weekly chart this morning, it is relatively clear to see that this market has begun weakening from the underside of weekly supply coming in at 113.80-111.59. In the event that this continues, the next downside target can be seen at 110.09 – a weekly support line. Despite what the weekly picture is showing, daily price is currently retesting a recently broken resistance line at 110.96 as support. If this boundary holds firm we see little overhead resistance stopping this market from advancing north up to supply coming in at 113.80-113.16. Therefore, with just these two charts in mind, to enter short it would be best to wait for a close (be it on the H4 or daily timeframe) below daily support at 110.96 beforehand. Entering long on the other hand would be tricky even if the daily support holds since there is always a chance that strong selling could come into the market from the aforementioned weekly supply!
With the H4 chart showing the buyers and sellers currently battling for position around the 111.00 handle, following yesterday’s sell-off, this is what we have logged going forward:
- We have no interest in buying from the daily support when there’s a whopping great weekly supply zone looming over it like a big rain cloud.
- Feeding off of the weekly sellers’ momentum, price could close below 111.00 and this could possibly open a small window of opportunity today. Assuming that price closes below 111.00 and retests it as resistance without hitting the top-side of H4 demand below at 110.63-110.31 (first take-profit zone), then with a relatively tight stop, one could look to short this market. We would prefer to play this one with lower timeframe confirmation but we fear since the first take-profit target sits nearby, it may not be possible. Ultimately, we’d be looking for price to engulf the first take-profit target and collide with the 110.00 handle which is also the weekly support at 110.09 as we discussed above, where the full position would be liquidated.
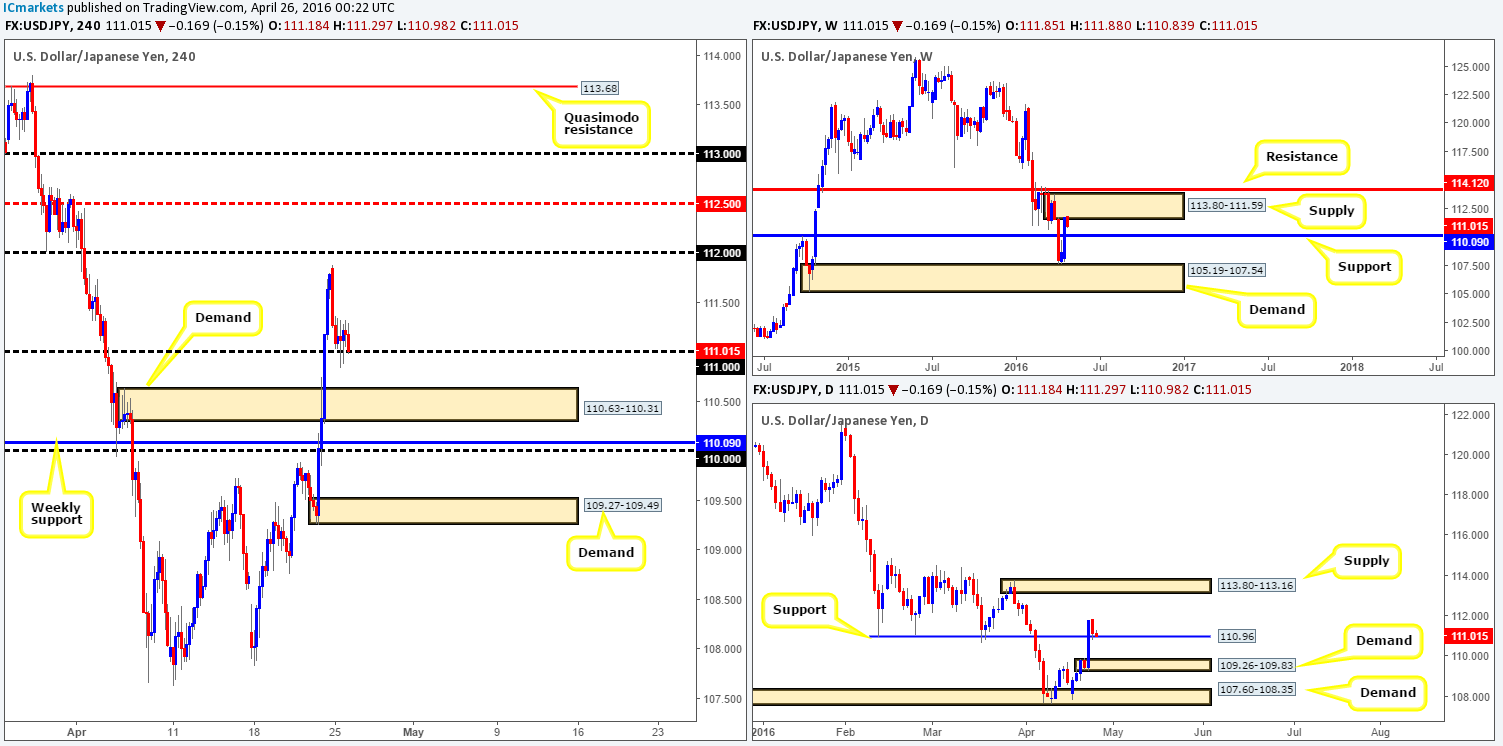
Levels to watch/live orders:
- Buys: Flat (Stop loss: N/A).
- Sells: Watch for price to consume 1.1100 and look to trade any retest seen thereafter (lower timeframe confirmation preferred).
USD/CAD:
Throughout the course of Monday’s sessions, movement was capped between psychological resistance 1.2700 and the H4 mid-level support 1.2650. Consequent to this much of the following analysis will be similar to Friday’s report…
Starting with the weekly action, price completely engulfed weekly support at 1.2833 last week, which has potentially opened up the path south towards weekly demand chalked up at 1.2127-1.2309. Before the sellers can achieve this, however, both daily demands at 1.2653-1.2753 and 1.2537-1.2567 will need to be taken out. This would, as far as we can see, likely set the stage for a continuation move south towards another daily demand coming in at 1.2309-1.2397 which conveniently sits on top of the weekly demand mentioned above.
Looking back to the H4 chart, we can see that H4 supply at 1.2779-1.2740 did a sound job of holding price lower on Friday. With all three charts in mind, we’re quite interested in looking for shorts around the H4 Quasimodo resistance line at 1.2749 which is positioned nicely within the above said H4 supply. In saying that though, we would also consider a trade on any retest seen at 1.2650 should the H4 mid-level support give way, targeting 1.2600 first and foremost. We say this simply because the current daily demand at 1.2653-1.2753 is looking extremely soft at the moment, and the next downside hurdle on the daily timeframe (as we mentioned above) does not come into the picture until the 1.2537-1.2567.
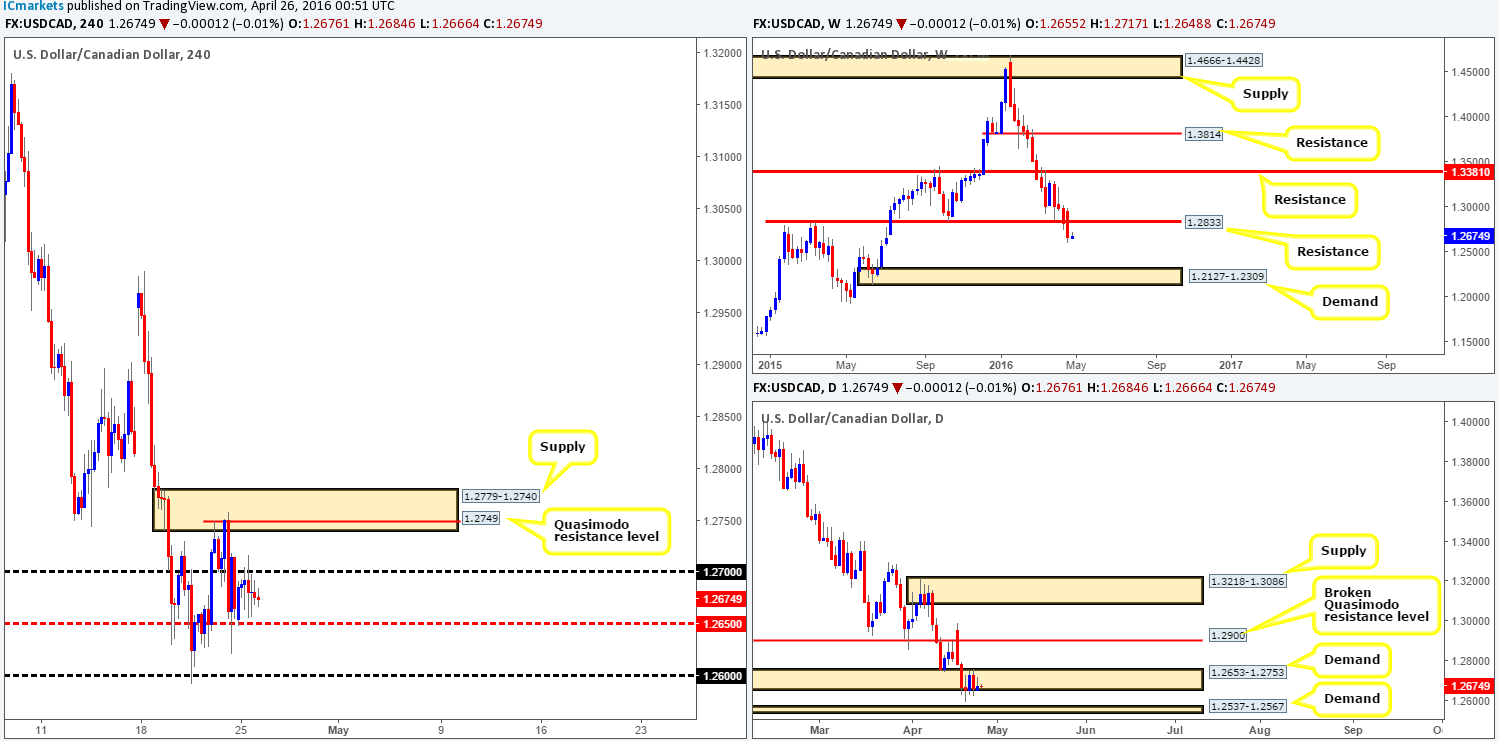
Levels to watch/live orders:
- Buys: Flat (Stop loss: N/A).
- Sells: Watch for price to consume 1.2650 and look to trade any retest seen thereafter (lower timeframe confirmation required). 1.2749 [Tentative – confirmation required] (Stop loss: dependent on where one confirms this level).
USD/CHF:
With the EUR/USD rallying higher yesterday, it’s only right to expect the Swissy to trade lower due to it being inversely correlated. This, as shown on the H4 chart, brought prices down to (and slightly beyond) the H4 mid-level support 0.9750. For those who read Monday’s report (see link below) you may recall us mentioning that the area between the H4 mid-level support 0.9750 and H4 support at 0.9722 looked like a reasonable possibility for a decent bounce north if price did not strike 0.9800 beforehand, which it has not!
We also went on to write about why a long trade from this area made sense from a higher-timeframe perspective. The weekly supply marked with a red arrow at 0.9787-0.9695 along with its partner supply on the daily timeframe at 0.9787-0.9755 was breached on Friday. As such, the weekly chart shows potential for price to rally up to weekly supply at 1.0092-0.9928, whilst the daily chart possibly opened the trapdoor north up to daily resistance at 0.9822, followed closely by fresh supply drawn from 0.9913-0.9869 (sits just below the aforementioned weekly supply).
Given the points above, our objective today is simple. Look for lower timeframe long entries between 0.9722/0.9750, targeting 0.9800, followed by 0.9822 (the daily resistance) and then for a final target around the daily supply at 0.9913-0.9869.
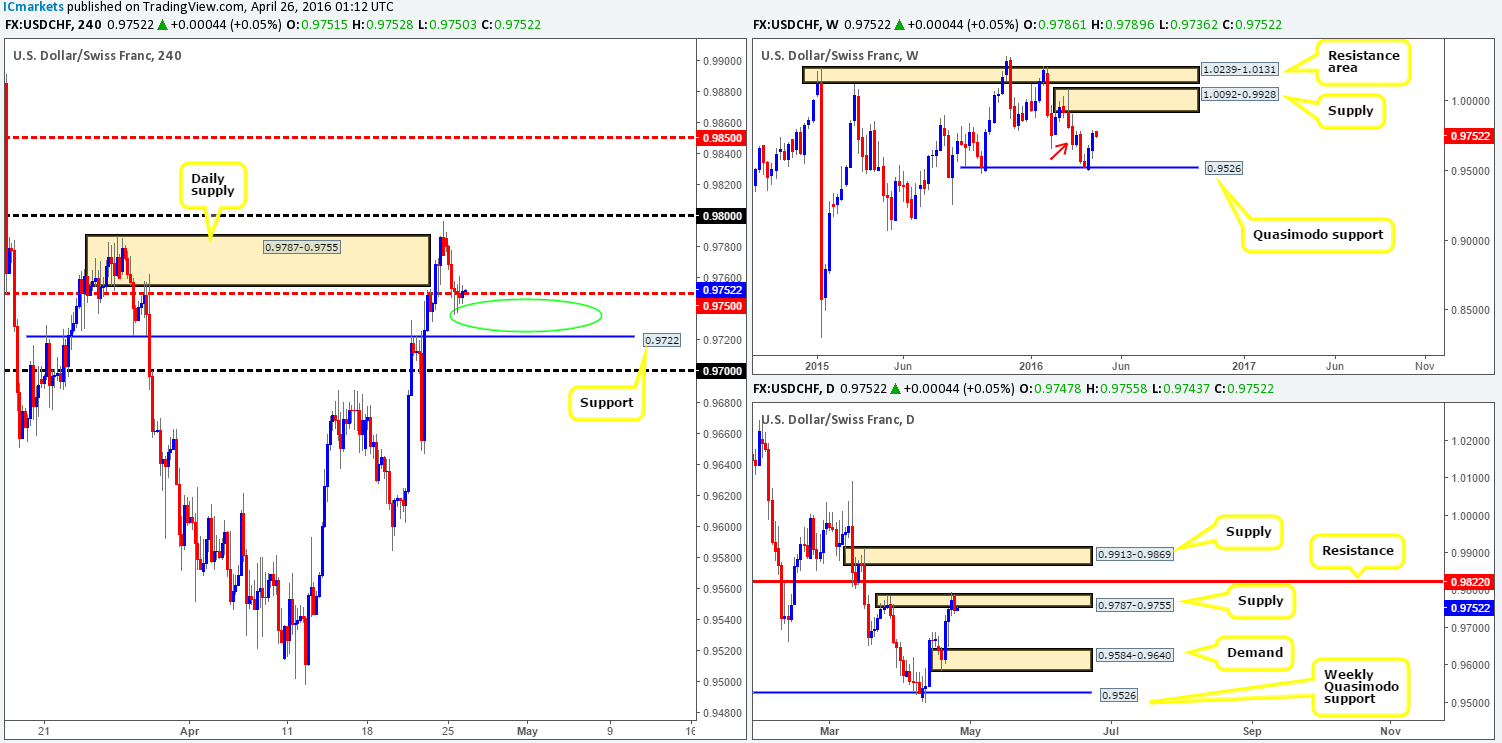
Levels to watch/live orders:
- Buys: 0.9722/0.9750 region [Tentative – confirmation required] (Stop loss: dependent on where one confirms this area).
- Sells: Flat (Stop loss: N/A).
DOW 30:
Kicking off our analysis with a look at the weekly chart this morning, it’s clear to see that offers around the current weekly resistance area at 17977-17811 may be on the verge of drying up. In that event, it’s likely we’ll see the DOW visit weekly resistance at 18253 sometime soon.
Although U.S. stocks actually edged lower during yesterday’s trading, daily action shows price found a strong pocket of bids from within a daily support area coming in at 17914-17858. In addition to this, we can see that the daily supply sitting above current price at 18153-18073 was breached on Wednesday last week, adding extra weight to a potential move north this week.
As we discussed in Monday’s report (see link below), a clear line of support in the form of a H4 broken Quasimodo line at 17920 held the market higher on Friday. Unfortunately, our team was unable to pin down a lower timeframe buy entry from this level yesterday as this was our initial plan. All is not lost however! Our overall expectation is for this unit to connect with the weekly resistance discussed above at 18253. Therefore, we see two possible methods of entry that could still play out for traders looking to buy. The first would be a break above and retest of the highs marked with a green circle around the 18017 region. From here, we’d trail price into the overhead daily supply and see how the market reacts. This would also be a logical point to move one’s stop to breakeven. The second method is slightly more conservative where we’d be looking for a close above the aforementioned daily supply which in turn would allow one to trade any retest seen. Both methods, at least for us, would require lower timeframe confirmation (for confirmation techniques, please see the top of this report) and have the same final take-profit line – the weekly resistance at 18253.
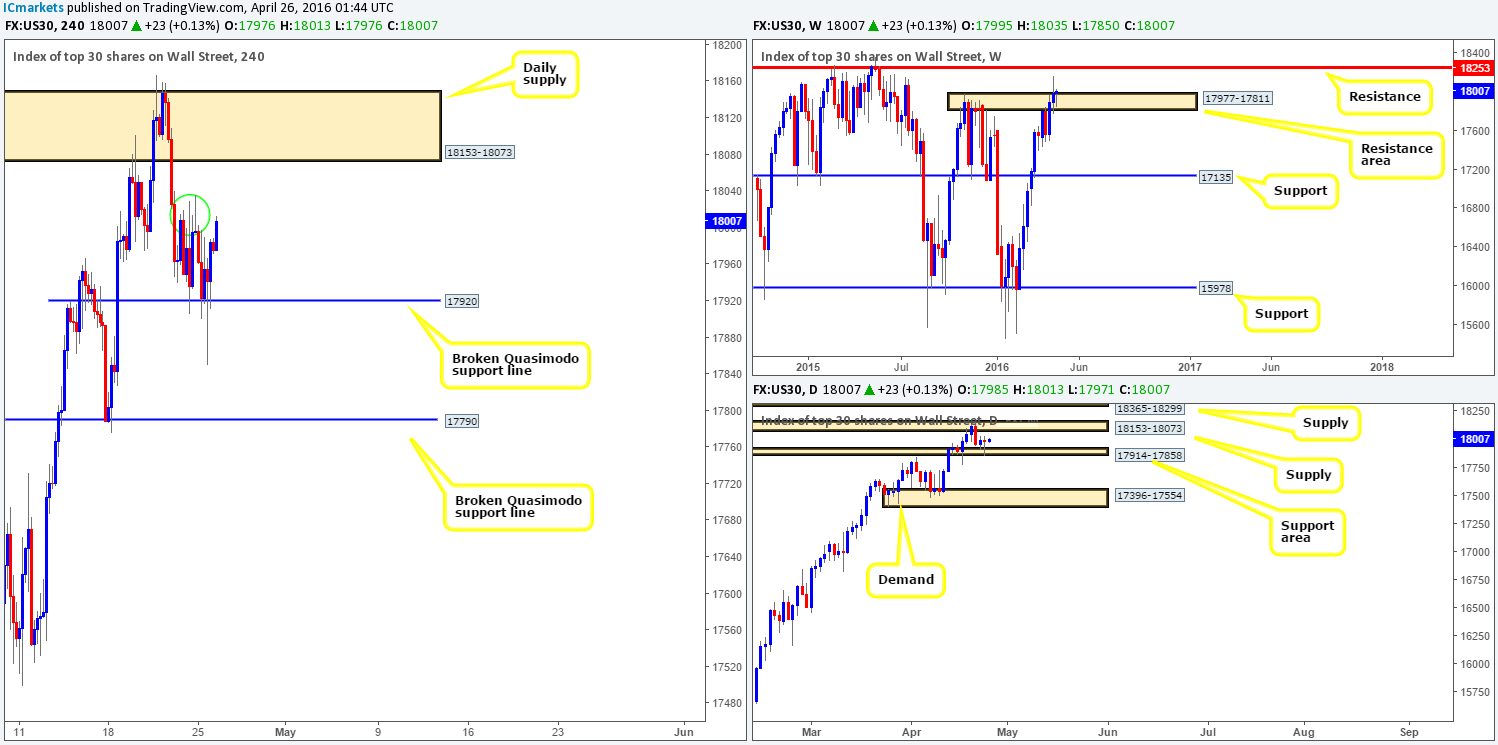
Levels to watch/live orders:
- Buys: Watch for price to consume the 18017 region and look to trade any retest seen thereafter (lower timeframe confirmation required). Watch for price to consume 18153-18073 and look to trade any retest seen thereafter (lower timeframe confirmation required).
- Sells: Flat (Stop loss: N/A).
XAU/USD:
Despite back-to-back weekly selling wicks being seen at the moment, weekly price remains capped between weekly supply drawn from 1307.4-1280.0 and weekly demand coming in at 1205.6-1181.2. As we mentioned in Monday’s report, both areas hold approximately the same weight in our opinion, and as such, the best we can do here is to keep an eyeball on the two zones for possible direction this week.
From the daily chart, demand at 1223.7-1233.3 has so far held firm, which is not something we expected to see. If price manages to hold steady from here, we may be in for further upside towards supply chalked up at 1270.8-1257.5.
Stepping across to the H4 chart, we can see that Gold rallied higher yesterday despite Friday’s action piercing below H4 demand at 1227.6-1232.2. This has, as you can see, brought the yellow metal up into the jaws of a H4 resistance area at 1240.5-1243.1 which for the time being is holding steady. Selling from this zone today, however, would be a risky play in our book. Not only would you be selling into daily demand, but there is also little direction supporting a short from here on the weekly timeframe (see above). With this in mind, the only alternative we see here is to wait and see if price manages to print a close above the current H4 resistance area. This would not only open up to the path north to H4 resistance at 1256.2 (sits just below the aforementioned daily supply), but also give traders the chance to trade any retest (with lower timeframe confirmation) seen on top of the H4 resistance area as support (for confirmation techniques, please see the top of this report). With this setup, at least you’d be trading in-line with daily flow rather than against it!
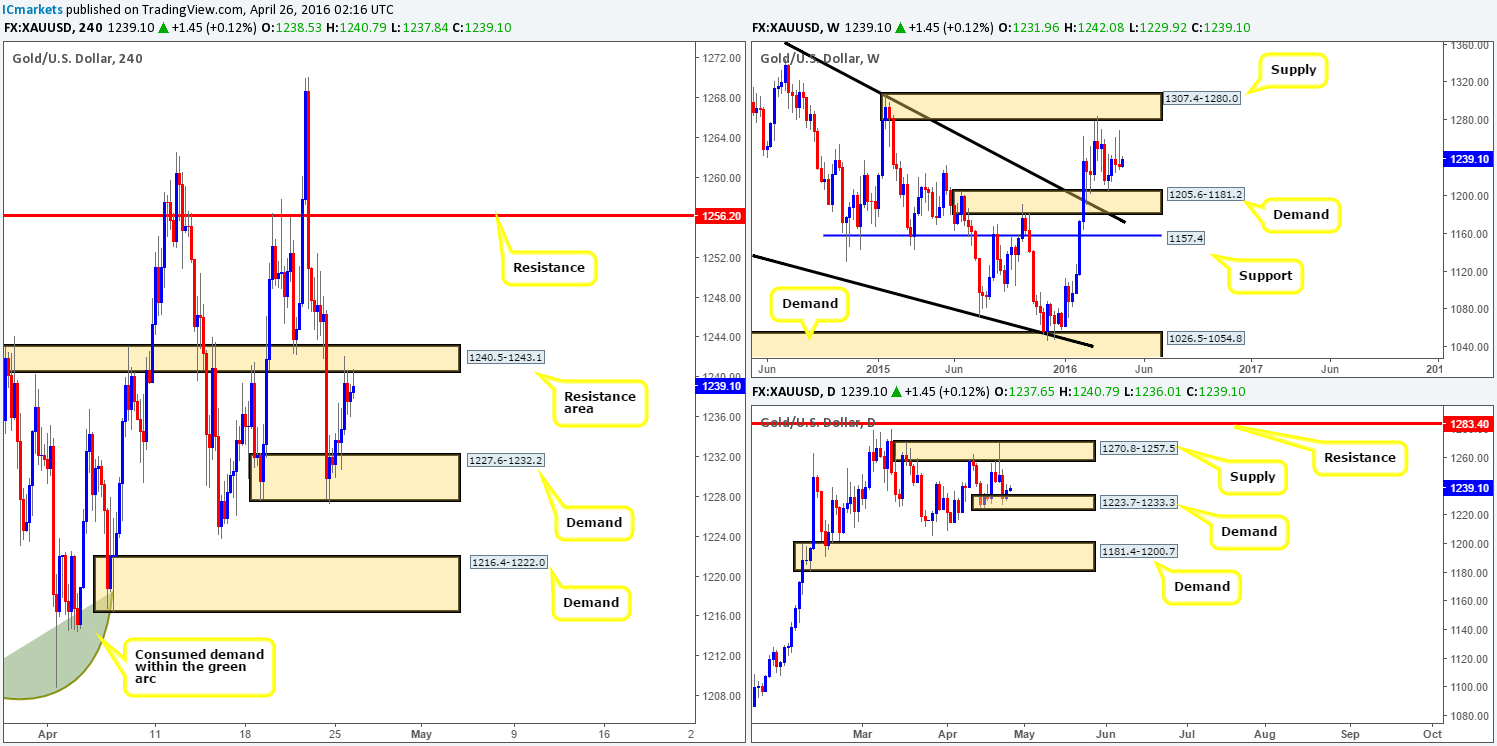
Levels to watch/live orders:
- Buys: Watch for price to consume 1240.5-1243.1 and look to trade any retest seen thereafter (lower timeframe confirmation required).
- Sells: Flat (Stop loss: N/A).


