
EUR/USD:
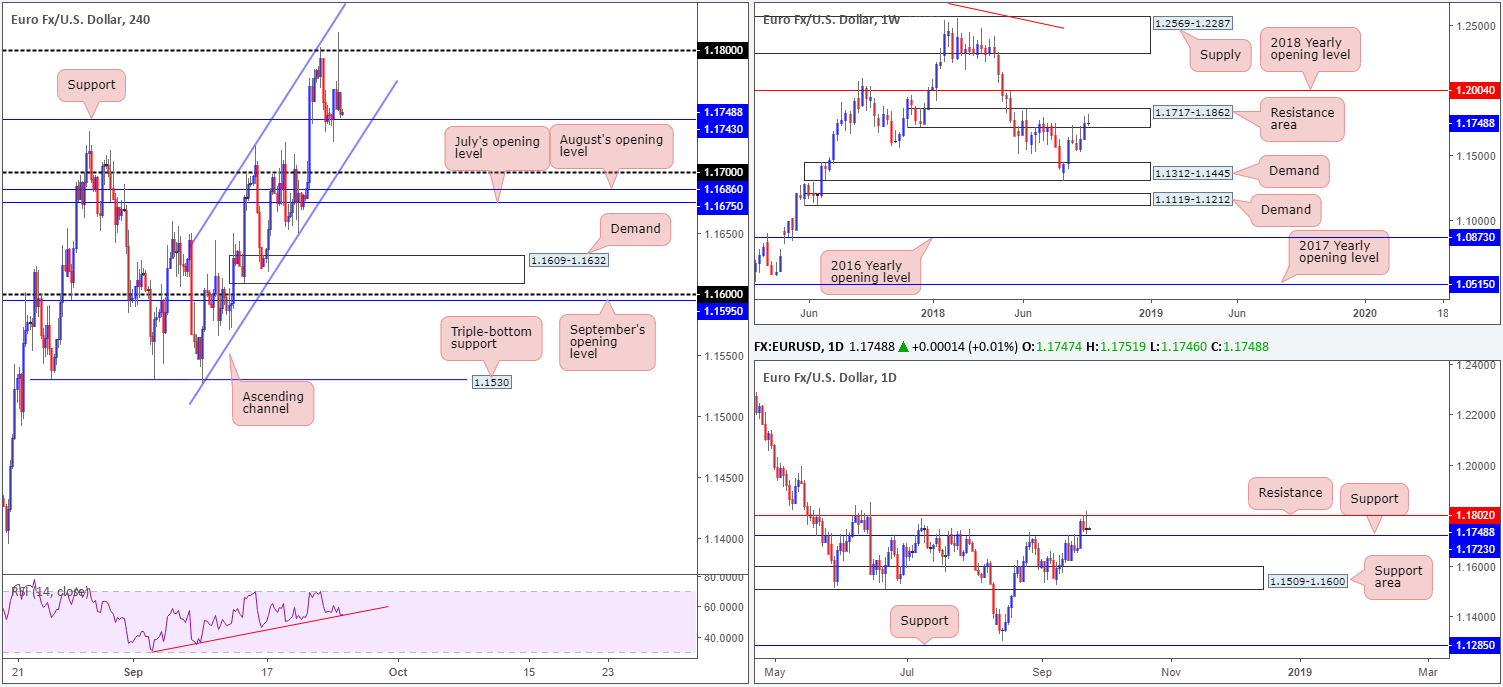
Comments from ECB’s Draghi provided the single currency fresh impetus on Monday, delivering a move through the 1.18 handle on the H4 timeframe to highs of 1.1815 (just missing the channel resistance [etched from the high 1.1721]). Draghi said he sees a vigorous pick-up in underlying inflation, along with strengthening domestic prices and wage growth. Although yesterday’s move refreshed multi-month highs, the market aggressively pared Draghi-fuelled gains into US hours, consequently concluding the day a few pips north of support plotted at 1.1743 – pretty much unchanged on the day.
Beyond the current H4 support, the next downside target rests at a channel support (taken from the low 1.1525), shadowed closely by the 1.17 handle and two monthly opening levels (July’s opening level at 1.1675 August’s opening level at 1.1686). It may also be worth noting the RSI indicator is seen testing trend line support.
The daily timeframe is visibly sandwiched between resistance 1.1802 and support priced in at 1.1723. The chart strongly suggests a test of the said support is on the horizon, given the recent bearish pin-bar formation. In addition to this, our technical studies show sellers may have the upper hand on the weekly scale as price recently shook hands with a notable resistance area coming in at 1.1717-1.1862.
Areas of consideration:
A long from the current H4 support, or even the 1.17 neighborhood, is faced with overhead pressure from higher-timeframe resistances highlighted above. For that reason, buying this market will likely be akin to swimming against the tide at this time.
Selling beyond the current H4 support, though in-line with higher-timeframe direction, unfortunately presents a collection of nearby H4 supports to contend with, making it a difficult sell, in our humble view.
Conditions appear restricted in this market. On account of the above, neither a long nor short seems attractive right now. Opting to remain on the sidelines is, therefore, an option.
Today’s data points: US CB consumer confidence.
GBP/USD:
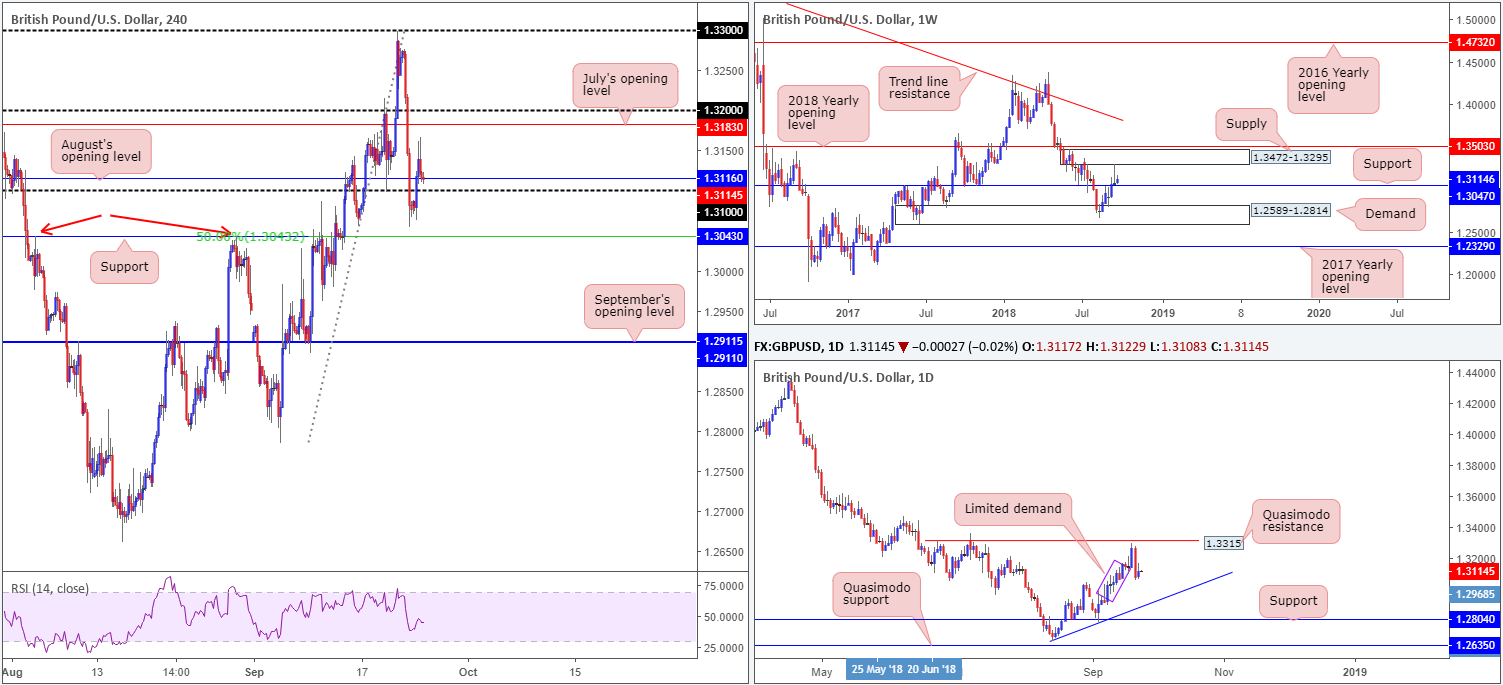
Pound sterling entered into a recovery phase on Monday, pruning a portion of Friday’s lost ground to a peak of 1.3166. As is evident from the H4 timeframe this morning, the candles are visibly retesting August’s opening level penciled in at 1.3116, which happens to be shadowed closely by the 1.31 handle. In the event support emerges from this neighborhood today, July’s opening level at 1.3183/1.32 are the next upside hurdles in view. A break of 1.31 to the downside, on the other hand, has support at 1.3043 and a 50.0% support value on the radar.
Against the backdrop of intraday flow, the daily timeframe exhibits potential to press as far south as trend line support (etched from the low 1.2661). To the left of current price we see limited demand in play (purple zone – note the tails appear to stab/clear demand as it advances at the beginning of the month). In terms of the weekly timeframe, support does not enter the field until 1.3047.
Areas of consideration:
Both higher-timeframe charts display intention to move lower for now, though a push south is only possible on H4 structure following a break of 1.31. In similar form to Monday’s report, a retest play to the underside of 1.31/August’s opening level at 1.3116 (H4 timeframe) is certainly something to keep an eye on, though a strict (initial) target objective should be set at H4 support drawn from 1.3043. Note 1.3043 not only represents a 50.0% support value, it also is also positioned just beneath weekly support mentioned above at 1.3047. For folks looking for an additional safety net here, consider waiting for a H4 bearish candlestick formation to take shape at the retest of 1.31. This not only provides a level to enter from as well as stop-loss placement, it also displays seller intent.
Today’s data points: MPC member Vlieghe speaks; US CB consumer confidence.
AUD/USD:
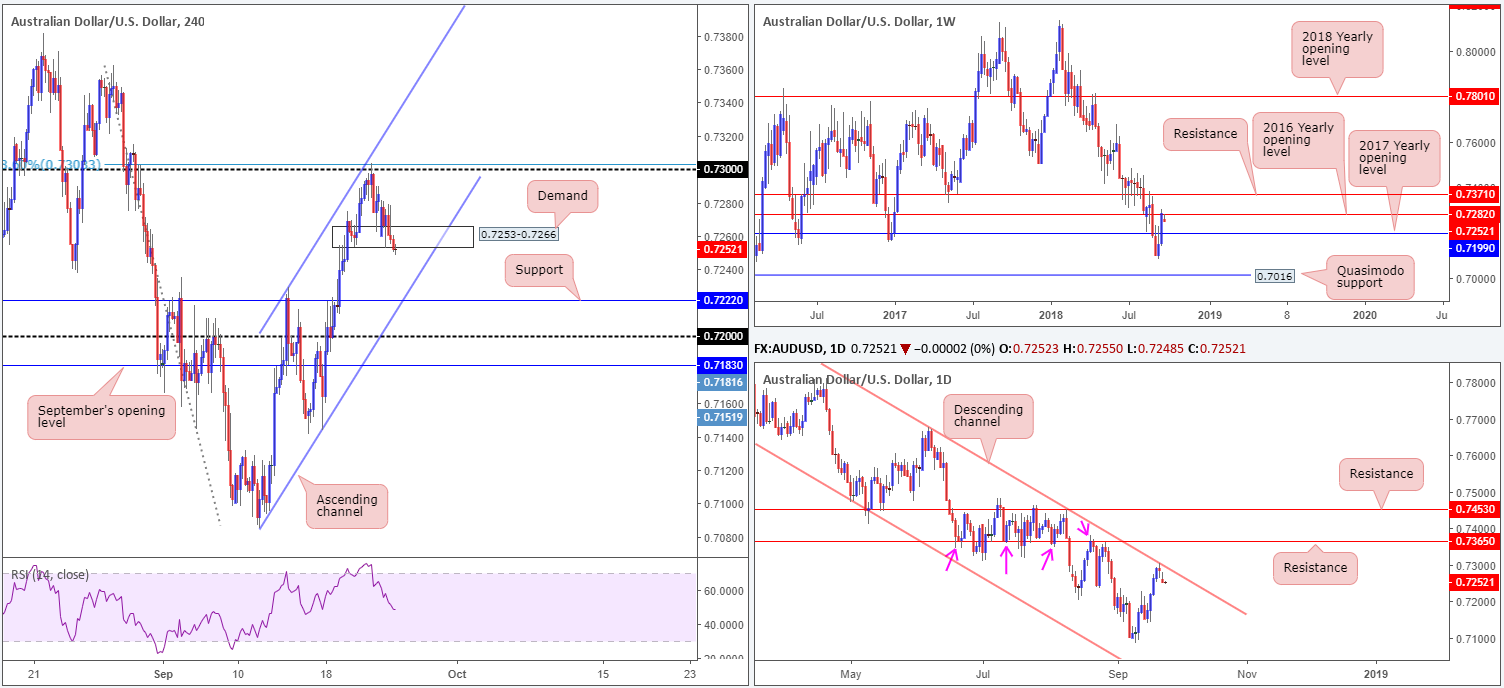
Unable to shake off renewed global trade jitters after China formally declined to resume official talks with the US ahead of the latest batch of import tariffs, the commodity currency wrapped up Monday’s session in the red. The AUD/USD rate fell below a key H4 demand at 0.7253-0.7266 in recent hours, as the US dollar’s resilience to the downside was reconfirmed yesterday after rejecting familiar lows around 93.80ish.
What’s more, key resistance is clearly in play on the weekly timeframe at 0.7282: the 2016 yearly opening level. Alongside this, traders may also want to acknowledge daily price fading a long-term channel resistance (penciled in from the high of 0.8135). Technically speaking, this is enough to encourage further downside in this market today, targeting the H4 channel support (extended from the low 0.7085).
Areas of consideration
With the lower edge of the current H4 demand being tested, one can almost hear the snapping sound of stop-loss orders!
The only grumble about selling this market beneath the current H4 demand is space. Plenty of room is visible on the bigger picture, though traders are faced with nearby support on the H4 scale: the H4 channel support positioned 20 or so pips away and H4 support priced in at 0.7222. However, in light of where we’re coming from on the higher timeframes, there’s a good chance the H4 supports will eventually be taken out. Therefore, should the H4 candles print a close beneath the current demand and follow up with a retest in the shape of a bearish candlestick formation (stops should be positioned beyond this structure), a sell could be in order. Reducing risk to breakeven once/if price crosses beneath 0.7222 is an option.
Today’s data points: US CB consumer confidence.
USD/JPY:
Despite declining US equities, The USD/JPY built on recent gains during yesterday’s segment on the back of a stronger US dollar across the board. The DXY dropped to familiar lows of 93.80ish, though managed to recover in strong fashion.
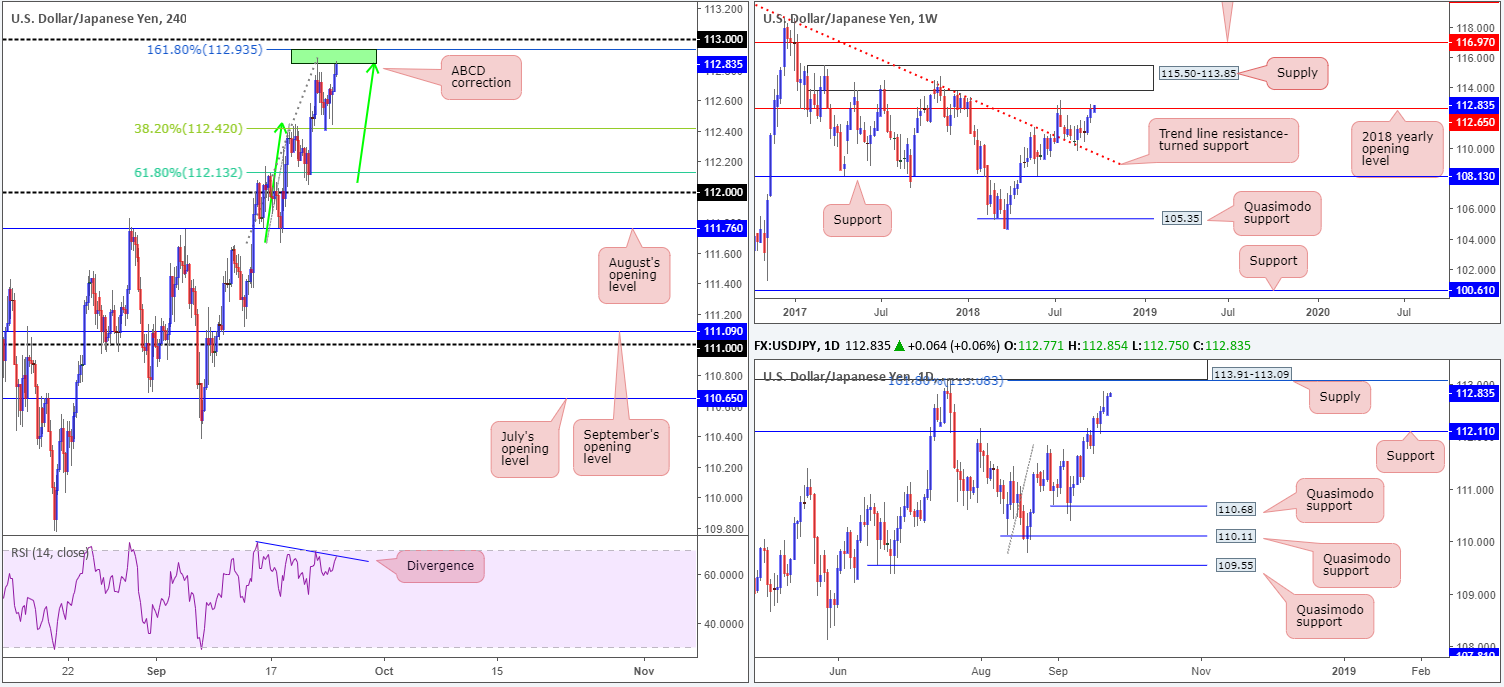
Weekly price is exploring ground above its 2018 yearly opening level at 112.65. In case the market witnesses additional upside from here, traders might want to pencil in supply drawn from 115.50-113.85 as the next upside target. On a similar note, continued buying on the daily timeframe has the supply zone set at 113.91-113.09 (merges with a 161.8% Fib ext. point at 113.08) in view (glued to the underside of the weekly supply).
A closer look at price action on the H4 scale forces the spotlight back on its ABCD correction (green arrows) point marked in green at 112.93/112.85. It’s unlikely price will respond from this region a second time, given the unit already achieved its initial take-profit target at the 38.2% Fib support value of 112.42. It may also be worth noting the RSI indicator remains loitering beneath its overbought value, and is also seen drawing up a strong divergence reading at the moment.
Areas of consideration:
The lower edge of daily supply at 113.09, along with its converging 161.8% Fib ext. point at 113.08 and the 113 handle on the H4 timeframe is of interest. Combined, the zone provides an area to work with today for potential short trades.
Due to the threat of further buying on the weekly timeframe beyond 112.65, waiting for H4 price to chalk up a bearish candlestick formation from 113.09/113 before pulling the trigger is recommended. Not only will this display seller intent, it’ll offer traders a level to enter from and a position to place stop-loss orders. As for take-profit targets, we would ultimately like to see the pair reach as far south as daily support at 112.11, followed closely by the 112 handle on the H4.
Today’s data points: US CB consumer confidence; BoJ Gov. Kuroda speaks.
USD/CAD:
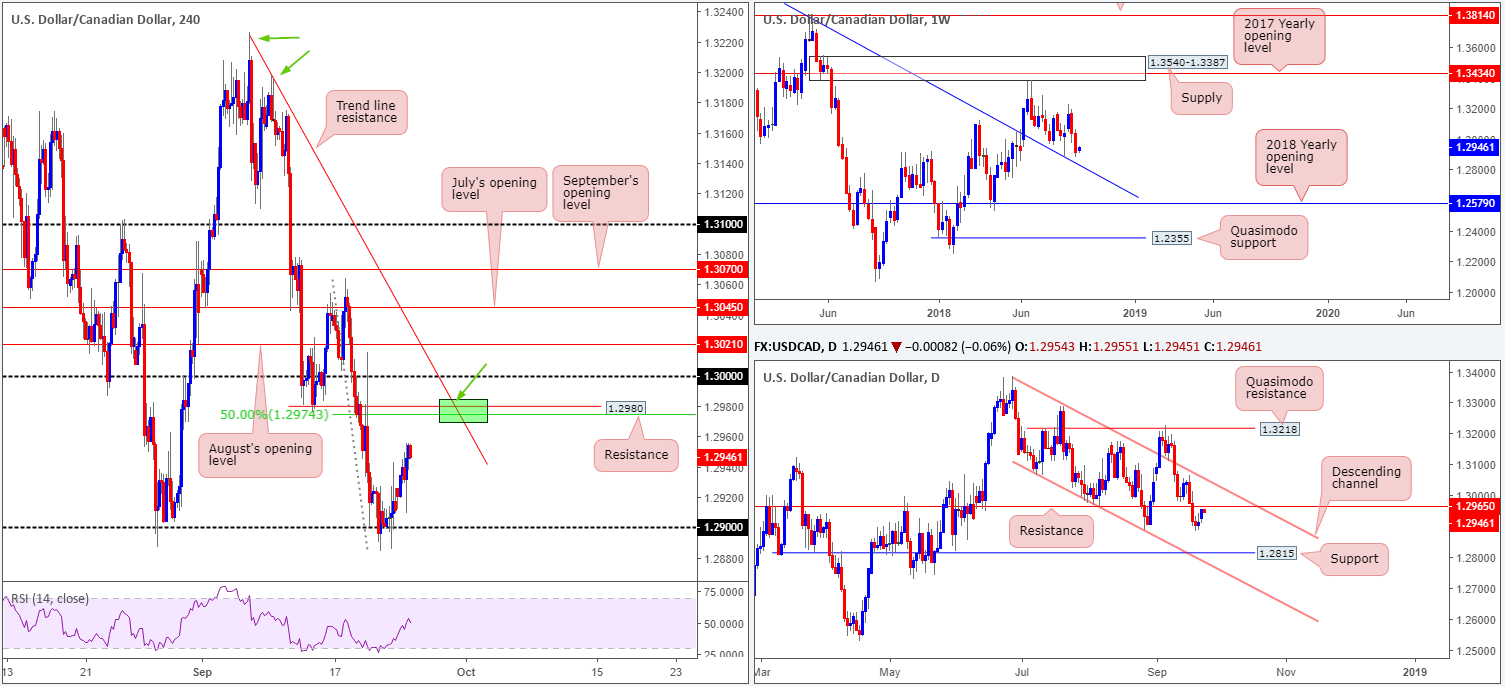
Broad-based DXY support kept the USD/CAD on the winning side of the table on Monday. After finding support off the 1.29 handle on the H4 amid Friday’s movement, yesterday saw the pair deliver a fresh move to highs of 1.2955.
As we head into Tuesday, traders will want to pencil in oncoming daily resistance at 1.2965. The level boasts a reasonably solid history, so a reaction off here should not really come as too much of a surprise. Also of particular interest is the H4 resistance seen at 1.2980 that fuses with a 50.0% resistance value at 1.2974 and a trend line resistance (etched from the high 1.3226).
As for weekly structure, two weeks of dominant selling in this market has brought the pair within reasonably close proximity to a trend line resistance-turned support (extended from the high 1.4689). This barrier supported price once already back in late August, so there’s a chance we may see history repeat itself.
Areas of consideration:
From an intraday perspective, traders are likely honing in on the H4 resistance mentioned above at 1.2980 today. An ideal scenario would be for H4 price to print a bearish pin-bar formation off this zone (stops can be positioned beyond this structure), closing beneath the nearby daily resistance level at 1.2965. This, by and of itself, would likely be enough to pull the pair back towards 1.29.
Waiting for a candlestick formation to prove seller intent off 1.2980 is required, in our view, due to the possibility of a move north being seen to the key figure 1.30.
Today’s data points: US CB consumer confidence.
USD/CHF:
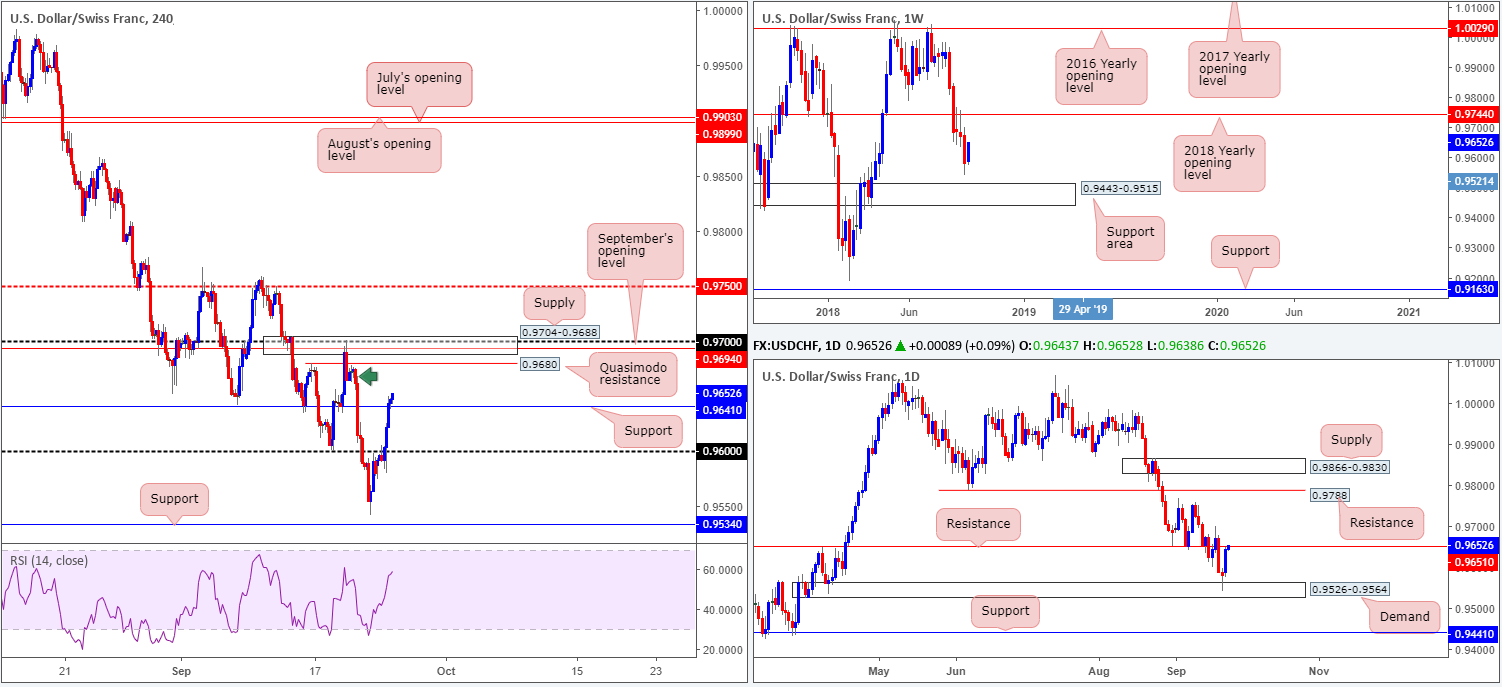
USD/CHF bulls went on the offensive on Monday, conquering the 0.96 handle on the H4 and wrapping up the day marginally closing above resistance at 0.9641 (now acting support). Overhead, we see supply marked with a green arrow at 0.9677-0.9663, with another layer of supply coming in at 0.9704-0.9688. The higher of the two supply zones is the more attractive, in our humble view, as it houses the 0.97 handle and September’s opening level at 0.9694 within, and is also positioned just north of a H4 Quasimodo resistance level at 0.9680.
In terms of where we stand on the higher timeframes, weekly price is trading mid-range between its 2018 yearly opening level at 0.9744 and a support area drawn from 0.9443-0.9515. Daily demand at 0.9526-0.9564, as you can see, is firmly in play right now, though so is the resistance level at 0.9651.
Areas of consideration:
On a wider perspective, weekly price suggests the pair could potentially swing either way, while daily action indicates a subtle bearish vibe at the moment.
Intraday focus remains on the H4 supply zone mentioned above at 0.9704-0.9688. The converging structure seen within its borders, and the nearby H4 Quasimodo resistance, is likely enough to produce a bounce. Stop-loss orders can be tucked above the area’s top edge around 0.9707ish, with the first take-profit target set at 0.9641: the noted H4 support level.
Today’s data points: US CB consumer confidence.
Dow Jones Industrial Average:
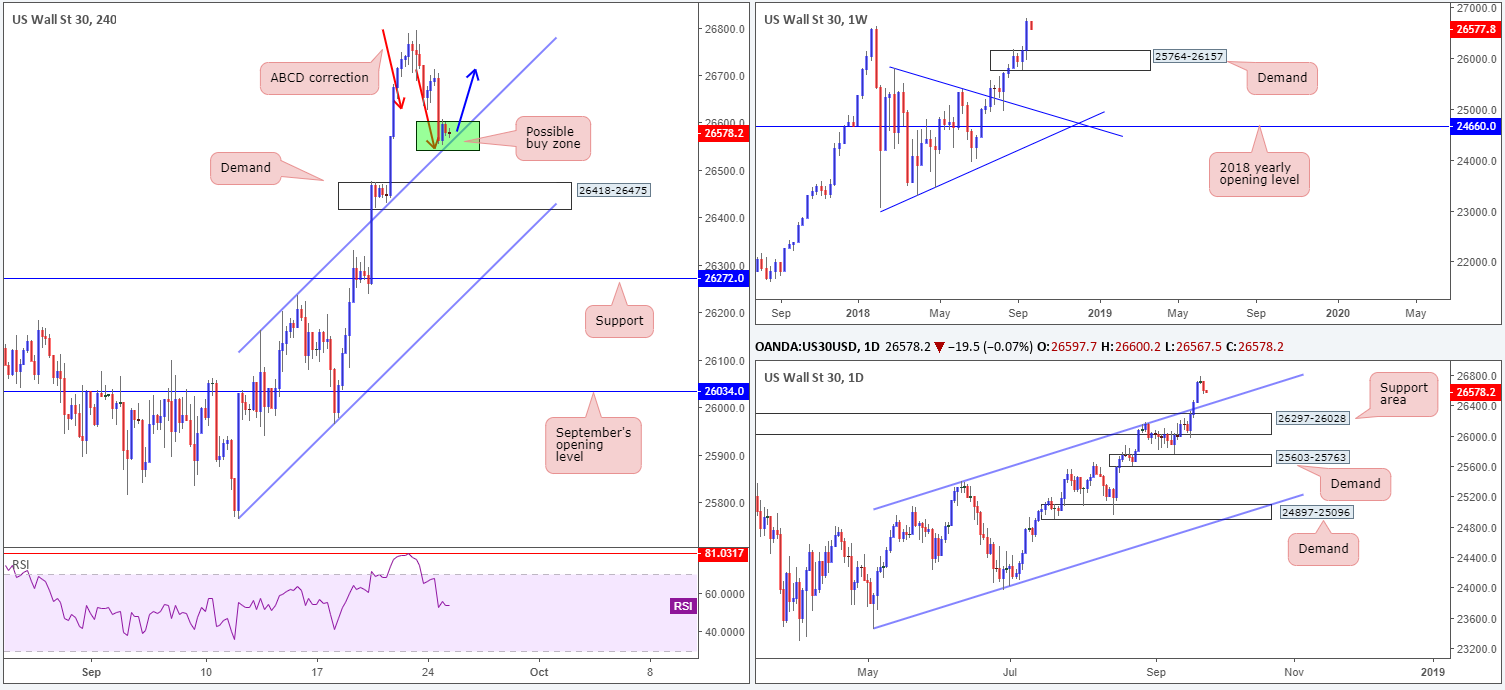
Wall Street concluded trade in the red on Monday, dragged lower by trade fears.
Coming off record highs of 26790, the H4 candles have retraced in the shape of an ABCD correction (red arrows) that terminates around the 26548 neighborhood. From a technical standpoint, additional support is seen nearby in the form of a channel resistance-turned support (extended from the high 23163). Failure to hold here will likely call for a move towards demand plotted at 26418-26475.
On the weekly timeframe, the index could potentially drop as far south as demand at 25764-26157 before signs of buying enter the fight. Turning the focus to the daily timeframe, however, the technicals still show the market could observe a pullback to the channel resistance-turned support (etched from the high 25385). A break of this barrier would likely lead to an approach towards the nearby support zone marked at 26297-26028.
Areas of consideration:
Given the market is seen trading at record highs, a pullback is likely to take shape prior to higher highs forming. For that reason, traders are urged to watch the current H4 channel resistance-turned support mentioned above for possible longs today, given the ABCD approach. A H4 bullish candlestick formation printed from here (stop-loss orders can be positioned beneath this structure) is, technically speaking, a high-probability signal to buy, targeting 26700 as the initial port of call, followed then (hopefully) by fresh highs.
Today’s data points: US CB consumer confidence.
XAU/USD (Gold)
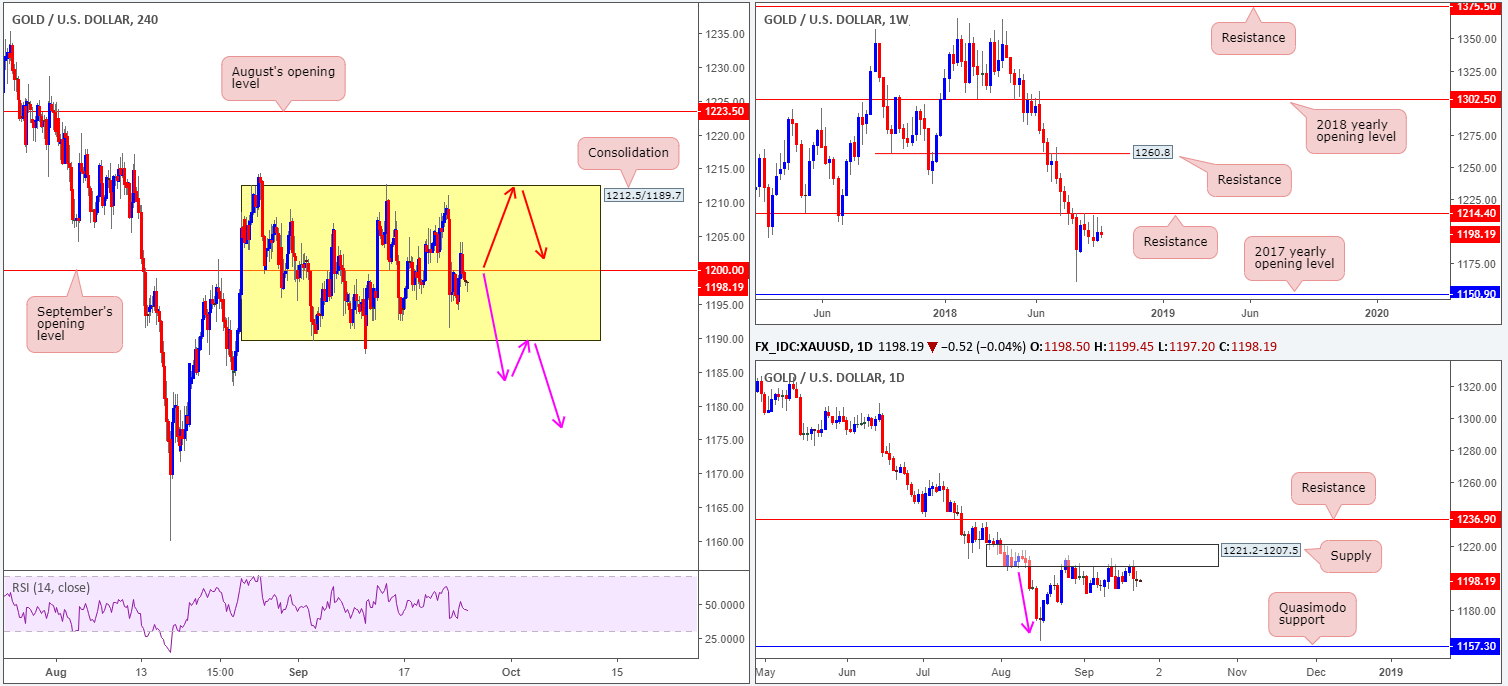
Gold prices are effectively unchanged this morning in terms of the metal’s technical environment.
As you can see on the weekly timeframe, price remains languishing beneath a key resistance level coming in at 1214.4 in the shape of back-to-back bearish pin-bar formations. Further downside from this point could eventually stretch as far south as the 2017 yearly opening level at 1150.9.
In conjunction with weekly flow, daily movement continues to respect the underside of a nice-looking supply zone at 1221.2-1207.5. Aside from the base displaying attractive downside momentum (see pink arrow), this area could also be considered the ‘decision point’ to print 2018 yearly lows of 1160.3. Couple this with the fact we are trading beneath weekly resistance, we still potentially have ourselves some strong sellers in the mix.
Fixed around the underside of the current daily supply zone, we can clearly see the H4 candles continue to carve out a range between 1212.5/1189.7 (houses September’s opening level at 1200.0). As we know from the higher timeframes, the general bias (according to structure that is) is pointing in a southerly direction. Therefore, a breakout of this range will likely be to the downside.
Areas of consideration:
On account of the above conditions, two possible scenarios are worth noting:
- The most obvious: a breakout of the current H4 range to the downside. Following a H4 close beneath this area, a retest to the underside is certainly something to keep an eye open for as sellers may look to make an appearance here (see pink arrows). Traders are advised to wait and see if H4 price prints a bearish candlestick formation at the retest before considering a position short, since this will help avoid falling victim to fakeouts.
- Fade the upper edge of the current H4 range (see red arrows). Like above, waiting for H4 price action to chalk up a bearish candlestick pattern off the top limit before pulling the trigger is recommended.
The use of the site is agreement that the site is for informational and educational purposes only and does not constitute advice in any form in the furtherance of any trade or trading decisions.
The accuracy, completeness and timeliness of the information contained on this site cannot be guaranteed. IC Markets does not warranty, guarantee or make any representations, or assume any liability with regard to financial results based on the use of the information in the site.
News, views, opinions, recommendations and other information obtained from sources outside of www.icmarkets.com.au, used in this site are believed to be reliable, but we cannot guarantee their accuracy or completeness. All such information is subject to change at any time without notice. IC Markets assumes no responsibility for the content of any linked site. The fact that such links may exist does not indicate approval or endorsement of any material contained on any linked site.
IC Markets is not liable for any harm caused by the transmission, through accessing the services or information on this site, of a computer virus, or other computer code or programming device that might be used to access, delete, damage, disable, disrupt or otherwise impede in any manner, the operation of the site or of any user’s software, hardware, data or property.


