
EUR/USD:
Over the course of Monday’s sessions, particularly throughout European hours, the euro surrendered ground to the US dollar (shook hands with its 96.00 mark once again amid risk aversion). Pressured by Italy’s budget situation and Brexit negotiations, price faded nearby H4 resistance plotted at 1.1542 and plowed through the 1.15 handle, which, as you can see, put up little to no fight.
According to our technical studies, longer term, the buyers potentially still have a hand in this fight. The weekly candles are seen cruising around the top edge of a demand at 1.1312-1.1445 and display room to extend as far north as a resistance area coming in at 1.1717-1.1862 (capped upside since early June 2018). In conjunction with weekly flow, daily support at 1.1462 (boasts notable history dating as far back as early 2015) is clearly a watched level on this timeframe at the moment. Although appearing fragile, scope for a rotation higher from here is still possible, targeting the 1.1621 October 16 high followed by resistance at 1.1723 (sited within the lower range of the noted weekly resistance area).
Areas of consideration:
H4 double-bottom support at 1.1432 is the next downside target visible on the H4 scale, trailed closely by demand priced in at 1.1394-1.1423.
A fakeout through the double-bottom support into the demand base by way of a H4 bullish pin-bar formation is attractive (see chart for a visual representation). Not only will this bring in buyers from demand, it’ll take stop-loss orders from those fading the double bottom and, therefore, provide liquidity to the market for longs (remember a stop-loss order from a buyer automatically becomes a sell once triggered).
In the event the above comes to fruition, entry/stop positioned according to the pin-bar structure is an option, targeting 1.15 as an initial take-profit zone.
Today’s data points: FOMC member Bostic speaks.

GBP/USD:
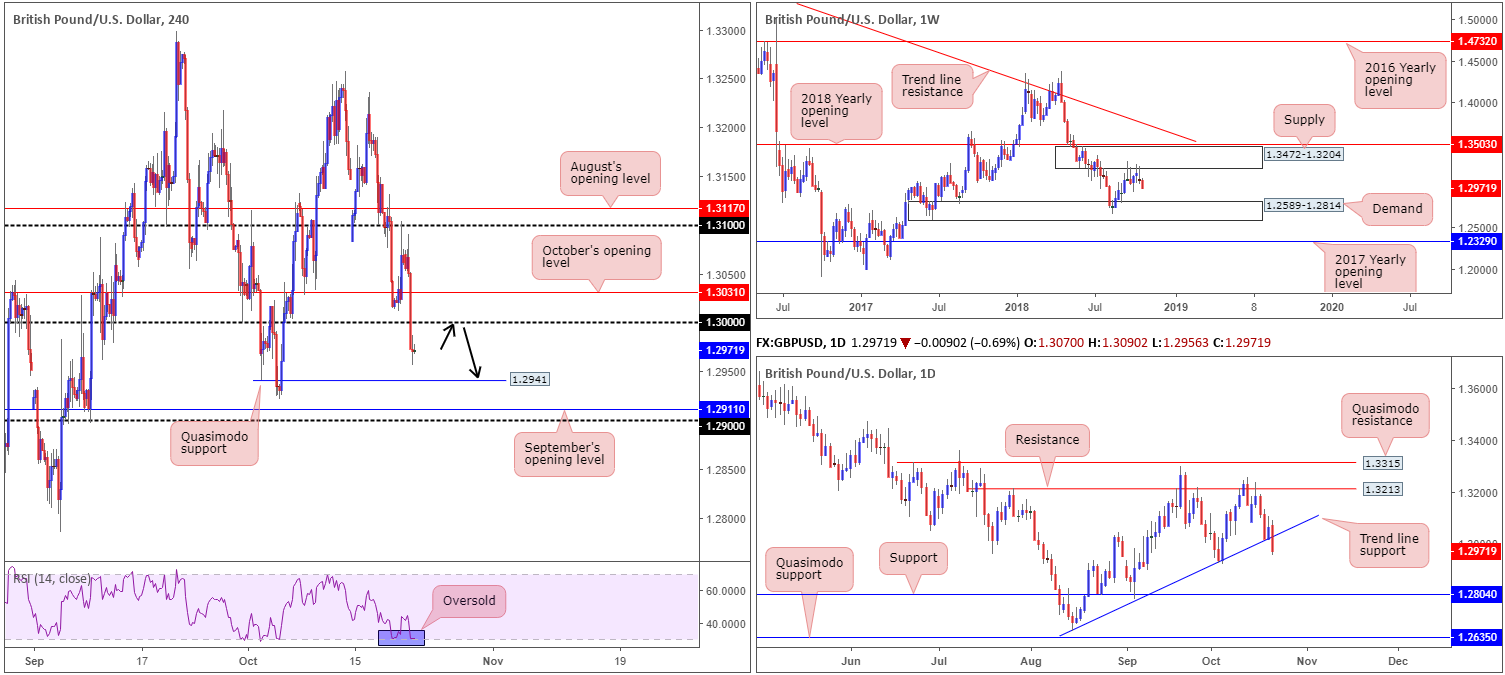
Ongoing Brexit uncertainty, on top of a potential extension to the transition period, undermined the British pound on Monday, consequently pressuring cable back under its 1.30 mark. In terms of H4 technicals, further downside may very well be in store with space seen to press lower towards Quasimodo support located at 1.2941, shadowed closely by September’s opening level at 1.2911 and then the 1.29 handle. It may also interest some traders the RSI is seen crossing swords with its oversold value.
Along the same vein, weekly price also echoes a somewhat bearish vibe from supply at 1.3472-1.3204, targeting demand at 1.2589-1.2814. In addition to this, the market also witnessed a firm break of daily trend line support (extended from the low 1.2661), with potential to drive as far south as support at 1.2804 (housed within the upper limit of weekly demand at 1.2589-1.2814).
Areas of consideraton:
Having seen all three timeframes strike a bearish tone, along with H4 price yet to touch base with its next key level of support: 1.2941, today’s spotlight will mostly be driven toward shorts.
A retest of 1.30 (black arrows) holding by way of a bearish candlestick formation from either H4 or H1 (stop/entry parameters can be applied according to the selected candlestick structure) is, given the overall technical picture, likely considered a high-probability selling opportunity. A key point to keep in mind is although the first take-profit targets are reasonably close on the H4 timeframe (1.2941/1.2911/1.29), as we expand to the higher timeframes, the ultimate take-profit target falls in at the top edge of weekly demand mentioned above at 1.2814. That’s nearly 200 pips from 1.30!
Today’s data points: MPC member Haldane; BoE Gov. Carney and FOMC member Bostic all scheduled to speak.
AUD/USD:
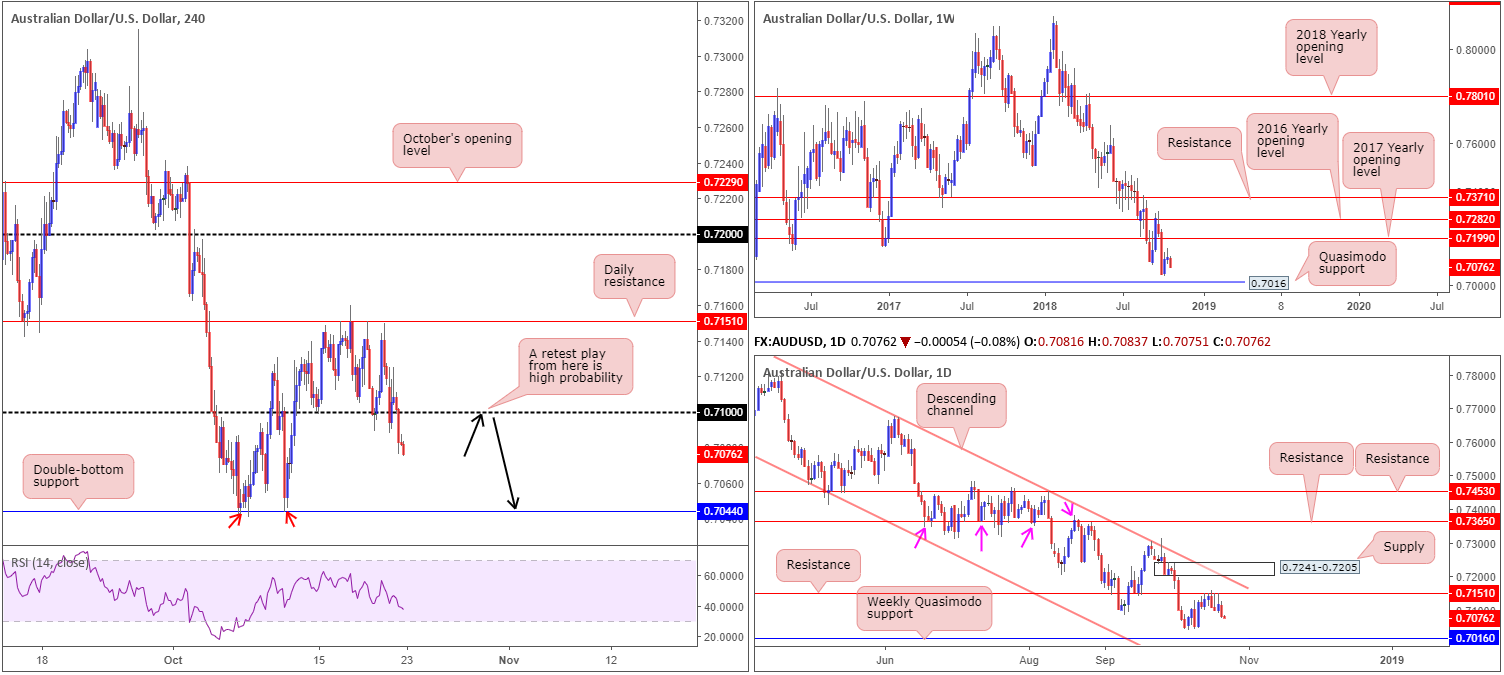
Despite an earnest attempt to reclaim 0.71+ status on Monday, the H4 candles fell flat around the 0.7125 neighbourhood. A combination of strong USD buying (DXY touching gloves with its 96.00 mark) and political concerns down under saw price firmly overthrow 0.71 and eventually clock lows of 0.7076 at the closing stages of the day.
For folks who read Monday’s briefing you may recall the team highlighted a possible break of 0.71 to the downside, targeting the H4 double-bottom support at 0.7044, followed by the next support target visible on the higher timeframes at 0.7016: a weekly Quasimodo support.
Areas of consideration:
Having seen price take out 0.71, traders are urged to place an alert at this number today in the event the H4 candles retest it as resistance (black arrows). A retest by means of a noteworthy bearish candlestick configuration (stop/entry levels typically decided from this structure) would, according to our technical studies, likely be sufficient enough to consider selling this market. As highlighted above, the first area of concern from this point falls in around 0.7044, followed then by the weekly Quasimodo support at 0.7016 as the ultimate downside objective.
Today’s data points: RBA Assist Gov. Bullock, RBA Assist Gov. Debelle and FOMC member Bostic all scheduled to speak.
USD/JPY:
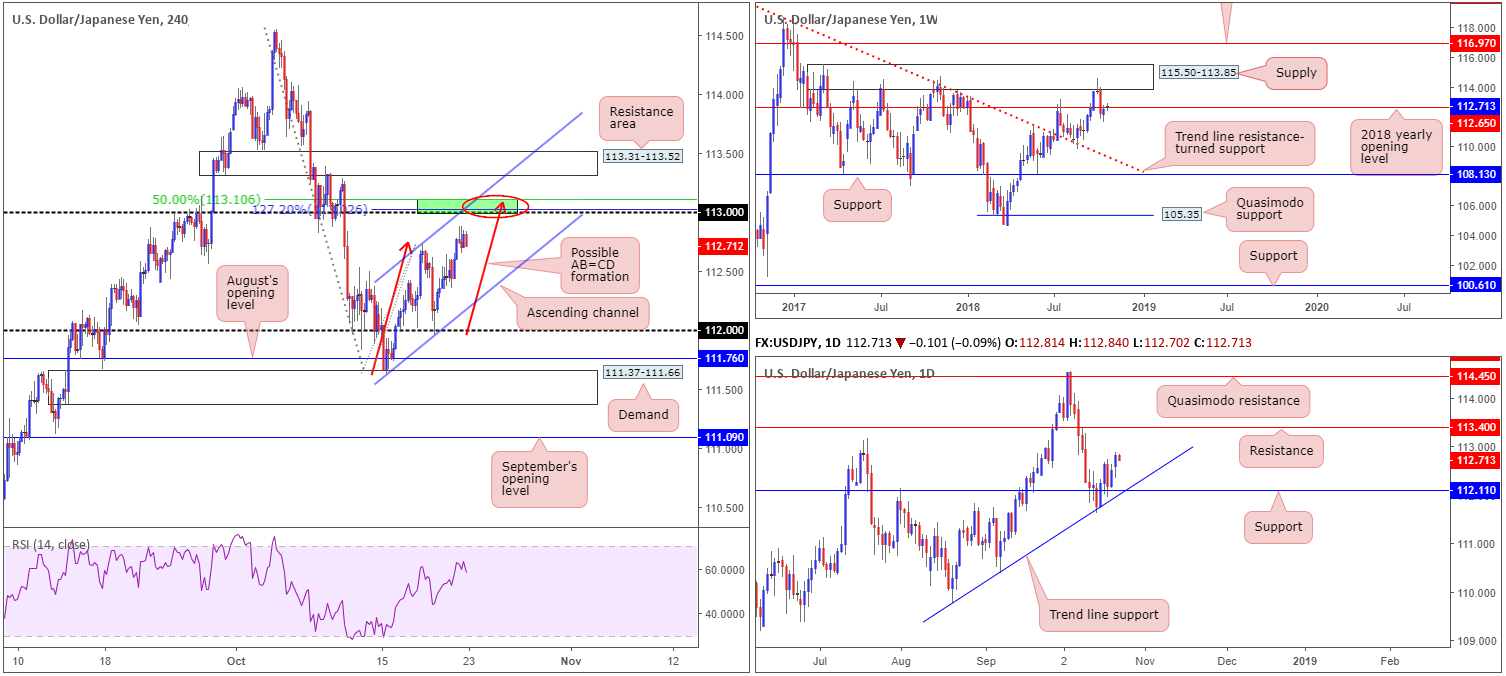
In recent trading, USD/JPY bulls went on the offensive, consequently bringing the fight to the 2018 yearly opening level at 112.65. In spite of this barrier’s higher-timeframe qualification, both H4 and daily movement exhibit potential for higher ground.
As can be seen on the H4 timeframe, the candles are in the process of completing a possible AB=CD (red arrows) 127.2% (Fib ext. point) bearish pattern just north of 113. Reinforcing this region is a 50.0% resistance value parked at 113.10 as well as a local channel resistance (etched from the high 112.73). Another key thing to note on this scale is the RSI indicator is seen fast approaching its overbought value. Against the backdrop of this, however, daily flow also appears capable of eventually pushing as far north as resistance coming in at 113.40, following last week’s firm rebound off support priced in at 112.11.
Areas of consideration:
Having seen space for weekly price to maneuver above its 2018 yearly opening level towards supply at 115.50-113.85, along with daily price eyeing upwards of 113 (113.40), as highlighted above, shorting the H4 AB=CD pattern evidently brings with it some red flags.
Given the higher-timeframe picture, only a bounce should be expected from 113. Traders are, assuming price tops around 113, urged to consider locking in partial profits and reducing risk to breakeven at the 38.2% Fib support taken from the A leg (the 111.65 October 15 low) and the D leg (if price respects the AB=CD formation, the high from here is the D point). Stops are generally positioned a few pips above the AB=CD completion pattern (red arrows), beyond the 113.09ish mark in this case.
Today’s data points: FOMC member Bostic speaks.
USD/CAD:
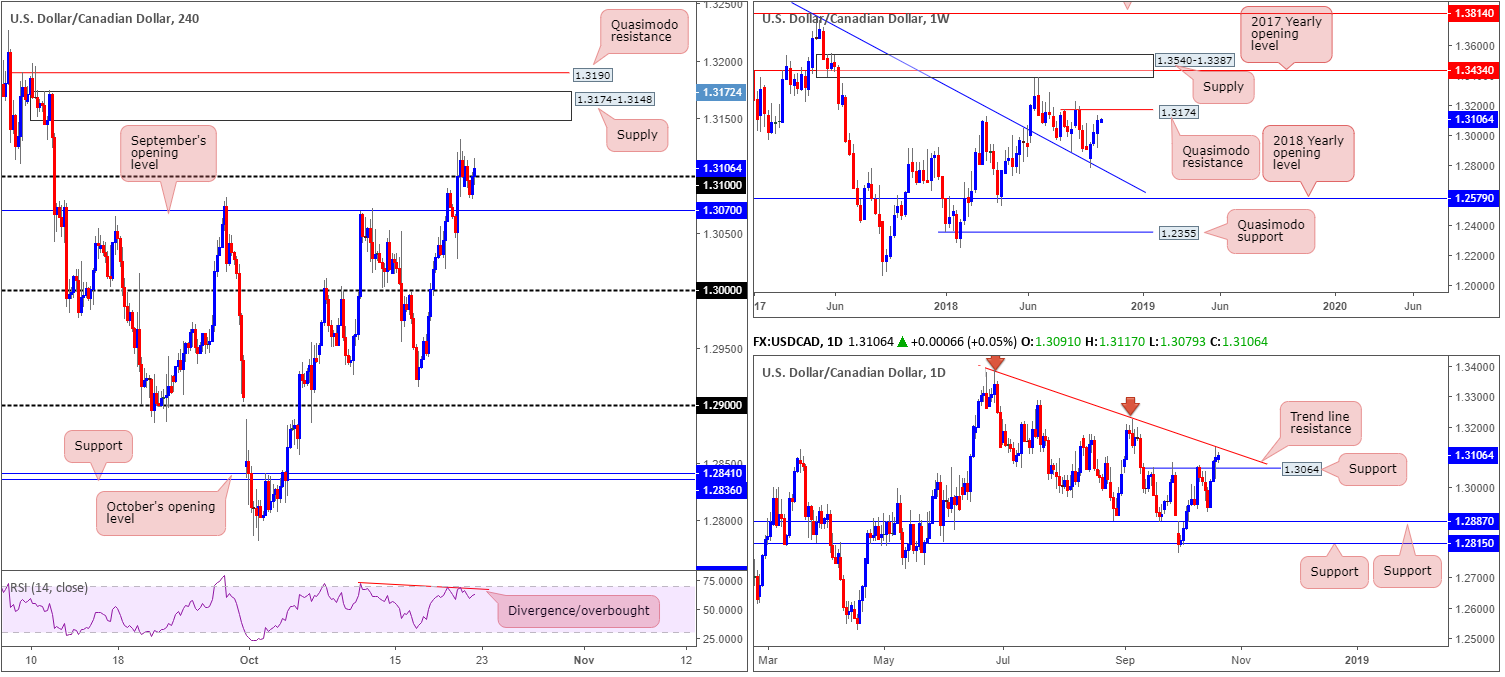
Despite the US dollar index (DXY) crossing swords with its 96.00 mark and a disappointing Canadian wholesale sales reading, the USD/CAD, for the best part of the day, contained price movement sub 1.31 on the H4 timeframe. It might also be worth noting the RSI indicator on this scale is still chalking up a divergence signal around its overbought value.
Although the pair enjoyed a third consecutive week in the green last week since rebounding off the weekly trend line resistance-turned support (stretched from the high 1.4689), market action may witness price level off as the unit approaches Quasimodo resistance at 1.3174. Another factor worth bearing in mind is the daily timeframe. Resistance-turned support at 1.3064 entered play on Friday, though has so far failed to generate much follow through as sellers made an appearance from neighbouring trend line resistance (etched from the high 1.3386). A break of the trend line will need to be seen before weekly traders reach the aforementioned Quasimodo resistance level.
Should H4 traders eventually conquer 1.31 to the upside, supply at 1.3174-1.3148 is the next area in the offing. Note the top edge of this area skirts the aforementioned weekly Quasimodo resistance level. A firm push beneath 1.31, nonetheless, has September’s opening level in sight at 1.3070.
Areas of consideration:
A lot of pain is clearly visible around 1.31 at the moment, both from traders who attempted to fade the underside of the number and for those who bought the breakout.
Initially, Monday’s briefing looked at the possibility of intraday longs above 1.31. As of current price, however, the focus is on the H4 supply zone mentioned above at 1.3174-1.3148 and its neighbouring H4 Quasimodo resistance at 1.3190 for possible shorting opportunities. Recall, not only do we have a weekly Quasimodo resistance mentioned above at 1.3174 intersecting with the top edge of the H4 supply, there’s also a daily trend line resistance in view as well!
Irrespective of whether one selects the H4 supply to sell or the H4 Quasimodo, stop-loss order placement above the apex of the H4 Quasimodo (1.3198) is a feasible option, according to higher-timeframe structure. In terms of take-profit targets, the 1.31 handle is the logical first step, as far as we can see.
Today’s data points: FOMC member Bostic speaks.
USD/CHF:
USD/CHF movement was seen showing some resilience vs. a recovering greenback in recent trade, leading to a somewhat sedated session on Monday. With this being the case, much of the following report will echo thoughts expressed in Monday’s briefing.
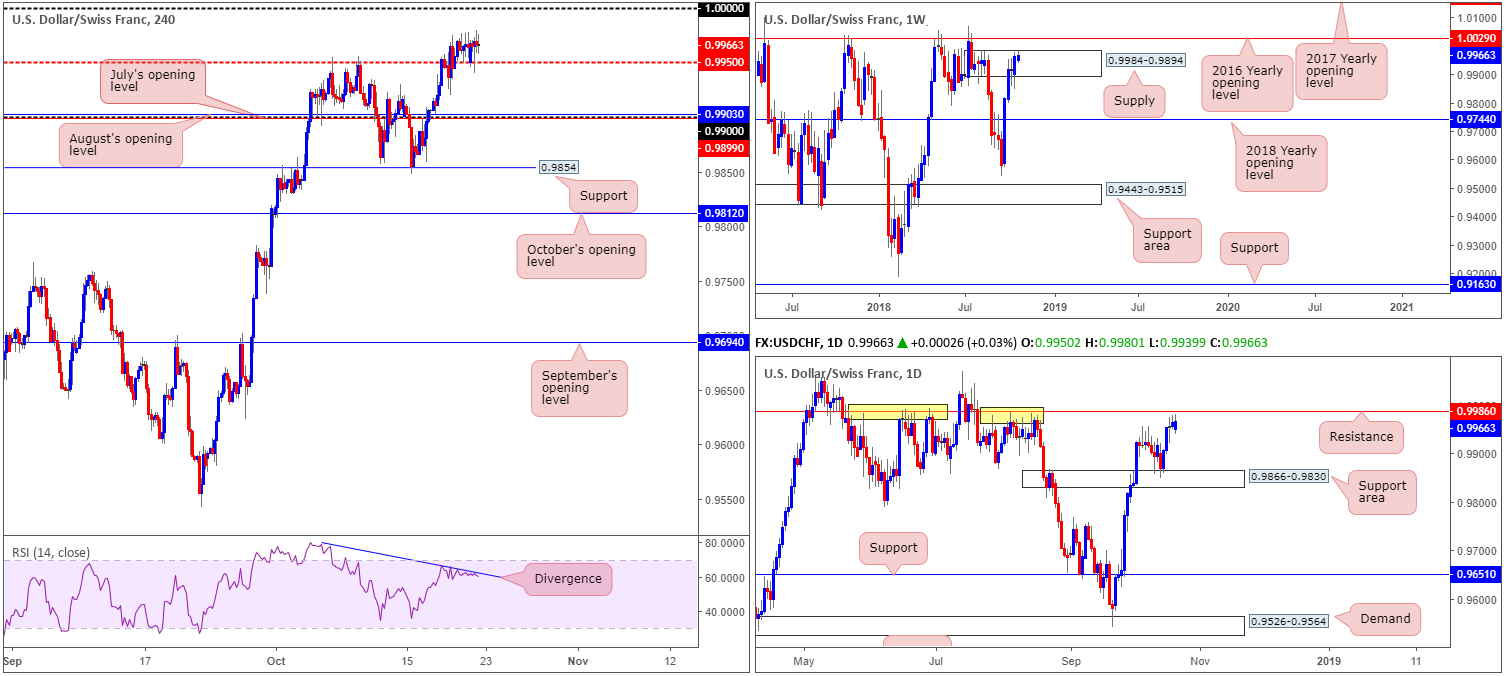
The key observation on the weekly timeframe is the recent push into supply at 0.9984-0.9894 in the shape of a bullish engulfing formation. Judging by the recent candle close and lack of selling interest over the past weeks, traders may want to pencil in the 2016 yearly opening level at 1.0029 in the event we push for higher ground this week. Daily action, nevertheless, is seen fast approaching resistance plotted two pips beyond the current weekly supply at 0.9986. Overlooking this level would be a mistake! Check out its recent history holding price action lower (yellow points) – it’s impressive!
Of late, the H4 candles found a floor of support off its 0.9950 point, with parity (1.0000) firmly in sight as the next upside target on this timeframe. Traders may also want to acknowledge the H4 RSI indicator is still displaying bearish divergence.
Areas of consideration:
Based on the above reading, shorts from daily resistance at 0.9986 remains an option, with conservative stop-loss orders positioned above the 2016 yearly opening level at 1.0029 on the weekly timeframe. This helps clear any fakeout play around 1.0000, which, as most are already aware, is common viewing around psychological numbers.
In terms of downside targets from here, 0.9950 appears a logical first step, followed by the 0.99 handle. From 0.9986 to 0.99 (assuming stops are placed above 1.0029) is reasonable a 1:2 risk/reward ratio.
Today’s data points: FOMC member Bostic speaks.
Dow Jones Industrial Average:
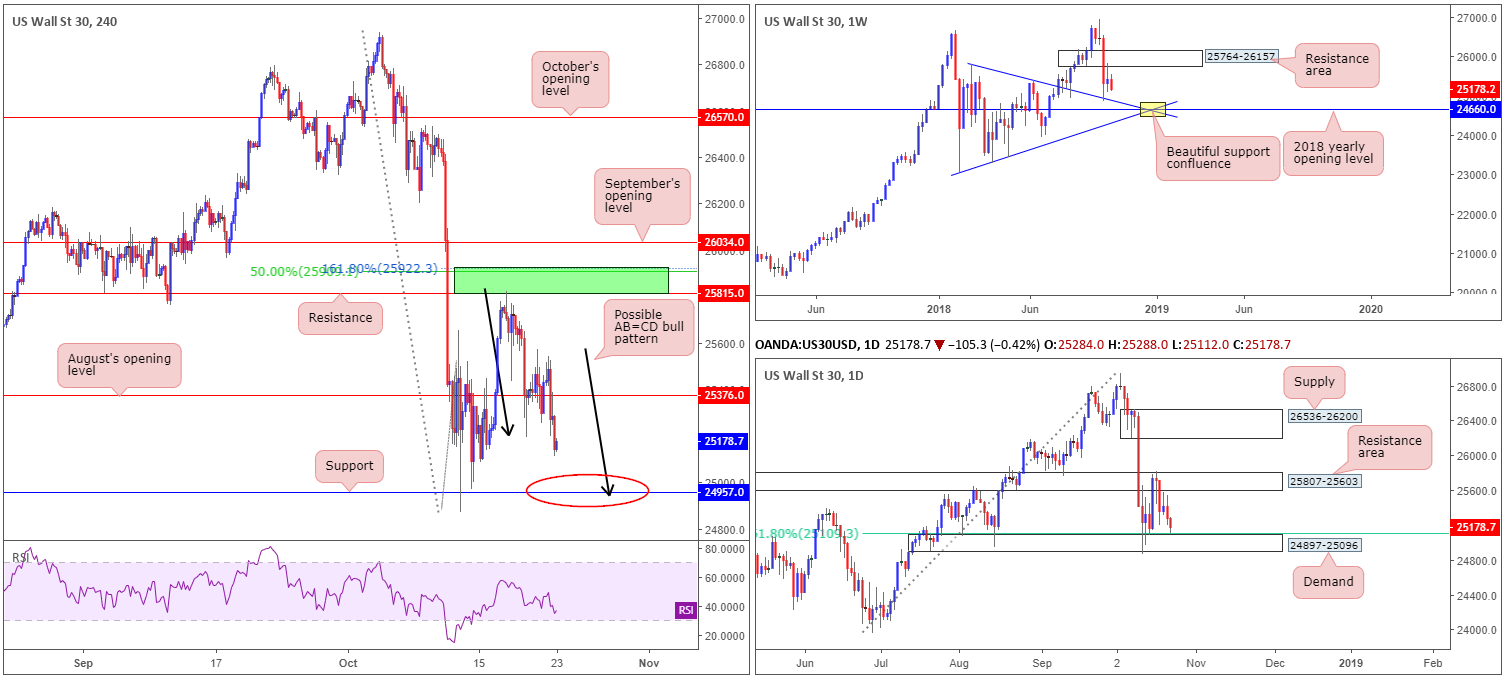
US equities began the week on a strong footing, holding firmly above August’s opening level at 25376 on the H4 timeframe. Sentiment, however, turned sour in US hours. Reclaiming 25376 to the downside, the H4 candles concluded Monday’s session down 0.51%. A few points beyond here, traders are likely honing in on H4 support at 24957, which happens to merge with a H4 AB=CD completion point (black arrows).
In terms of where the market stands on the bigger picture, weekly movement appears poised to retest trend line resistance-turned support (taken from the high 25807). A particularly interesting area to keep noted on this timeframe is the point at which two trend lines intersect (25807/23055 yellow) with the 2018 yearly opening at 24660. The support confluence here is mouthwatering. A closer look at price action on the daily timeframe points the spotlight towards a demand area coming in at 24897-25096 (closely intersects with a 61.8% Fib support at 25109).
Areas of consideration:
Keeping it simple this morning, the H4 support mentioned above at 24957 is a notable level to have in sight today for possible longs. Not only do we have H4 AB=CD convergence, the level is positioned within the upper limits of daily demand at 24897-25096.
Stop-loss placement, according to structure, is best placed under the current daily demand base (24897). For conservative traders, nevertheless, waiting for additional H4 candlestick confirmation to form off 24957 is an option (stop/entry levels typically decided from this structure).
Today’s data points: FOMC member Bostic speaks.
XAU/USD (Gold)
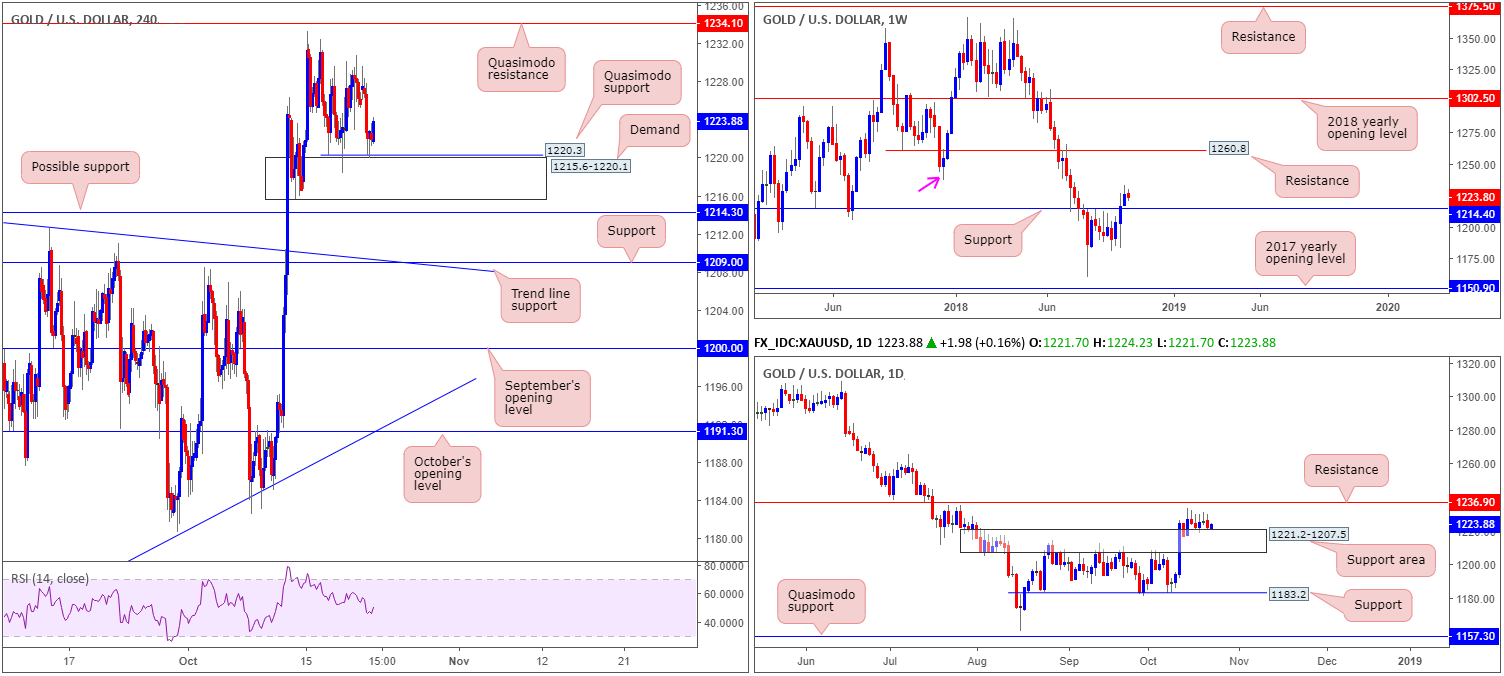
For those who read Monday’s briefing you may recall the piece underscored a H4 Quasimodo support located at 1220.3 as a possible buy zone. Well done to any of our readers who took advantage of this move. Fortunately, for conservative traders, additional candlestick confirmation also took shape from here yesterday: a H4 bullish pin-bar pattern.
The first take-profit target from this point falls in around the 1230.8 October 19 high, shadowed closely by H4 Quasimodo resistance at 1234.1.
The reason for selecting the aforementioned H4 Quasimodo support came down to the following points:
- Reinforced by nearby H4 demand at 1215.6-1220.1.
- Daily support area at 1221.2-1207.5 bolsters H4 structure.
- After marginally engulfing a key weekly resistance at 1214.4 (now acting support), space to press higher is seen towards weekly swing resistance at 1236.6 (pink arrow – essentially represents daily resistance at 1236.9 [the next upside target on the daily scale]).
Areas of consideration:
Aside from the H4 Quasimodo support level at 1220.3, we do not see much else to hang our hat on in terms of high-probably trading opportunities.
Should H4 price pullback and retest 1220.3/H4 demand at 1215.6-1220.1, however, this could represent a second opportunity to search for an entry long (a H4 bullish candlestick formation printed from here would be ideal – stop/entry parameters can be set according to the selected candle pattern).
The use of the site is agreement that the site is for informational and educational purposes only and does not constitute advice in any form in the furtherance of any trade or trading decisions.
The accuracy, completeness and timeliness of the information contained on this site cannot be guaranteed. IC Markets does not warranty, guarantee or make any representations, or assume any liability with regard to financial results based on the use of the information in the site.
News, views, opinions, recommendations and other information obtained from sources outside of www.icmarkets.com.au, used in this site are believed to be reliable, but we cannot guarantee their accuracy or completeness. All such information is subject to change at any time without notice. IC Markets assumes no responsibility for the content of any linked site. The fact that such links may exist does not indicate approval or endorsement of any material contained on any linked site.
IC Markets is not liable for any harm caused by the transmission, through accessing the services or information on this site, of a computer virus, or other computer code or programming device that might be used to access, delete, damage, disable, disrupt or otherwise impede in any manner, the operation of the site or of any user’s software, hardware, data or property.


