
A note on lower timeframe confirming price action…
Waiting for lower timeframe confirmation is our main tool to confirm strength within higher timeframe zones, and has really been the key to our trading success. It takes a little time to understand the subtle nuances, however, as each trade is never the same, but once you master the rhythm so to speak, you will be saved from countless unnecessary losing trades. The following is a list of what we look for:
- A break/retest of supply or demand dependent on which way you’re trading.
- A trendline break/retest. Buying/selling tails – essentially we look for a cluster of very obvious spikes off of lower timeframe support and resistance levels within the higher timeframe zone.
- Candlestick patterns. We tend to only stick with pin bars and engulfing bars as these have proven to be the most effective.
For us, lower timeframe confirmation starts on the M15 and finishes up on the H1, since most of our higher timeframe areas begin with the H4. Stops usually placed 5-10 pips beyond your confirming structures.
EUR/USD:
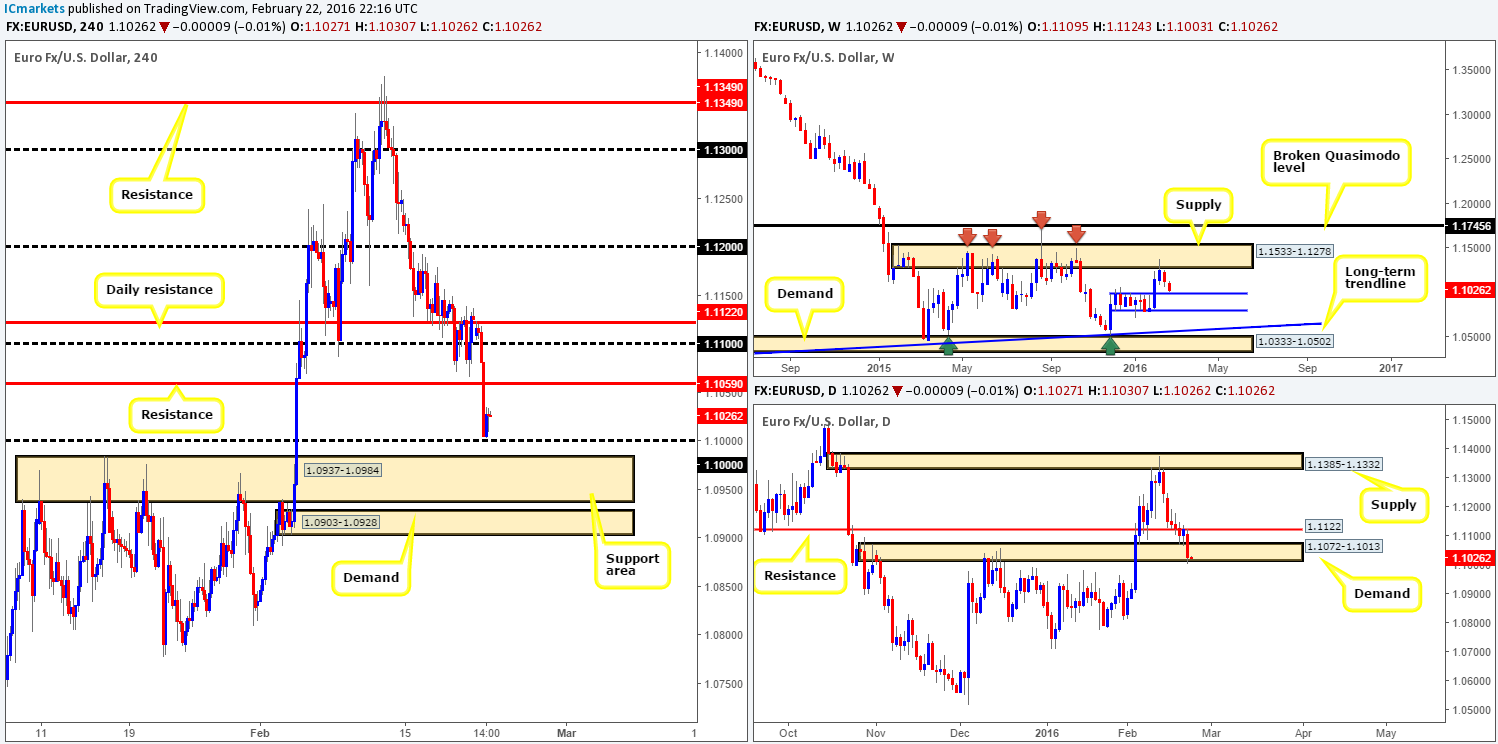
Sunday’s open 1.1109 saw the single currency gap around 17 pips lower, consequently breaking below daily support at 1.1122. Following this, price struck the underside of this number twice before heavily selling-off going into yesterday’s London open. H4 support (now acting resistance) at 1.1059 put up very little fight, allowing price to reclaim the 1.1000 region by the day’s end.
This recent selling also saw price come close to connecting with weekly support at 1.0983, whilst daily action saw demand at 1.1072-1.1013 suffer a slight break. Ultimately, we feel the EUR will correct itself soon, but where and when is difficult to tell right now.
On the one hand, stops have likely been triggered below daily demand thus giving pro money liquidity to buy, so should price eventually test 1.1000 today, this could be a sound platform in which to be looking to buy from. On the other hand, weekly flow shows room to move a little lower down to support at 1.0983, thus price could fake stops below 1.1000 and trade into the H4 support area at 1.0937-1.0984 before the buyers make an appearance. In addition to this, we also like the look of the impressive H4 demand drawn from 1.0903-1.0928.
Given the points made above, our plan of attack will be simple today – watch for (lower timeframe) confirmed buying opportunities from both 1.1000 and the H4 support area at 1.0937-1.0984 (here, however, one should be prepared for a fakeout lower to the H4 demand mentioned above at 1.0903-1.0928).
Levels to watch/live orders:
- Buys: 1.1000 [Tentative – confirmation required] (Stop loss: dependent on where one confirms this level) 1.0937-1.0984 [Tentative – confirmation required] (Stop loss: dependent on where one confirms this area).
- Sells: Flat (Stop loss: N/A).
GBP/USD:
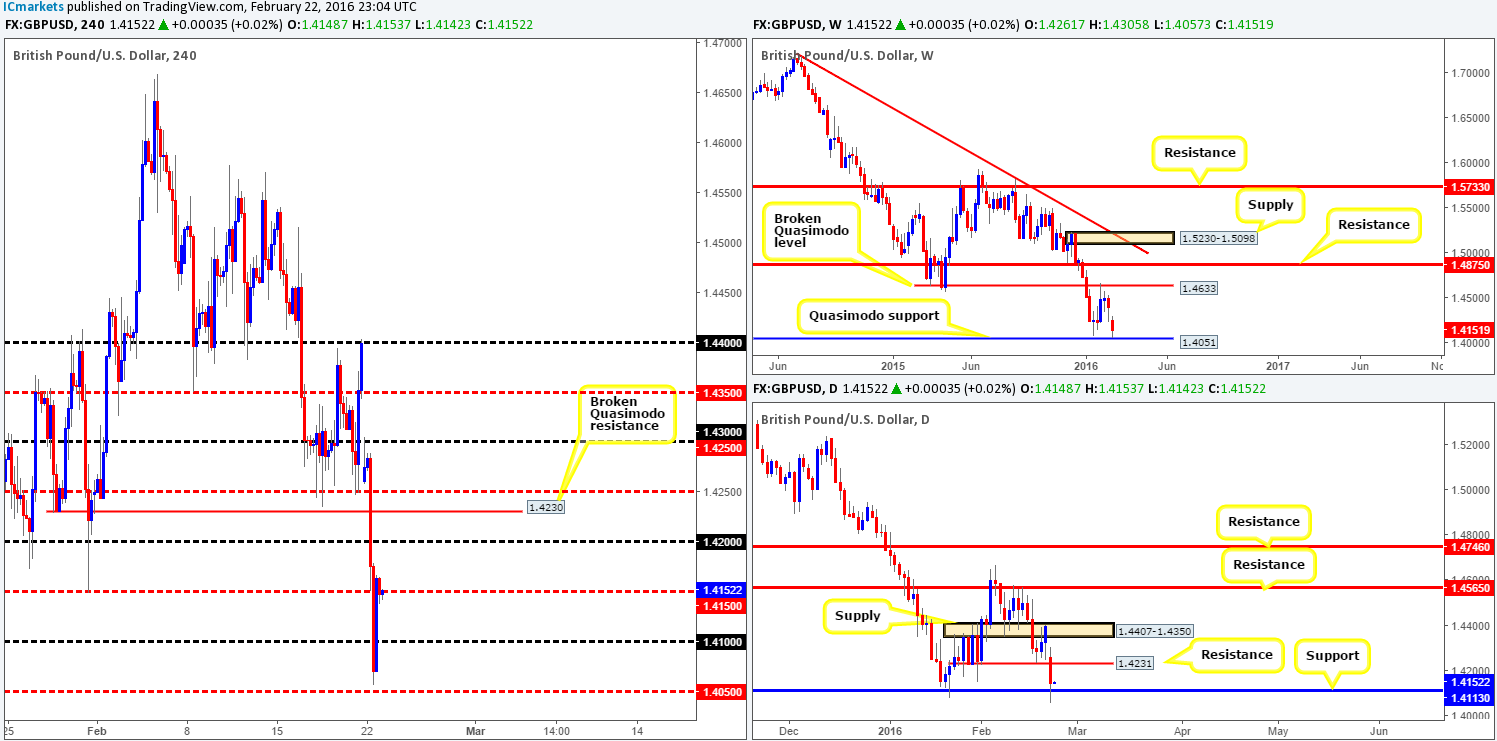
Cable certainly began the week with a bang! The open 1.4261 saw the currency drop around 140 pips right off the bat, which, as you can see, found resistance from the underside of the psychological number 1.4300. However, the bloodbath continued as Europe and London opened their doors for business, consequently driving the pair a further 200 pips lower, ending with price aggressively whipsawing through psychological support 1.4100 and closing the day at 1.4148.
In light of price now teasing the mid-level barrier 1.4150, where do we go from here? Well, up on the weekly chart, price came within six pips of connecting with a Quasimodo support penciled in at 1.4051, and at the same time, daily action was seen shaking hands with support chalked up at 1.4113. Therefore, as far as structure is concerned, buying could be on the horizon today, which unfortunately would mean going up against the predominant trend.
This pair is likely to be a tricky beast to trade today due to the political situation in the U.K. and as market participants divulge recent movement. As such, even though structure is telling us to look for buys, we’re going to humbly sideline this pair for the time being.
Levels to watch/live orders:
- Buys: Flat (Stop loss: N/A).
- Sells: Flat (Stop loss: N/A).
AUD/USD:
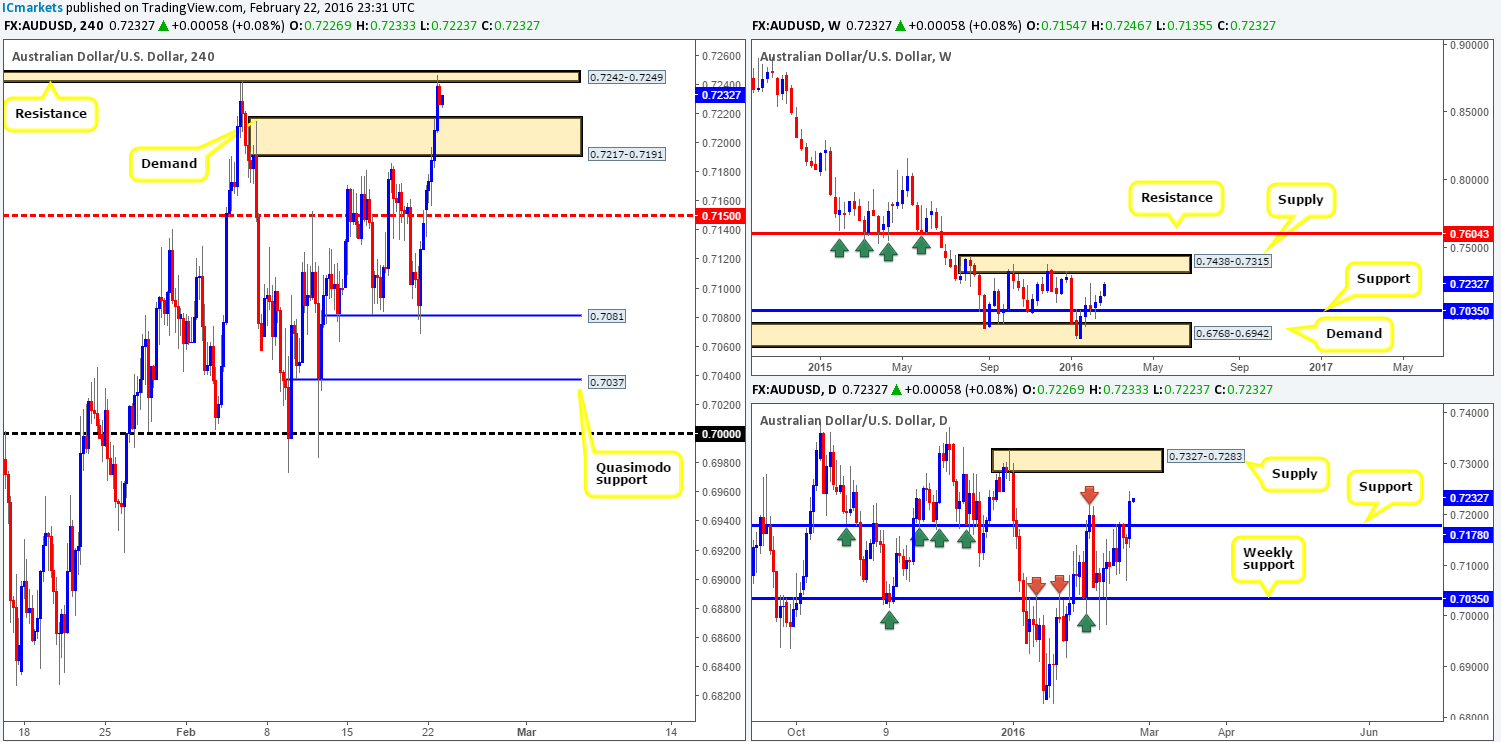
Unlike the EUR and GBP, the Aussie performed beautifully yesterday as investors clearly favor more risky assets at present. This recent bullish assault, as you can see, took out H4 supply (now acting demand) at 0.7217-0.7191, forcing the commodity currency to stab into a small H4 resistance area at 0.7242-0.7249 by the day’s close.
As far as the weekly chart is concerned we see little stopping this pair from rallying higher, at least up until supply drawn from 0.7438-0.7315. By the same token, daily flow recently blasted through resistance (now acting support) at 0.7178, allowing price the freedom to advance up to supply coming in at 0.7327-0.7283 (glued to the underside of the aforementioned weekly supply).
On account of the above, our team will be looking for confirmed longs within H4 demand at 0.7217-0.7191 today on the assumption that the majority of offers are consumed within the small H4 resistance area at 0.7242-0.7249. In the event that this trade comes to fruition, we’d look to take partial profits around the 0.7239 mark and allow the rest to run up to the underside of daily supply at 0.7283.
Levels to watch/live orders:
- Buys: 0.7217-0.7191 [Tentative – confirmation required] (Stop loss: dependent on where one confirms this area).
- Sells: Flat (Stop loss: N/A).
USD/JPY:
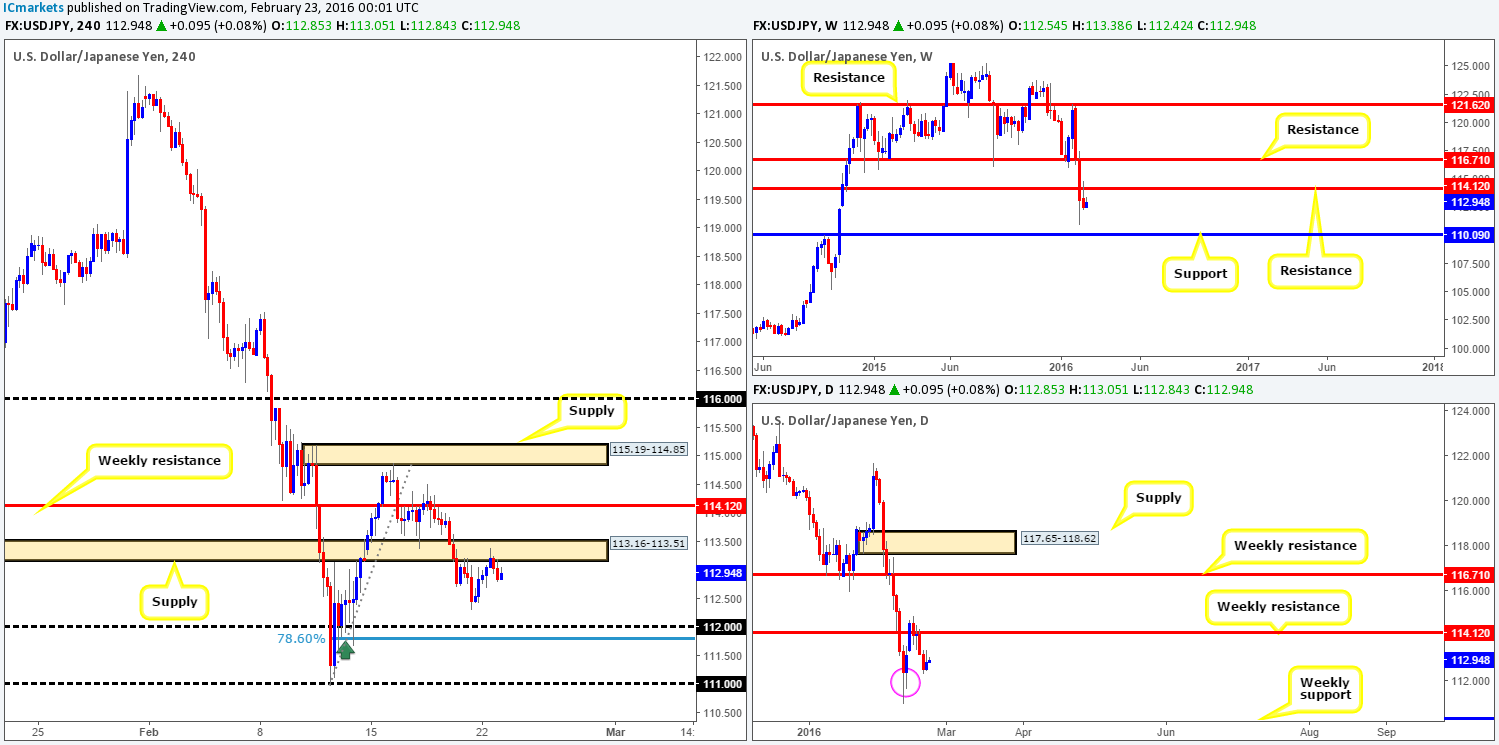
Starting from the top this morning, the 114.12 weekly level was, as you can see, retested as resistance last week, suggesting further downside is possible to 110.09 – a long-term weekly support. Turning our attention to the daily chart, there appears to be active buyers formulating around the February12th open 112.40 (circled in pink), which could potentially push prices back up to the aforementioned weekly resistance before lower prices are seen.
Moving down to the H4 chart, however, we can see that price is currently trading from supply painted between 113.16-113.51 at the moment. Entering short from this base would be a promising trade for us if we did not see active buyers grouping together on the daily chart (see above). That being the case, here is our two pips’ worth on where this market may head today and possibly into the week:
- A break above the current H4 supply would likely signal price is headed back up to the weekly resistance barrier, which, dependent on how the lower timeframes reacted here, is somewhere we’d be interested in looking to short from.
- Looking down to the 112.00 figure, we see a possible bounce taking place from here. Not only is it bolstered by a deep 78.6% Fibonacci level at 111.77, but it also boasts a collection of very obvious buying tails marked with a dark green arrow. This, at least to us, suggests that pro money were interested in this level not too long ago, thus unfilled buy orders could still remain. For all that though, a bounce is all that’s expected here due to the position of price on the weekly timeframe (see above).
- The more interesting setup around 112.00, however, would be on the break below and (confirmed) retest of this number since at that point, you’d be trading in-line with weekly expectations and also below the Feb 12th daily open 112.40. Should our analysis be correct and we manage to pin down a setup below 112.00 sometime this week, we’ll be eyeing the 111.00 figure as our immediate take-profit target, followed by the weekly support at 110.09.
 Levels to watch/live orders:
- Buys: 112.00 [Tentative – confirmation required] (Stop loss: dependent on where one confirms this level).
- Sells: 114.12 [Tentative – confirmation required] (Stop loss: dependent on where one confirms this level).
Watch for bids to be consumed around 112.00 and look to trade any retest seen thereafter (lower timeframe confirmation required).
USD/CAD:
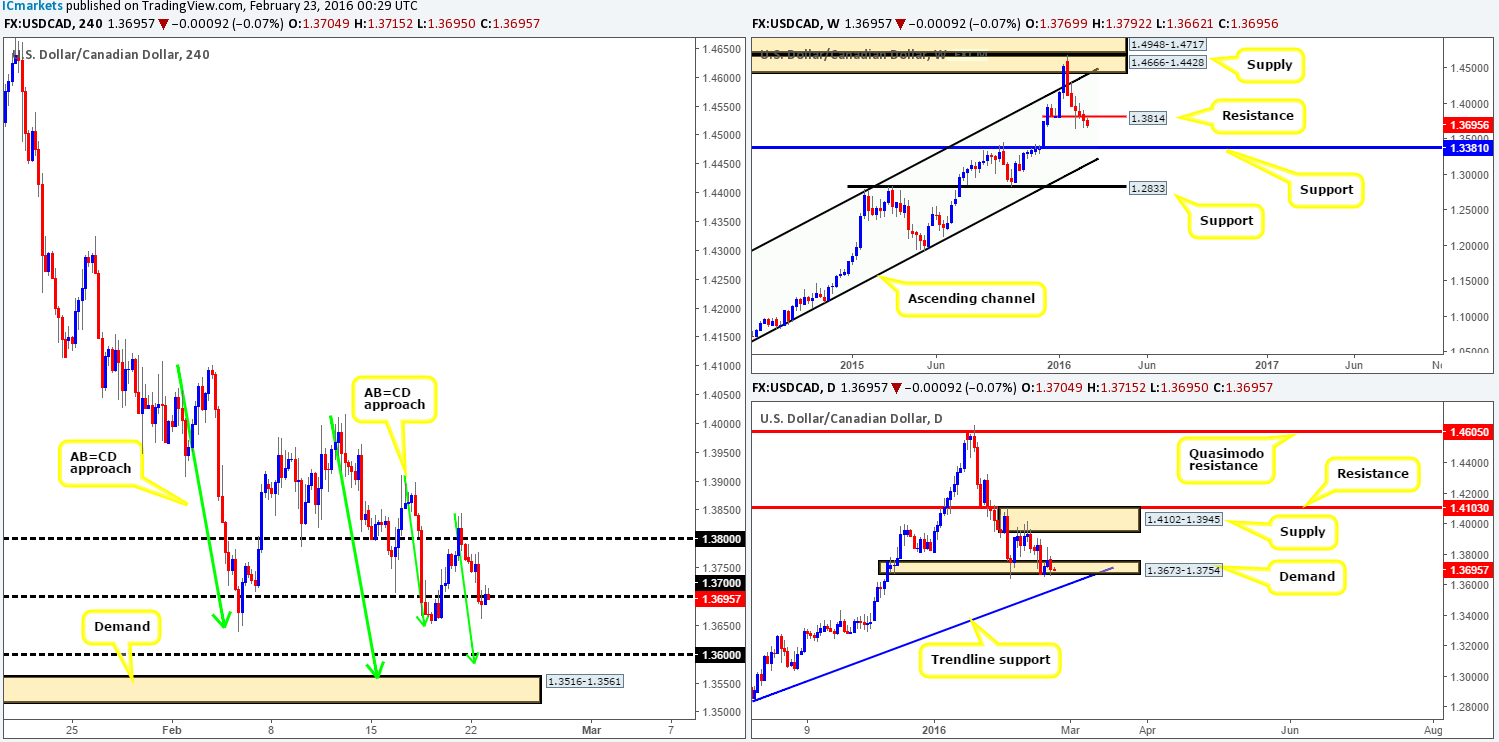
The USD/CAD is seen trading markedly lower this morning, due to a relatively heavy round of selling yesterday from the underside of psychological resistance 1.3800 down to the 1.3700 region. What is more interesting, however, is the bigger picture currently being painted on the H4. Current action appears to be chalking up two H4 AB=CD bull patterns (see green arrows) on approach to a psychological support at 1.3600 and a H4 demand fixed at 1.3516-1.3561. Both of these areas, as you can probably see, are supported by the daily trendline extended from the low 1.1919. Despite this, we favor longs from the demand. Our rationale behind this approach comes from the fact that psychological boundaries such as 1.3600 are notorious for fakeouts, and with a juicy-looking H4 demand lurking only forty pips below at 1.3516-1.3561, a break lower is very likely, hence our decision to focus on the demand.
Despite the confluence seen at this demand, nevertheless, we would highly recommend waiting for the lower timeframes to confirm this zone since, weekly action is presently showing room for a move lower to support at 1.3381.
Levels to watch/live orders:
- Buys: 1.3600 [Tentative – confirmation required] (Stop loss: dependent on where one confirms this level). 1.3516-1.3561 [Tentative – confirmation required] (Stop loss: dependent on where one confirms this area).
- Sells: Flat (Stop loss: N/A).
USD/CHF:
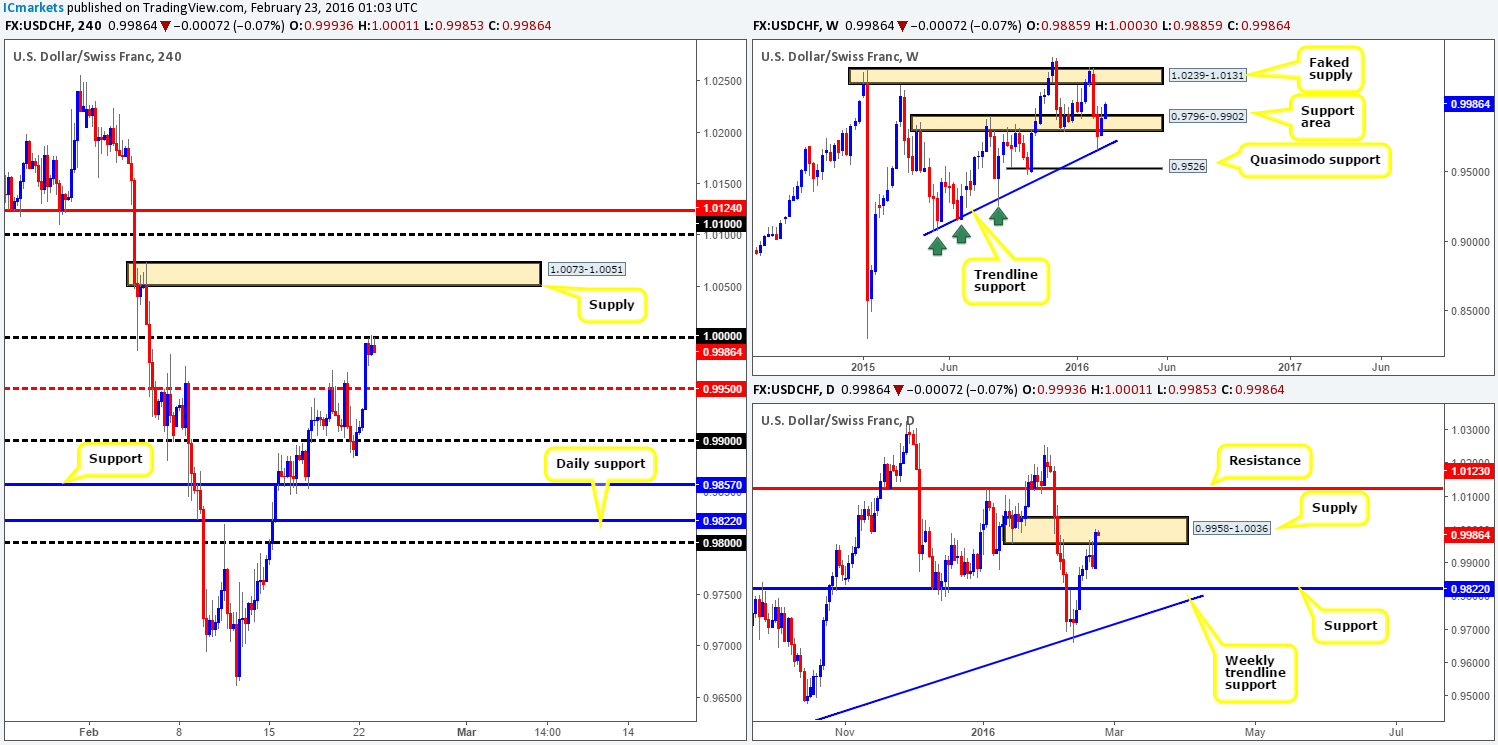
Kicking-off this morning’s analysis with a look at the weekly chart shows that we may have been a little inaccurate with our previous analysis on this timeframe. It appears price has aggressively faked through a support barrier at 0.9796-0.9902 and tagged in bids from a trendline support extended from the low 0.9078. If our outlook is correct, the path north appears free to connect with a faked supply drawn from 1.0239-1.0131. Zooming in and looking at the daily chart, however, current action is housed within a supply area penciled in at 0.9958-1.0036, which could put the brakes on any buying seen on the weekly timeframe.
On the basis that traders were selling the safe-haven Swiss Franc and buying more risky instruments yesterday, the H4 chart rallied beautifully from the 0.9900 region up to parity (1.0000).
In view of the above, one could look to short from parity today since this market is also encased within daily supply (see above). Nevertheless, due to the weekly timeframe showing room to move higher, waiting for lower timeframe confirmation would be a must for us here. A H4 close above parity on the other hand would likely open the gates for prices to challenge H4 supply at 1.0073-1.0051, and possibly the 1.0100 figure, followed by the H4 resistance level at 1.0124 (a few pips below the underside of weekly supply discussed above). To trade this move, we need to see price retest parity as support together with a lower timeframe buy signal.
Levels to watch/live orders:
- Buys: Watch for offers to be consumed around 1.0000 and look to trade any retest seen thereafter (lower timeframe confirmation required).
- Sells: 1.0000 [Tentative – confirmation required] (Stop loss: dependent on where one confirms this level).
DOW 30:
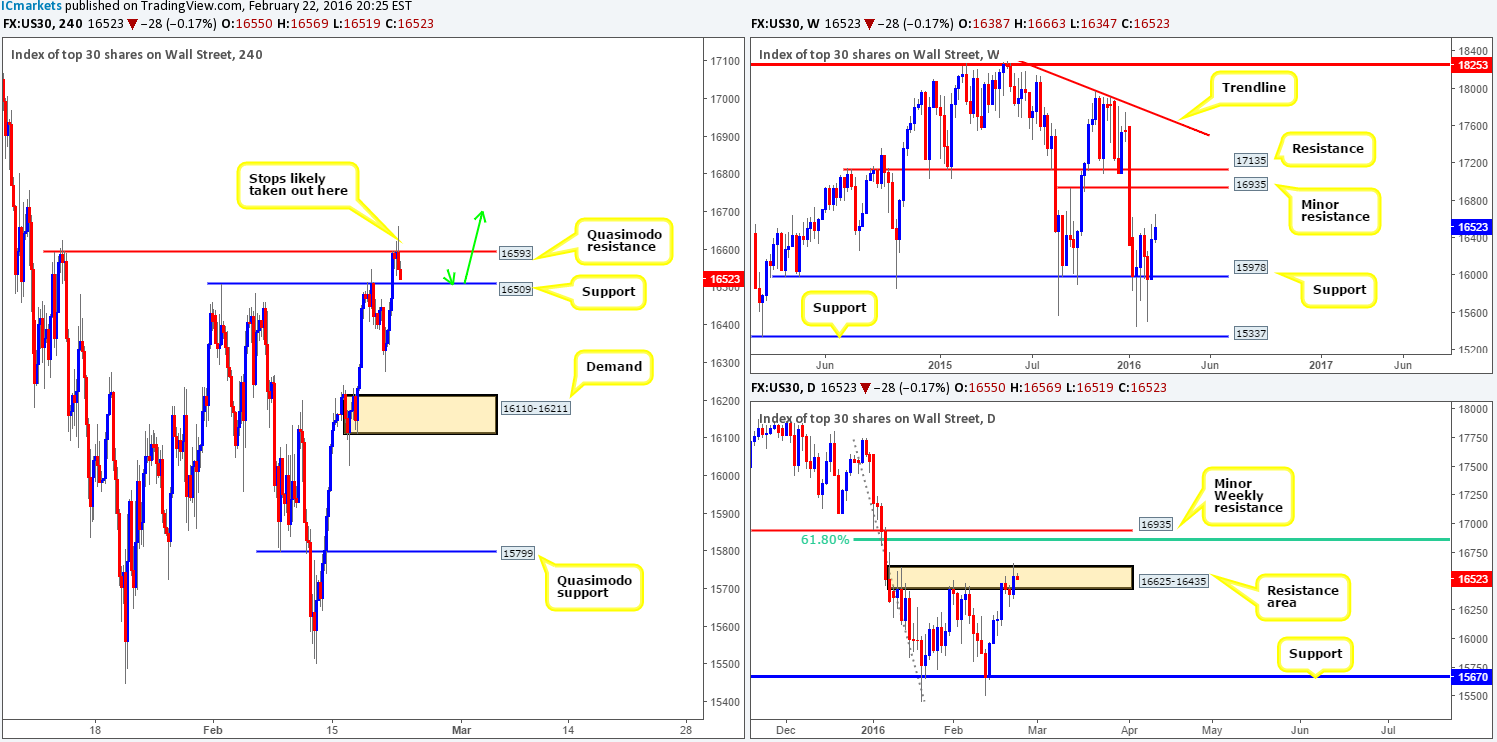
U.S. stocks saw a sharp increase in value yesterday, resulting in price taking out a H4 resistance (now acting support) at 16509 and aggressively jabbing into a H4 Quasimodo line drawn from 16593, which is currently holding firm.
This recent surge in buying has seen price stab above a daily resistance area at 16625-16435, likely filling a truckload of stop orders and possibly clearing the path north up to weekly resistance penciled in at 16935. Therefore, with stops potentially cleared from the daily resistance area and also above the aforementioned H4 Quasimodo line, our team will be looking to enter long (with lower timeframe confirmation) around the H4 support level at 16509 today (as per the green arrows). In the event that this trade comes to fruition, the ultimate target would be 16935 – the weekly resistance.
Levels to watch/live orders:
- Buys: 16509 [Tentative – confirmation required] (Stop loss: dependent on where one confirms this level).
- Sells: Flat (Stop loss: N/A).
XAU/USD: (Gold)
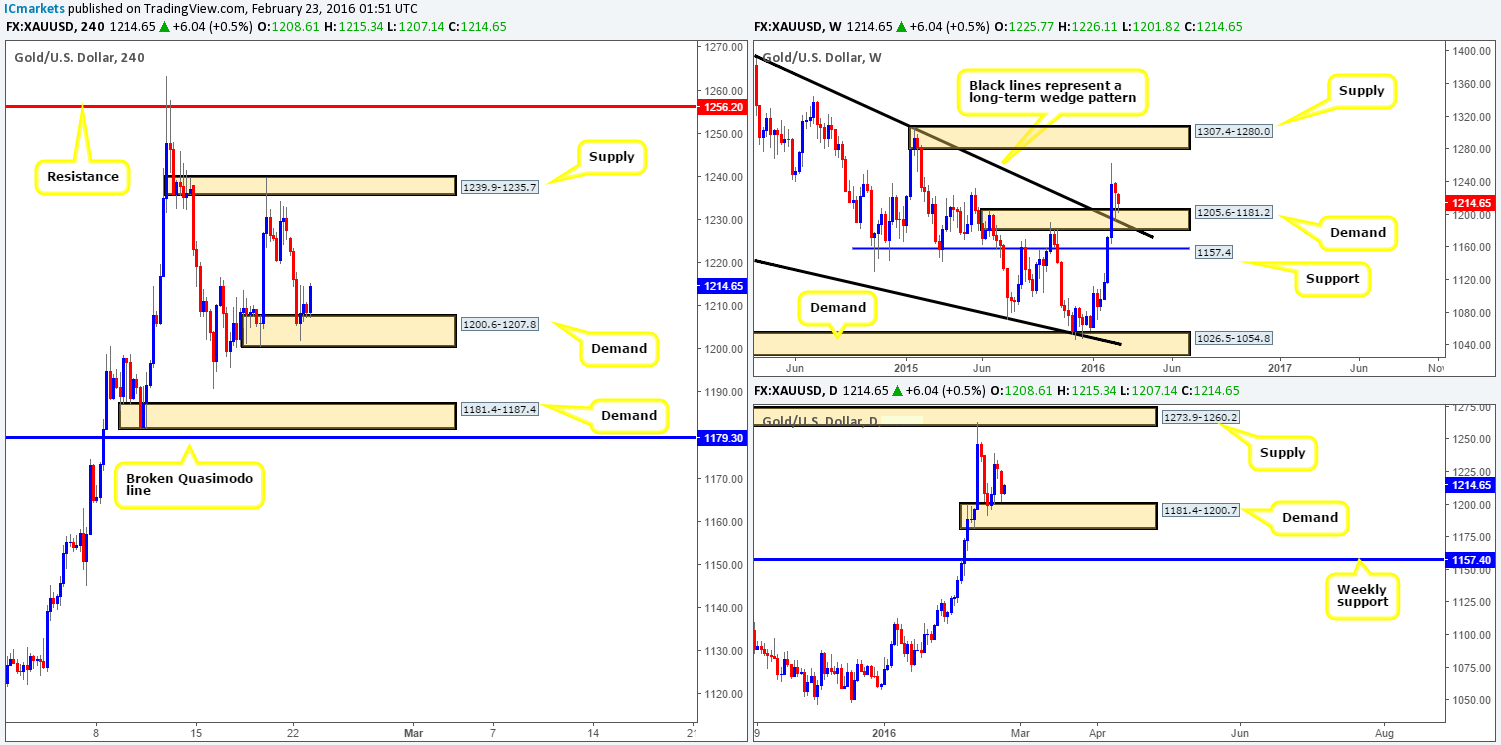
Gold was heavily sold off during the course of yesterday’s sessions as investors shifted from safe-haven assets to the more risky markets. As can be seen from the H4 chart, however, the tables began to turn going into the U.S. session with the yellow metal finding active bids from deep within demand seen at 1200.6-1207.8. This area is very significant! Not only does it sit on top of a daily demand at 1181.4-1200.7, it is also housed within the extremes of a weekly broken supply (now demand) at 1205.6-1181.2, that converges with the recently broken weekly wedge resistance (now support) taken from the high 1485.3.
This to us is certainly worthy of attention! To be on the safe side though, if you’re considering buying from the current H4 demand, we’d recommend waiting for a lower timeframe buy signal. Reason being is Gold could quite easily drop lower to the next H4 demand coming in at 1181.4-1187.4, which happens to be positioned within the extremes of both the above said higher-timeframe demands (see above). Therefore, this would be a place, depending on the time of day, we’d look to enter long from at market.
Levels to watch/live orders:
- Buys: 1200.6-1207.8 [Tentative – confirmation required] (Stop loss: dependent on where one confirms this area). 1181.4-1187.4 [Dependent on the time of day, a market entry is possible from here] (Stop loss: placed below the H4 broken Quasimodo line at 1176.8).
- Sells: Flat (Stop loss: N/A).


