
A note on lower timeframe confirming price action…
Waiting for lower timeframe confirmation is our main tool to confirm strength within higher timeframe zones, and has really been the key to our trading success. It takes a little time to understand the subtle nuances, however, as each trade is never the same, but once you master the rhythm so to speak, you will be saved from countless unnecessary losing trades. The following is a list of what we look for:
- A break/retest of supply or demand dependent on which way you’re trading.
- A trendline break/retest.
- Buying/selling tails/wicks – essentially we look for a cluster of very obvious spikes off of lower timeframe support and resistance levels within the higher timeframe zone.
- Candlestick patterns. We tend to stick with pin bars and engulfing bars as these have proven to be the most effective.
We search for lower timeframe confirmation between the M15 and H1 timeframes, since most of our higher-timeframe areas begin with the H4. Stops are usually placed 5-10 pips beyond confirming structures.
EUR/USD:
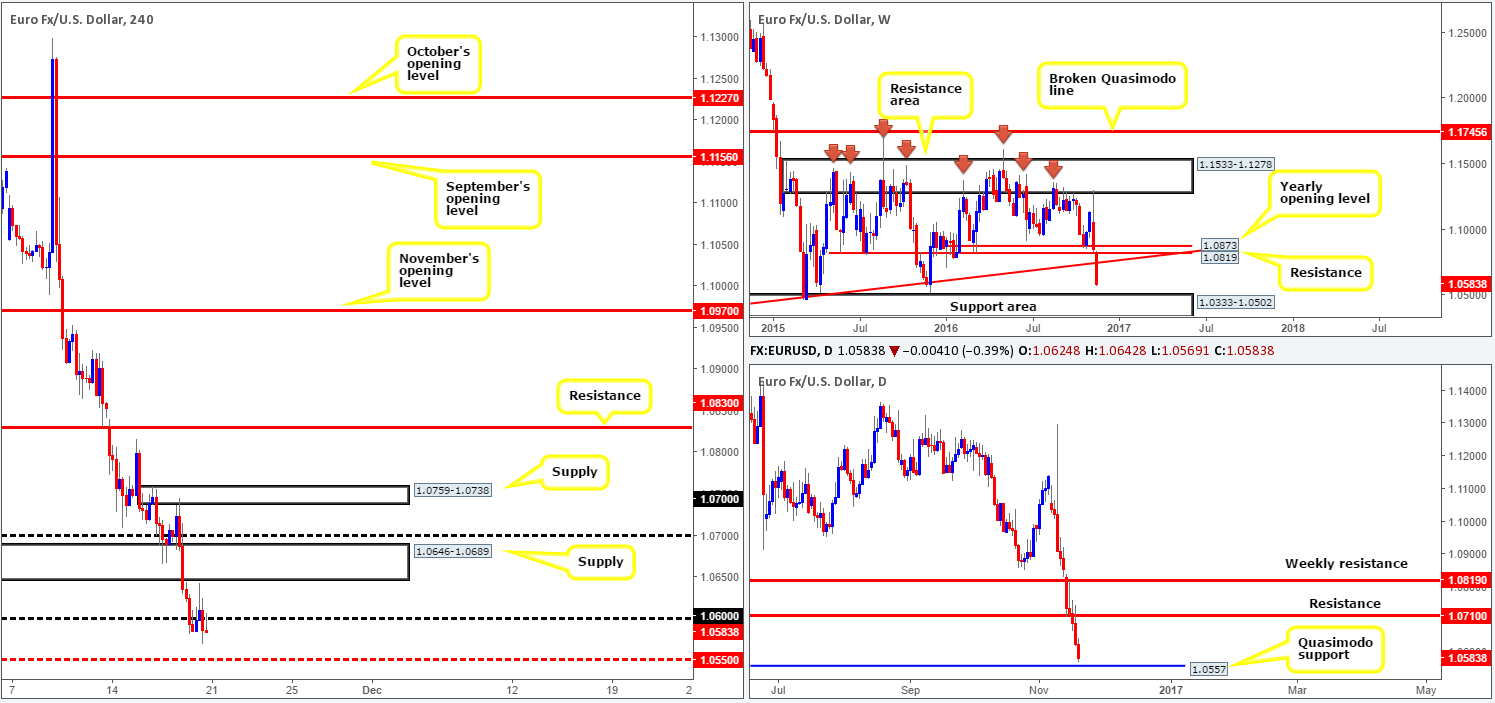
For the most part, it was a relatively quiet day yesterday with price ranging no more than 70 pips. What we did see, however, was the EUR end the day in positive territory after 10 consecutive losing days! The single currency, as you can see, opened the week on a strong footing, sporting a H4 close above the 1.06 handle. This followed with a subsequent rally north up to the underside of a H4 supply coming in at 1.0646-1.0689, which held firm and forced price to retest 1.06 as support going into the London close.
While the current move north is, at least in our book, seen as correctional so far, we cannot rule out the possibility of a continuation move higher towards daily resistance at 1.0710 that is located just below the weekly trendline resistance extended from the low 0.8231.
Our suggestions: Although the higher-timeframe structures show room for the pair to extend higher, buying this market is challenging given that the current H4 supply is lodged below the 1.07 handle which, by extension, is positioned 10 pips below the daily resistance mentioned above – not a lot of room to play with!
Selling from the 1.07 neighborhood on the other hand, is a reasonable possibility. However, for those who agree with our analysis, you’d also need to be prepared for the possibility of a fakeout above 1.07 up to the underside of a H4 supply at 1.0759-1.0738 (the green zone represents a fakeout zone). It will be interesting to see how today’s action pans out considering there’s very little high-impacting EUR or USD news on the docket today.
Levels to watch/live orders:
- Buys: Flat (stop loss: N/A).
- Sells: 1.07/1.0738 region ([lower timeframe confirmation required before entry is permitted – please see the top of this report for ideas on how to utilize lower timeframe entries] stop loss: dependent on where one confirms this area).
GBP/USD:
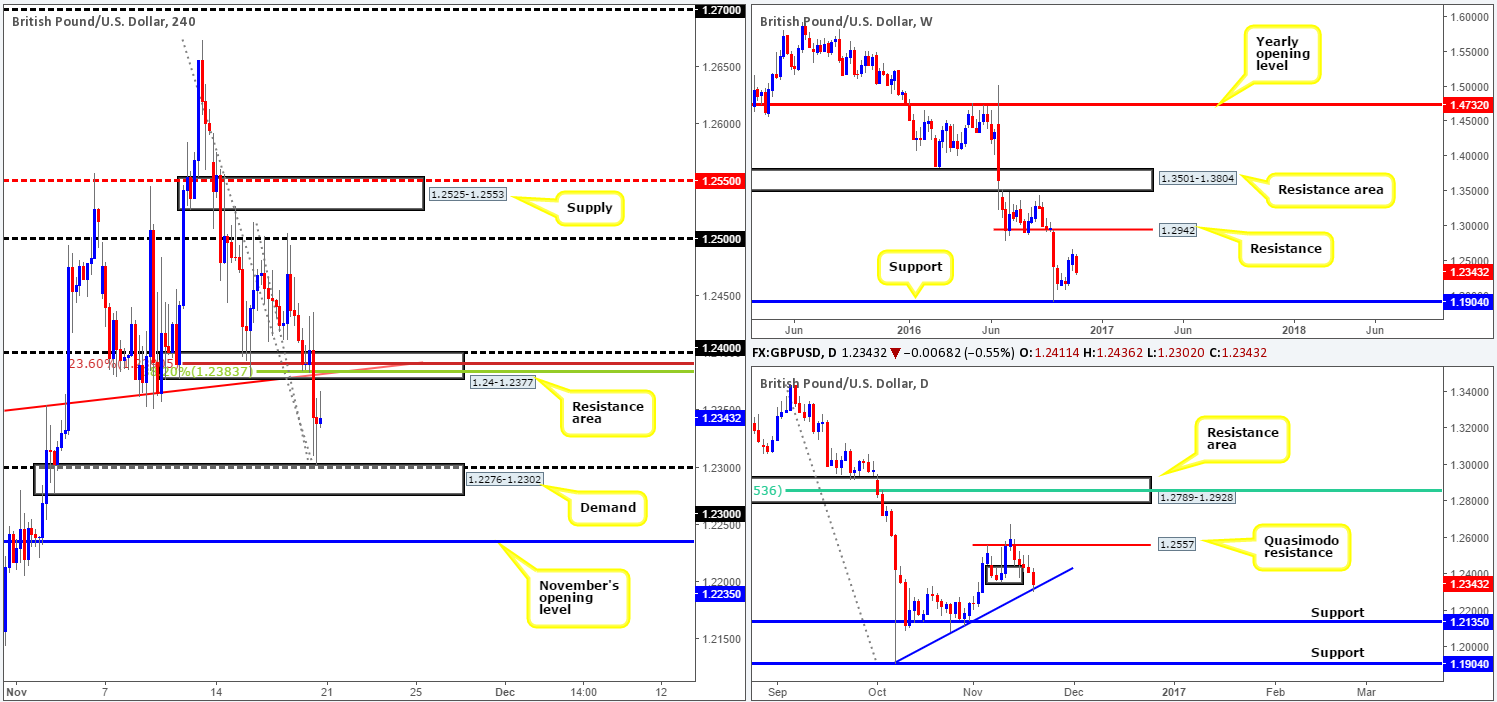
Following comments made by British Prime Minister Theresa May at a conference on Monday in London, regarding EU uncertainty and the lowering of corporate taxes, the impact of this speech sent the GBP skyward in just a few minutes. As a result, H4 candle action engulfed the resistance area at 1.24-1.2377 (now acting support) and attacked the 1.25 handle as US traders entered the fight.
Up to now, the pair has remained well-offered below 1.25, but seeing as there’s room on the daily chart to continue advancing north toward a Quasimodo resistance at 1.2557, we may see price bid above 1.25 into the H4 resistance area at 1.2525-1.2557 sometime today.
Our suggestions: On account of the points made above, we have absolutely no interest in buying this market today. Selling on the other hand, is particularly interesting around the aforementioned H4 resistance area. Building a case for entry we have the following confluence:
- H4 mid-way resistance at 1.2550.
- A H4 61.8% Fib resistance at 1.2531.
- And, finally the top edge of the current H4 resistance area denotes the above said daily Quasimodo resistance at 1.2557.
Therefore, we would, dependent on if we’re able to pin down a lower timeframe sell entry, look to short from this area, with the expectation that price closes back below 1.25 and heads southbound to the 1.24 region.
Data points to consider: MPC member Forbes speaks at 11.30am GMT.
Levels to watch/live orders:
- Buys: Flat (stop loss: N/A).
- Sells: 1.2525-1.2557 ([lower timeframe confirmation required before entry is permitted] stop loss: dependent on where one confirms this area).
AUD/USD:
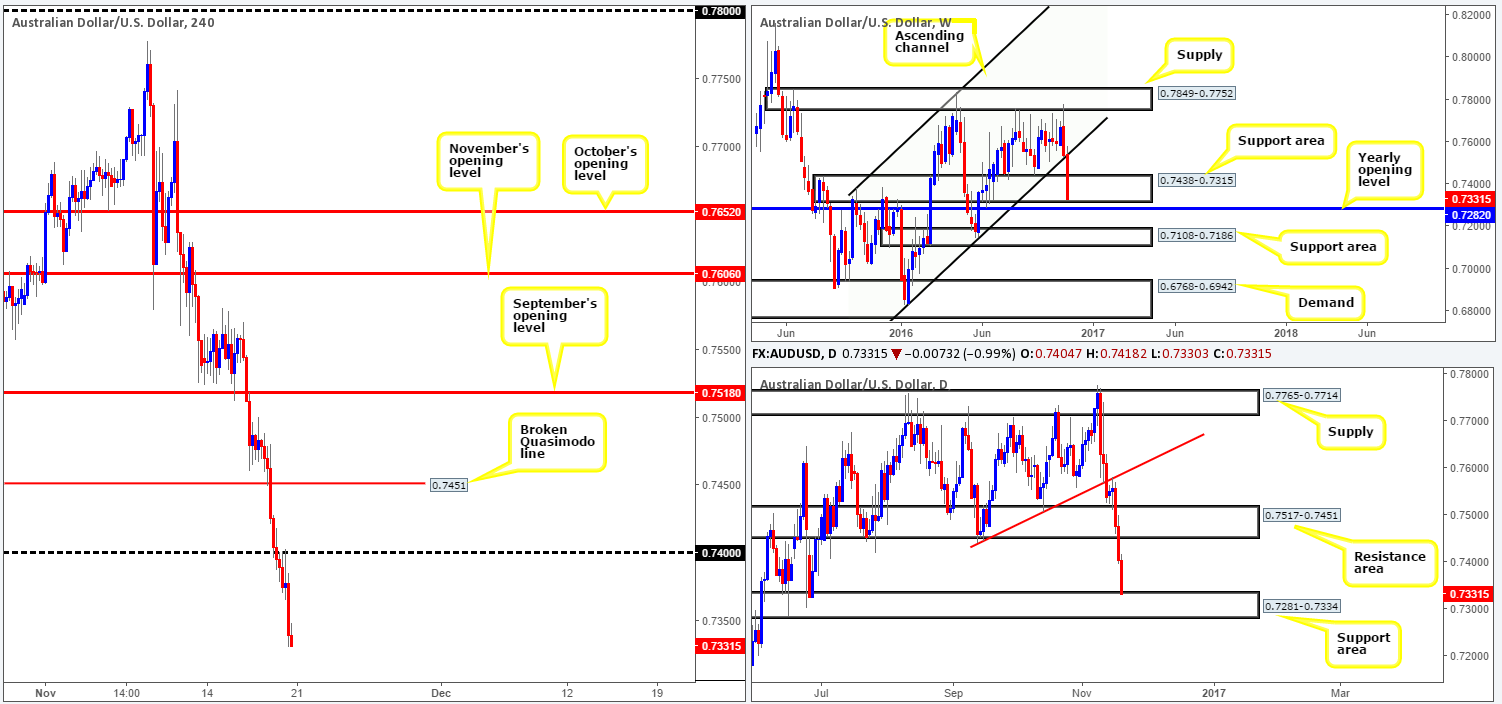
Leaving the 0.73 handle unchallenged the commodity currency rallied to highs of 0.7381 yesterday, consequently closing the day in the green after three consecutive daily losses. The pair appears to have attracted fresh buyers around the top edge of a daily support area coming in at 0.7281-0.7334, and also following a slight breach/fakeout to the lower edge of a weekly support area seen at 0.7438-0.7315.
As far as the daily chart’s structure is concerned, there’s upside potential seen to the 0.7517-0.7451 area: a resistance zone that stretches as far back as July 2015. On the H4 chart, nevertheless, the next point of concern can be seen at 0.74: a psychological band which held beautifully as resistance on a retest last week. For us to become buyers a H4 close above 0.74 is required, which, as you can see, would likely open the pathway north up to at least the H4 broken Quasimodo line at 0.7451: the underside of the aforementioned daily resistance area.
Our suggestions: Put simply, wait for a close above 0.74 to take shape. Following this, a retest of 0.74 as support along with a reasonably sized H4 bullish close is required prior to pulling the trigger here. The First take-profit target is 0.7451 (as explained above), followed closely by a H4 supply coming in at 0.7500-0.7477 and then September’s opening level 0.7518.
Data points to consider: RBA Assistant Gov. Kent speaks at 7.45am GMT.
Levels to watch/live orders:
- Buys: Watch for a close above the 0.74 handle and then look to trade any retest seen thereafter (waiting for a H4 bullish close to form following the retest is preferable prior to pulling the trigger – stop loss: ideally beyond the trigger candle).
- Sells: Flat (stop loss: N/A).
USD/JPY:
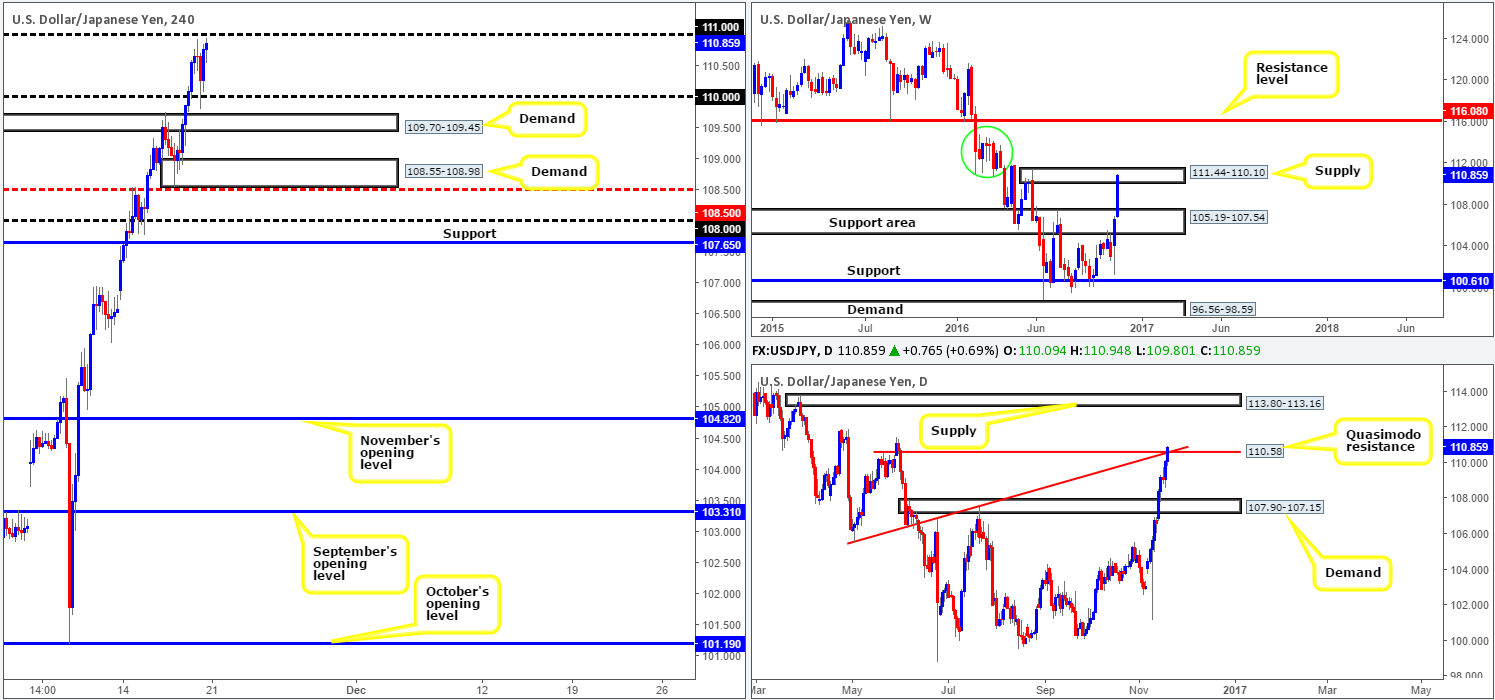
In view of the weekly timeframe, we can see that the sellers are establishing ground within supply drawn from 111.44-110.10. Should the sellers remain in the driving seat here, there’s a possibility that further downside could be seen to the support area coming in at 105.19-107.54. Looking down to the daily chart, it appears that yesterday’s session printed an indecision candle above the Quasimodo resistance level at 110.58. However, in recent hours we have seen price break back below this barrier. Therefore, we feel before one can confidently say that the sellers have taken back some control, a daily close below the current Quasimodo would be necessary.
An ideal situation, nevertheless, would be for a H4 close below the 110 handle to be seen. This would not only likely clear the airstrip south down to the 109 region, but also confirm downside strength from the current weekly supply area! Granted,109.50 could potentially throw a spanner in the works, but with a decisive close below 110 along with pressure from weekly sellers, we don’t imagine 109.50 causing too much of a problem.
Our suggestions: Wait for a H4 close to be seen beyond 110. This – coupled with a retest and a reasonably sized H4 bearish candle, should be sufficient enough to permit a short entry, targeting the 109 neighborhood.
Levels to watch/live orders:
- Buys: Flat (stop loss: N/A).
- Sells: Watch for a close below the 110 handle and then look to trade any retest seen thereafter (waiting for a H4 bearish close to form following the retest is preferable prior to pulling the trigger – stop loss: ideally beyond the trigger candle).
USD/CAD:
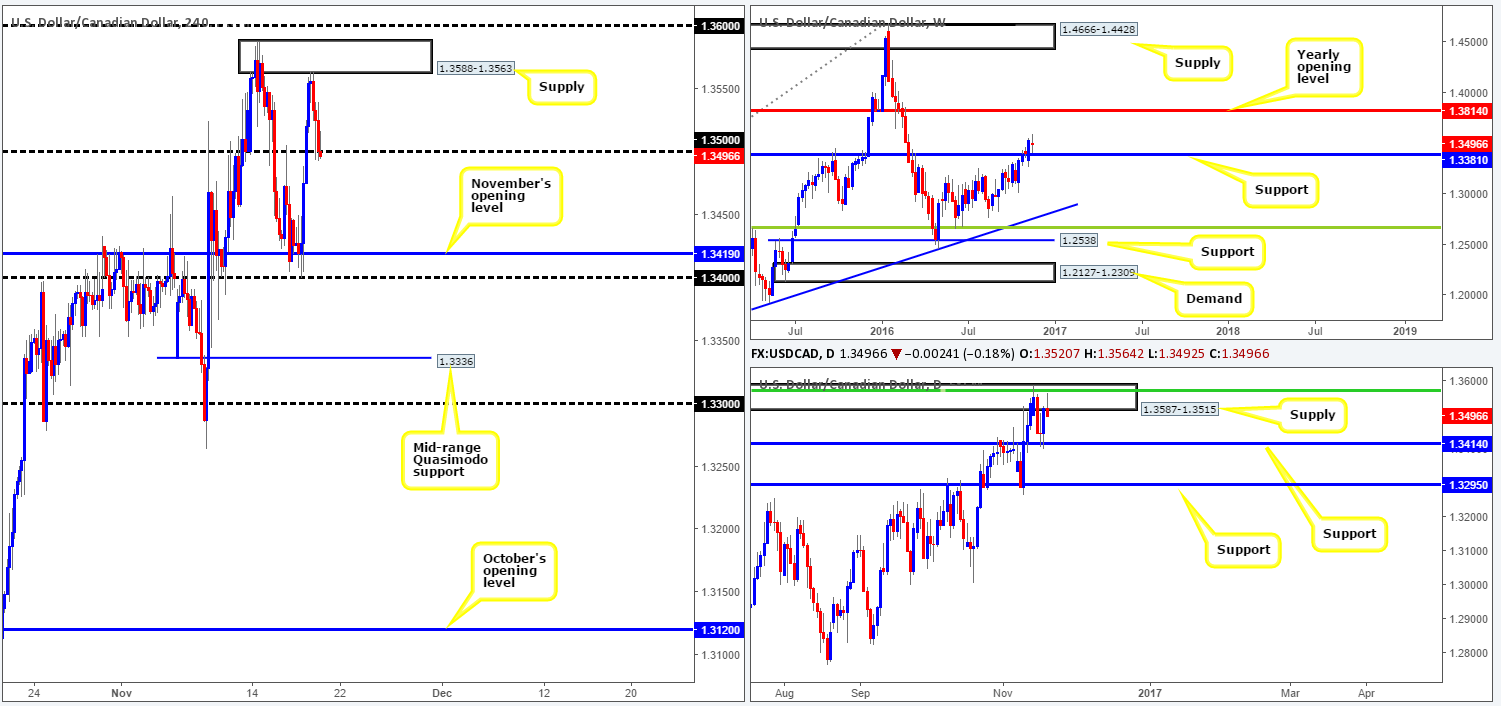
On the back of a surge in oil, the USD/CAD extended Friday’s downside move from the H4 supply at 1.3588-1.3563, surpassing November’s opening level at 1.3419 and filling bids around the 1.34 handle. However, so far there’s been very little bullish intention seen from here, which may portend further selling down to the H4 mid-range Quasimodo support at 1.3336.
While this seems a reasonable possibility on the H4, looking over to the weekly chart, a slightly different picture is currently being painted. 1.3381 is a weekly support level that can be seen stretching as far back as the early 90s! And, with price action now hovering 20 pips above this level, reaching the H4 mid-way Quasimodo support may be challenging.
Our suggestions: Entering short beyond 1.34 is a risky play, in our book, simply due to the nearby weekly support at 1.3381. To become buyers, nevertheless, first we’d ideally like to see price strike (and hold) the weekly support. Following this, a H4 close back above November’s opening level at 1.3419 would be required. Only then would we believe the track north to be clear for buying back up to the 1.35 region.
Data points to consider: Canadian core retail sales at 1.30pm GMT.
Levels to watch/live orders:
- Buys: 1.3381 region ([H4 close above 1.3419 is needed before we can begin looking to buy [on the retest] this market] stop loss: ideally beyond the trigger candle).
- Sells: Flat (stop loss: N/A).
USD/CHF:
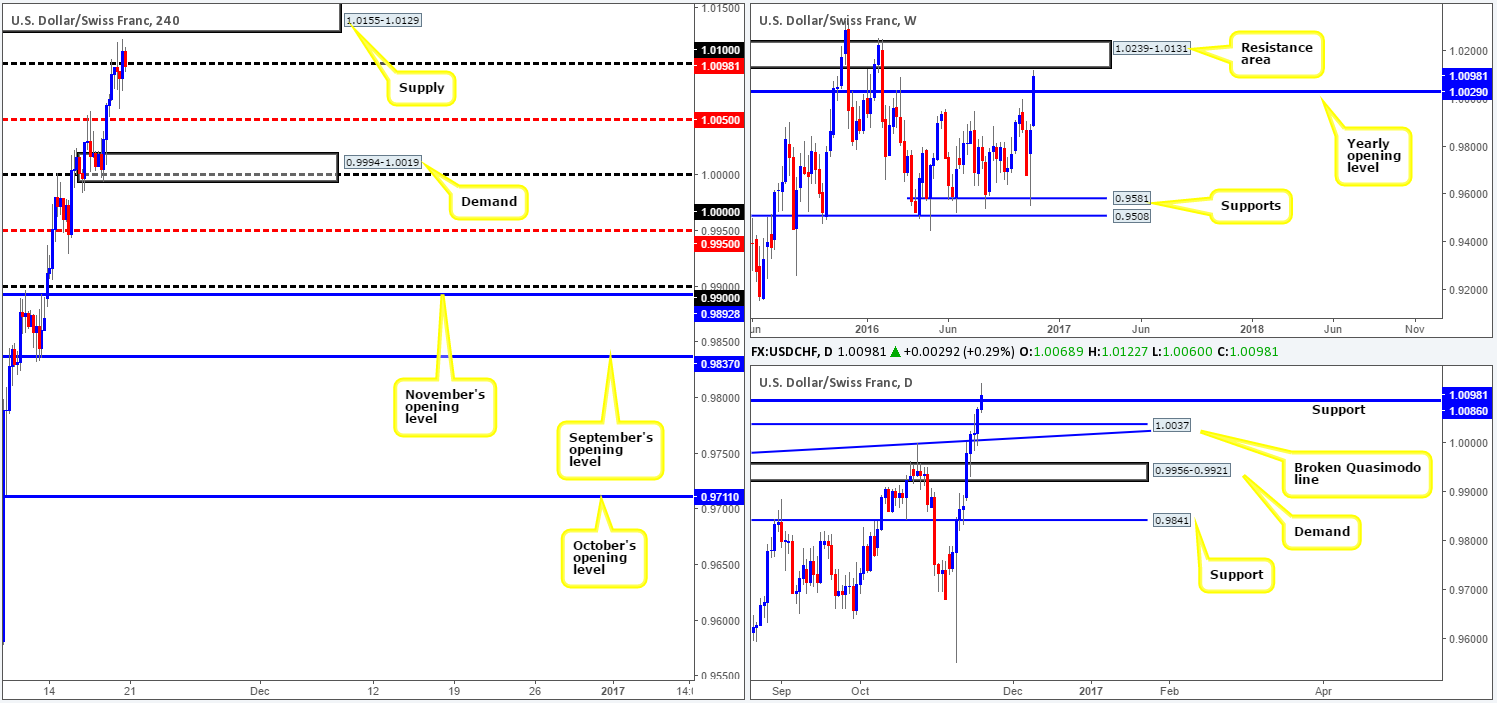
In recent trade, the H4 candles topped just ahead of a H4 supply zone coming in at 1.0155-1.0129, and are currently well-offered below the 1.01 handle. While there’s local support seen around the 1.0074 neighborhood, it’s likely price will eventually challenge the H4 mid-way support 1.0050 sometime today.
Looking over to the daily chart, you’ll notice price is trading around a support level at 1.0086. Should this barrier fail to hold ground, the next support target on this timeframe can be seen at a broken Quasimodo line at 1.0037, which aligns beautifully with the yearly opening level seen on the weekly chart at 1.0029.
Selling this market without waiting for at least a decisive H4 close to be seen beyond the current daily support is, in our opinion, asking for trouble. However, even with this close, there’s very little room for the bearish candles to stretch their legs since 1.0050 is just around the corner.
In regard to buying, this would not be something our team could stamp high probability given price recently came within a cat’s whisker of connecting with a weekly resistance area at 1.0239-1.0131.
Our suggestions: As you can see, technical elements are mixed at the moment leaving us with little choice but to remain flat for now.
Levels to watch/live orders:
- Buys: Flat (stop loss: N/A).
- Sells: Flat (stop loss: N/A).
DOW 30:
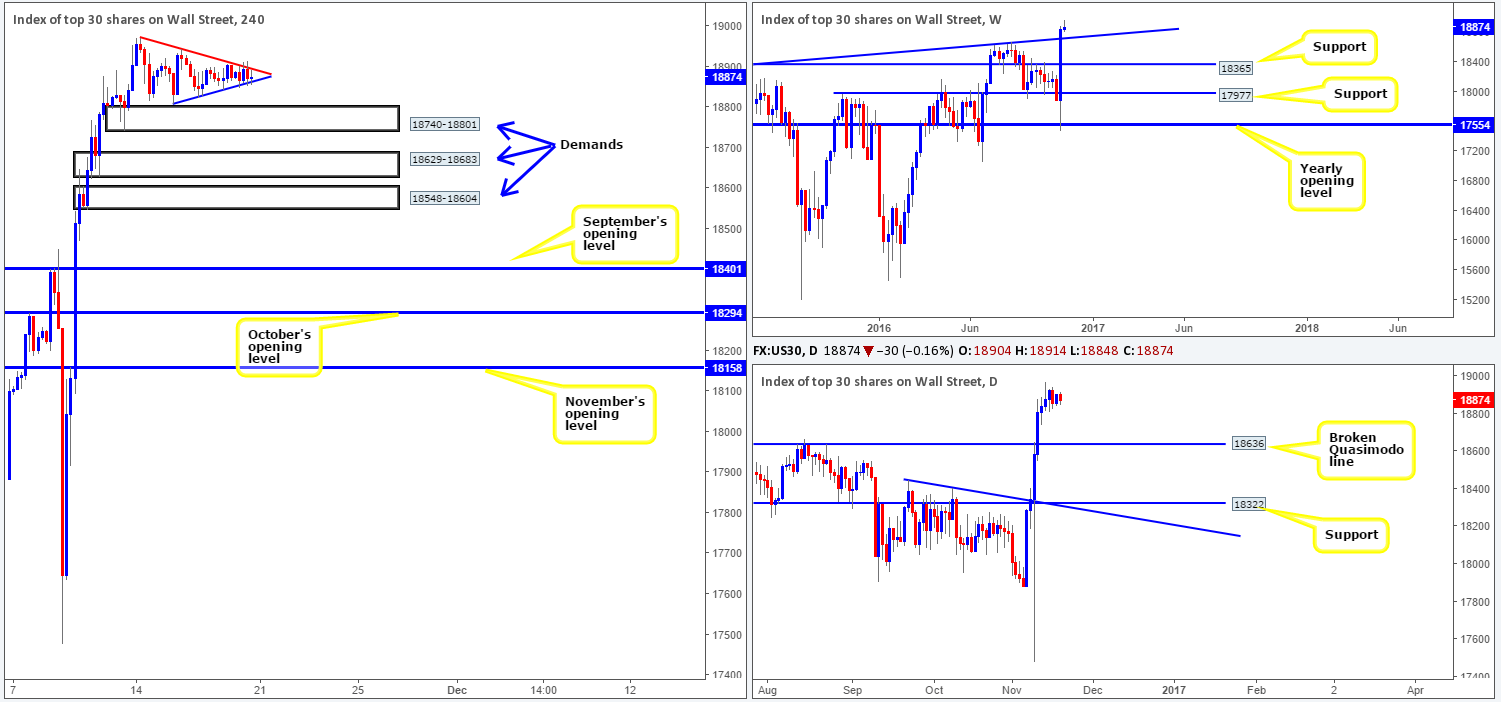
US equities closed in positive territory during Monday’s trading, as oil jumped on confidence that OPEC will agree to cut output. After compressing between two converging H4 trendlines (18971/18808) since the beginning of last week, the H4 candles finally broke out north and even retested the breaking point as support before rallying. This was a noted setup to keep an eye on in Monday’s report, so well done to any of our readers who managed to lock on here!
With the index recently hitting an all-time peak, our desk is, in an ideal world, looking to jump in long. This begs the question, where? Well the closest H4 support sits at 18902, which is a level we’ll be watching closely. Beyond this barrier, however, we have our eye on the H4 trendline support extended from the high 18971. Unfortunately, both of these levels do not boast higher-timeframe confluence. For that privilege, the market would need to test the H4 demand base at 18740-18801, which is positioned just above a weekly trendline support taken from the high 18365.
Our suggestions: Keep a tab on the H4 support at 18902, the H4 trendline support (18971) and the above mentioned H4 demand area for possible long entries. Of course, it is down to the individual trader how he/she chooses to enter at these levels. For us personally, the H4 support and trendline support would call for at least a H4 confirming bullish candle before we’d feel comfortable trading here. The H4 demand, nevertheless, would, dependent on the time of day, be somewhere our team would look to enter long at market with stops planted below the base at 18735.
Levels to watch/live orders:
- Buys: 18902 ([reasonably sized H4 bullish close required prior to pulling the trigger] stop loss: ideally beyond the trigger candle). The H4 trendline support (18971) ([reasonably sized H4 bullish close required prior to pulling the trigger] stop loss: ideally beyond the trigger candle).18740-18801 ([a possible area to consider entering at market from] stop loss: 18735).
- Sells: Flat (stop loss: N/A).
GOLD:
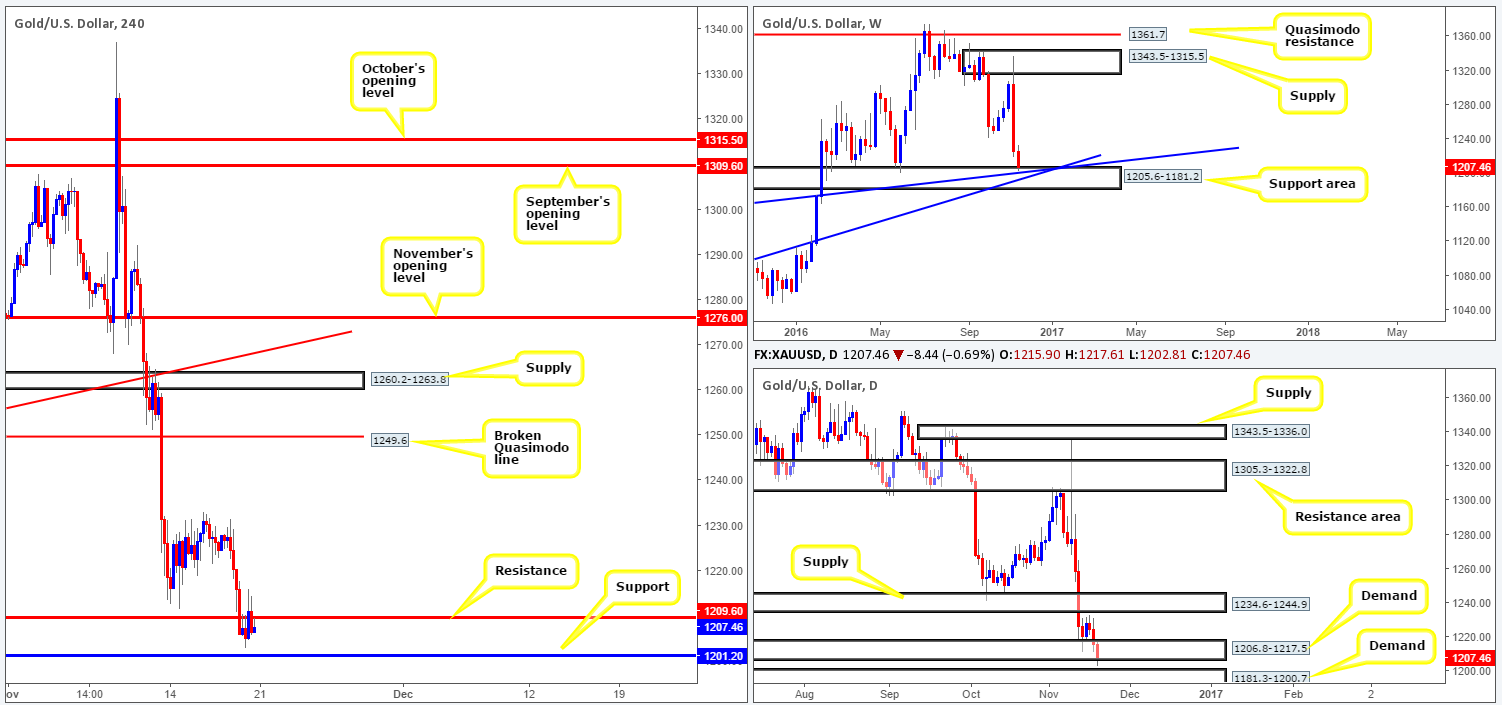
With the US dollar index recently topping around the 101.43 area, the price of the precious metal continues to increase in value. Looking at the H4 chart of the USDX, we can see room for the currency to continue depreciating until we reach a H4 demand zone coming in at 99.96-100.23. A similar pattern also exists on gold’s H4 chart, as there’s a clear supply lurking ahead at 1231.5-1226.7.
The notion of higher gold prices is further supported in that gold’s weekly candles recently tested a support area coming in at 1205.6-1181.2 that converges with two trendline supports 1130.1/1071.2. Furthermore, we can also see that daily action recently came within touching distance of connecting with demand seen at 1181.3-1200.7, and shows upside space towards a resistance area formed from 1234.6-1244.9.
Our suggestions: In light of the above factors, direction is clearly signaling further buying may be on the cards, at least until the H4 supply, which, by the way, sits directly below the daily resistance area mentioned above! Ultimately, for us to become buyers here, we’d need to see the H4 candles retest support at 1209.6 for a second time and hold firm. On the condition that a reasonably sized H4 bull candle closes off this hurdle, we would confidently enter long, targeting the above said H4 supply.
Levels to watch/live orders:
- Buys: 1209.6 ([wait for a reasonably sized H4 bullish close to form prior to pulling the trigger] stop loss: ideally beyond the trigger candle).
- Sells: Flat (stop loss: N/A).


