
A note on lower timeframe confirming price action…
Waiting for lower timeframe confirmation is our main tool to confirm strength within higher timeframe zones, and has really been the key to our trading success. It takes a little time to understand the subtle nuances, however, as each trade is never the same, but once you master the rhythm so to speak, you will be saved from countless unnecessary losing trades. The following is a list of what we look for:
- A break/retest of supply or demand dependent on which way you’re trading.
- A trendline break/retest.
- Buying/selling tails – essentially we look for a cluster of very obvious spikes off of lower timeframe support and resistance levels within the higher timeframe zone.
- Candlestick patterns. We tend to only stick with pin bars and engulfing bars as these have proven to be the most effective.
For us, lower timeframe confirmation starts on the M15 and finishes up on the H1, since most of our higher timeframe areas begin with the H4. Stops usually placed 5-10 pips beyond your confirming structures.
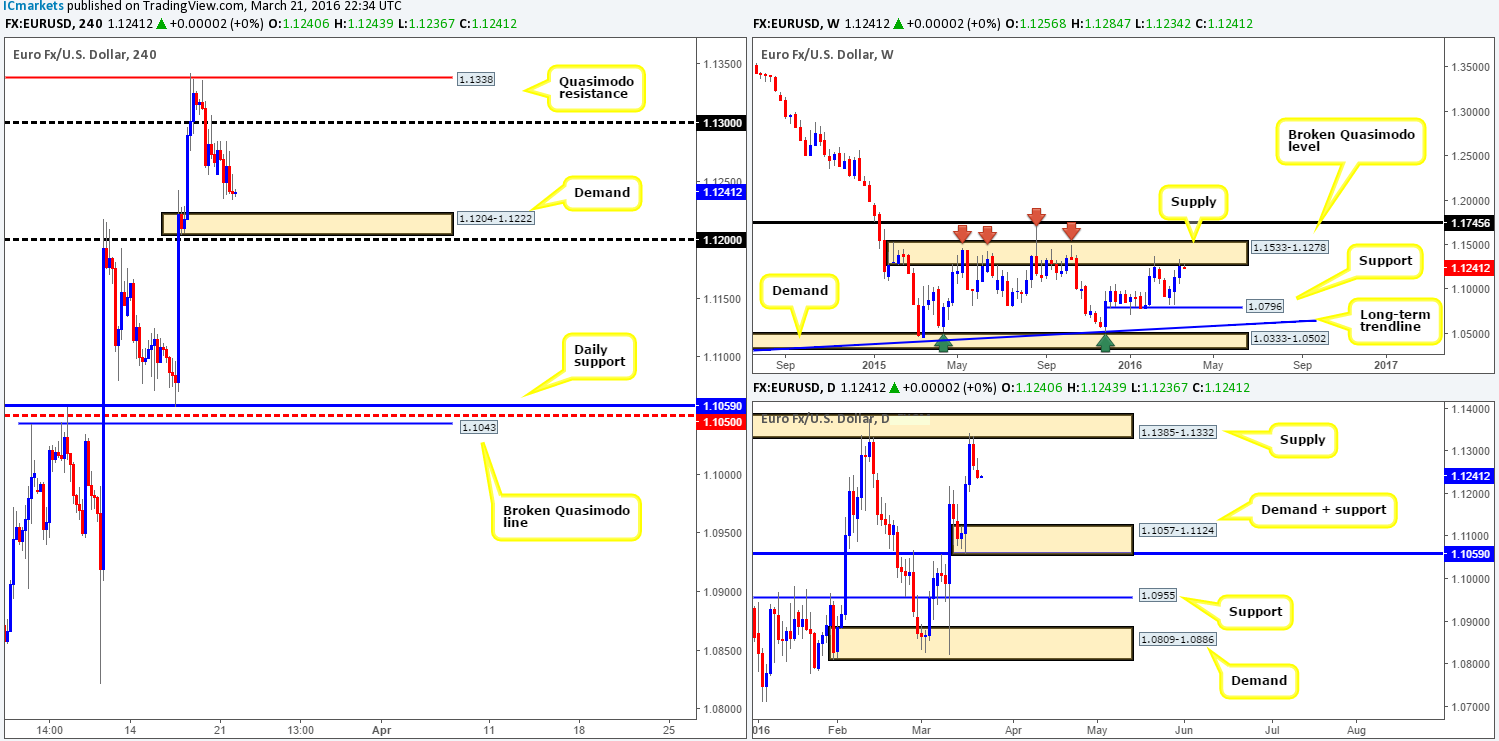
EUR/USD:
It was a rather quiet start to the week for the EUR/USD yesterday, with price ranging fifty pips all in all. In Monday’s report (see link below) we mentioned that we took a short entry late on Friday around the close of a H4 bearish selling wick at 1.1273, with the first take-profit target set at H4 demand drawn from 1.1204-1.1222. As we can all see from the chart, our position is currently in the green with little drawdown and is within touching distance of target one. Ultimately, what we’re looking at from here is a break below the H4 target demand and a continuation move down to daily demand at 1.1057-1.1124 – our final take-profit zone.
From a technical standpoint, we’re confident our position has an edge in this market at the moment. Here’s why: weekly price is currently trading from major supply coming in at 1.1533-1.1278, and down on the daily chart, supply at 1.1385-1.1332 (located just within the above said weekly supply area) is also firmly in the picture now. The closest support structure on the higher timeframes at this point, at least in our book, is the daily demand area we mentioned above at 1.1057-1.1124.
Should our position continue to drive lower and push below the 1.1200 figure today, traders may want to keep an eye on any retest seen at this number. Reason being is that there’s a clear 75-pip run from here down to the top-side of daily demand at 1.1124. http://www.icmarkets.com/blog/monday-21st-march-weekly-technical-outlook-and-review/
Levels to watch/live orders:
- Buys: Flat (Stop loss: N/A).
- Sells: 1.1273 [LIVE] (Stop loss: 1.1310). Watch for price to consume 1.1200 and look to trade any retest seen thereafter (lower timeframe confirmation preferred).
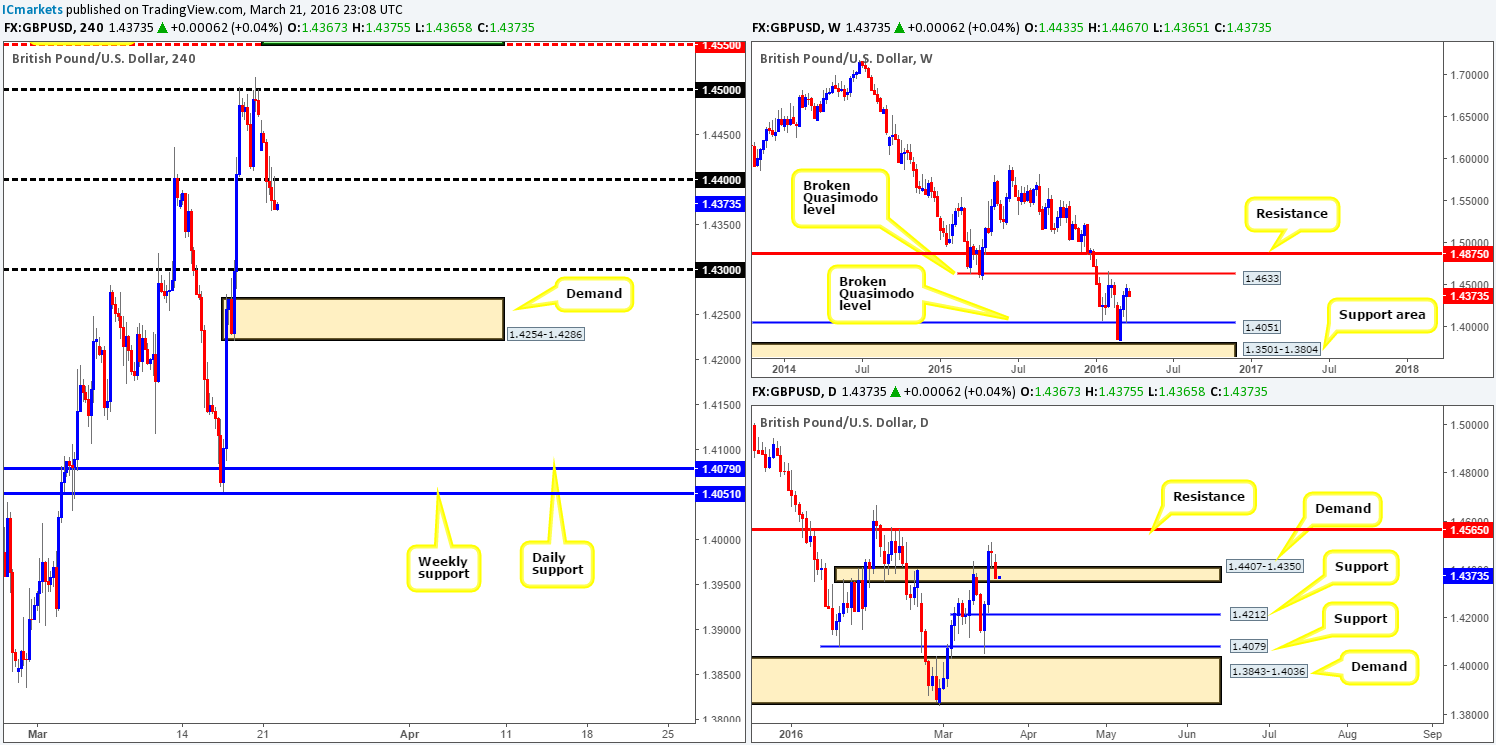
GBP/USD:
As can be seen from the H4 chart this morning, Cable began the week with a forty-pip bearish gap and continued to trade lower throughout the course of the day. Consequent to this, the 1.4400 figure was taken out and only just recently retested as resistance in the form of a very nice-looking bearish selling wick. At first glance, this seems a valid sell signal given little to no support being seen below until the 1.4300 region. However, upon scanning across to the daily chart, we can see that price is housed within the extremes of a daily demand base penciled in at 1.4407-1.4350.
Although we still feel the bears are likely going to push this pair further south today, it is not a trade we can take knowing that there is a chance that daily buyers may step in. With that, our team’s position will remain flat going into today’s sessions.
Levels to watch/live orders:
- Buys: Flat (Stop loss: N/A).
- Sells: Flat (Stop loss: N/A).
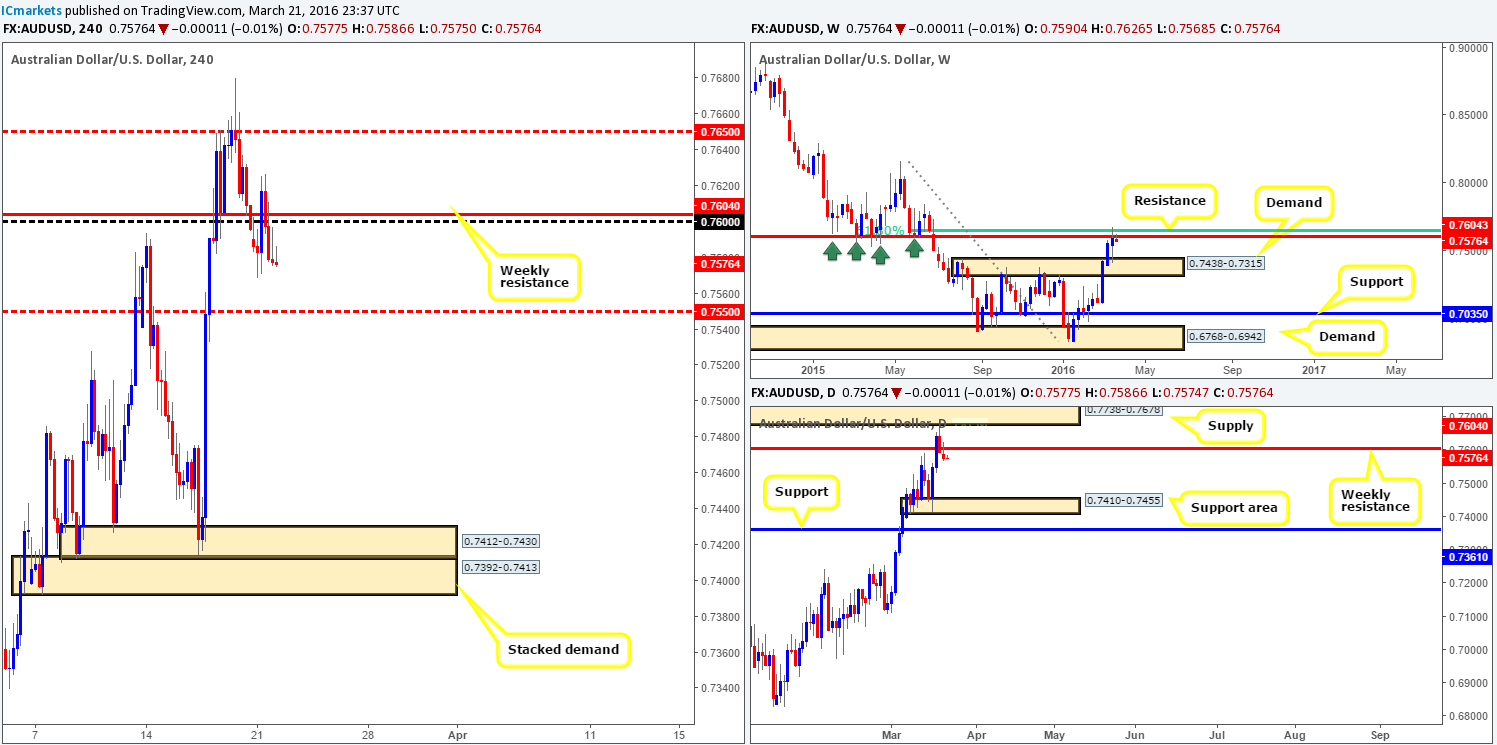
AUD/USD:
Following the open 0.7590, the commodity currency managed to reach lows of 0.7568 before aggressively whipsawing through both weekly resistance at 0.7604 and the 0.7600 figure, closing the day relatively unchanged. What Monday’s action did do, however, is print a sturdy-looking bearish selling wick over on the daily chart. This – coupled with weekly resistance, has firmly placed us within the seller’s camp in this market. The closest higher-timeframe support area can be seen on the daily chart at 0.7410-0.7455.
Given the points made above, shorting at current price, however, would likely put one at a serious disadvantage due to possible support coming in from the mid-level H4 barrier 0.7550. Therefore, what we’d like to see is price retest the 0.7600 region today and hold firm. With a lower timeframe sell signal here, this would be a very nice place to short, targeting 0.7550, followed by H4 demand at 0.7412-0.7430 (stacked demand positioned around the aforementioned daily support area). Additionally, if one misses the sell here, a close below and confirmed retest of 0.7550 might be something to consider since our final target, as we just mentioned (see above in bold), is over 100 pips away.
Levels to watch/live orders:
- Buys: Flat (Stop loss: N/A).
- Sells: 0.7600 [Tentative – confirmation required] (Stop loss: dependent on where one confirms this level). Watch for price to consume the 0.7550 level and look to trade any retest seen thereafter (Lower timeframe confirmation required).
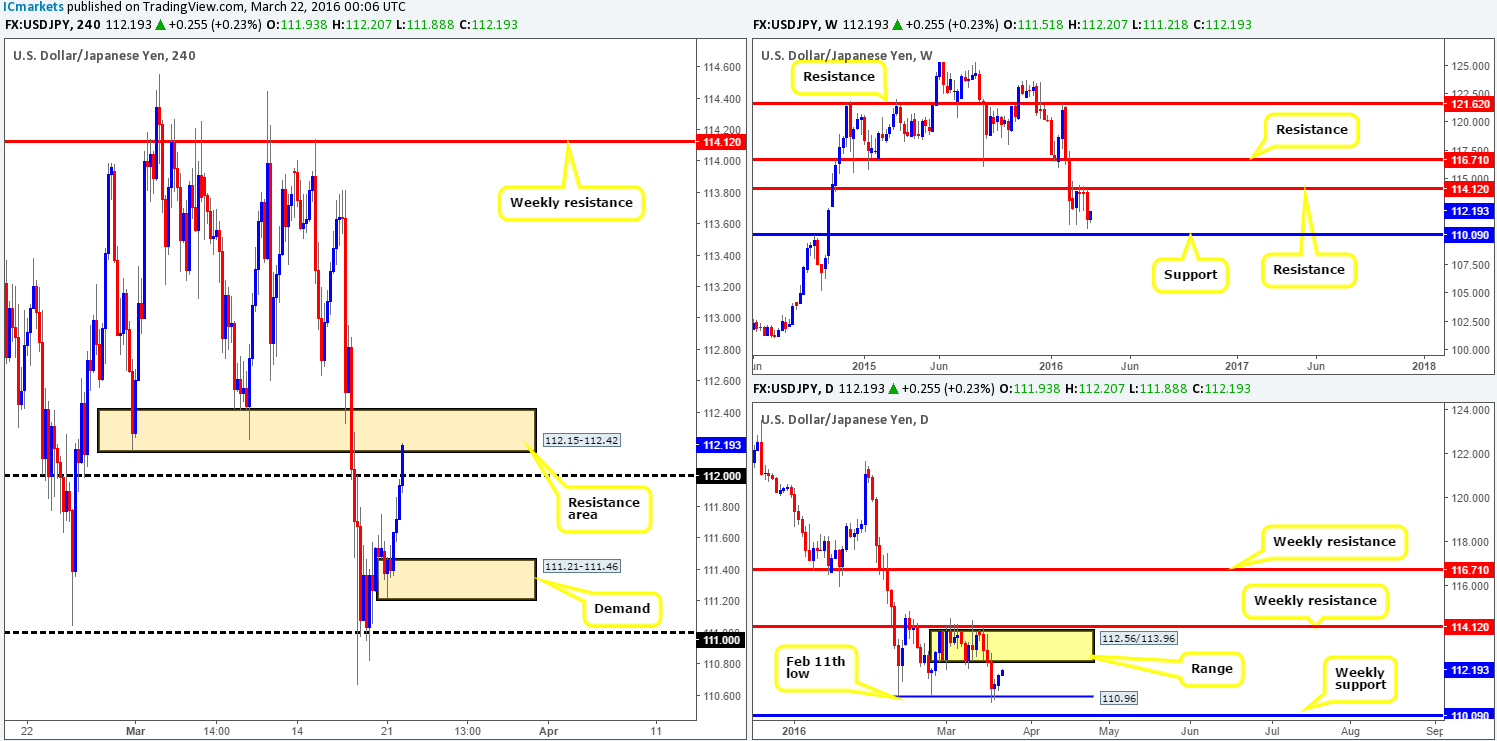
USD/JPY:
The USD/JPY is trading markedly higher this morning, as a relatively heavy round of buying yesterday came into this market during the London morning session. A moment ago, however, we saw the market trade through offers at the 112.00 figure and connect with a H4 resistance area at 112.15-112.42.
Due to this H4 zone being positioned relatively close to the underside of a daily range lower limit at 112.56, one needs to be prepared for this H4 area to be faked before sellers step in. Ideally, a nice bearish selling wick here would be a perfect scenario! In the event that no fakeout is seen and the bears push lower from the current H4 zone, we’d need to see price close below and retest the 112.00 figure before looking to short down to H4 demand at 111.21-111.46.
Levels to watch/live orders:
- Buys: Flat (Stop loss: N/A).
- Sells: Watch for price to consume the 112.00 level and look to trade any retest seen thereafter (Lower timeframe confirmation required). Watch for a fakeout beyond the H4 resistance area at 112.15-112.42 before looking to short this zone, targeting 112.00 first and foremost, followed by H4 demand at 111.21-111.46.
USD/CAD:
The USD/CAD pair, as you can see, rallied to highs of 1.3101 yesterday. This landed price deep within H4 supply at 1.3109-1.3070, more specifically, the psychological resistance 1.3100. This supply area and the one just above it at 1.3140-1.3167 are areas we have interest in selling from today. Our reasoning lies within the higher-timeframe structure. Up on the weekly chart, there’s little support below current prices until 1.2833 thus suggesting room for prices to move lower. Daily action on the other hand, shows price trading within the confines of a supply zone fixed between 1.3038-1.3165.
Seeing as how it is nearly impossible to know which H4 supply zone will react, if any, a short position will only be considered should a lower timeframe sell signal be seen. Targets from the lower zone will be the H4 Quasimodo support at 1.2945, followed by the 1.2900 figure, also a daily Quasimodo support. Targets from the upper H4 supply will be determined upon seeing what structure forms on approach.
To see ways of confirming a zone on the lower timeframes, please see the top of this page.
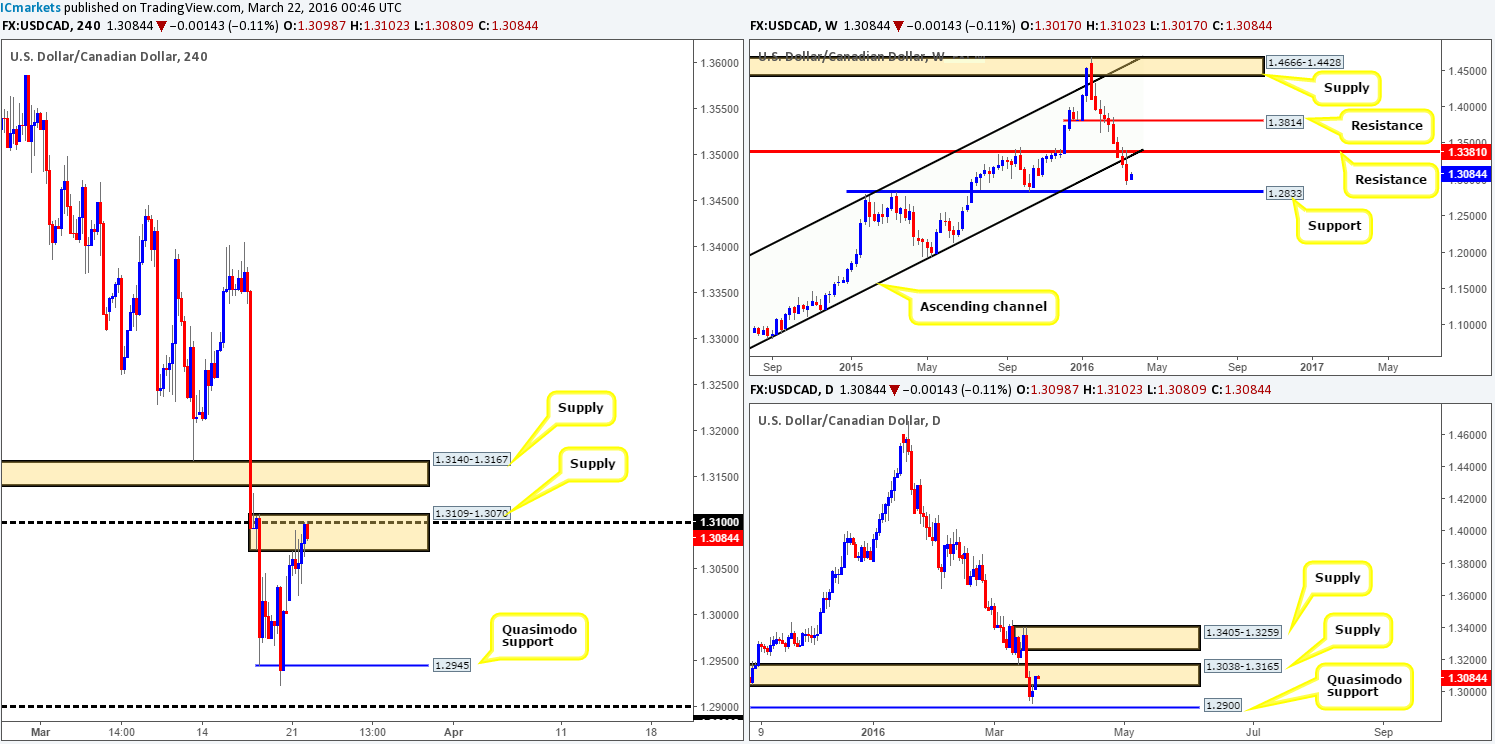
Levels to watch/live orders:
- Buys: Flat (Stop loss: N/A).
- Sells: 1.3109-1.3070 [Tentative – confirmation required] (Stop loss: dependent on where one confirms this area). 1.3140-1.3167 [Tentative – confirmation required] (Stop loss: dependent on where one confirms this area).
USD/CHF:
The USD/CHF market had quite an uneventful day yesterday, with price seen oscillating back and forth through the 0.9700 figure, hence the indecision candle that formed on the daily chart. The question now is who will win this tug-of-war, the bulls or the bears? Well, weekly action reveals that the pair remains trading below a trendline support (0.9071) following its break last week, thus opening up the possibility to further downside towards Quasimodo support at 0.9526. Down on the daily chart, mind you, support is being seen from the Feb 11th low 0.9660. Despite this support, daily price appears to be forming a D-leg of a nice-looking AB=CD bullish pattern completing just beneath the weekly Quasimodo support level mentioned above at 0.9526.
Given the above information (similar to Monday’s report), our team is not placing much emphasis on the current daily support. In fact, we’re quite confident that the 0.9700 level seen on the H4 will likely hold prices lower and eventually push this market down to H4 demand at 0.9579-0.9611. Ideally, we’d like to see the H4 close below Thursday’s low 0.9651 and retrace back up to the 0.9700 region for an entry. However, based on recent price action around the 0.9700 number, we’d be happy to take a short following a lower timeframe sell signal (to see ways of confirming a zone on the lower timeframes, please see the top of this page), targeting Thursday’s low as our initial target.
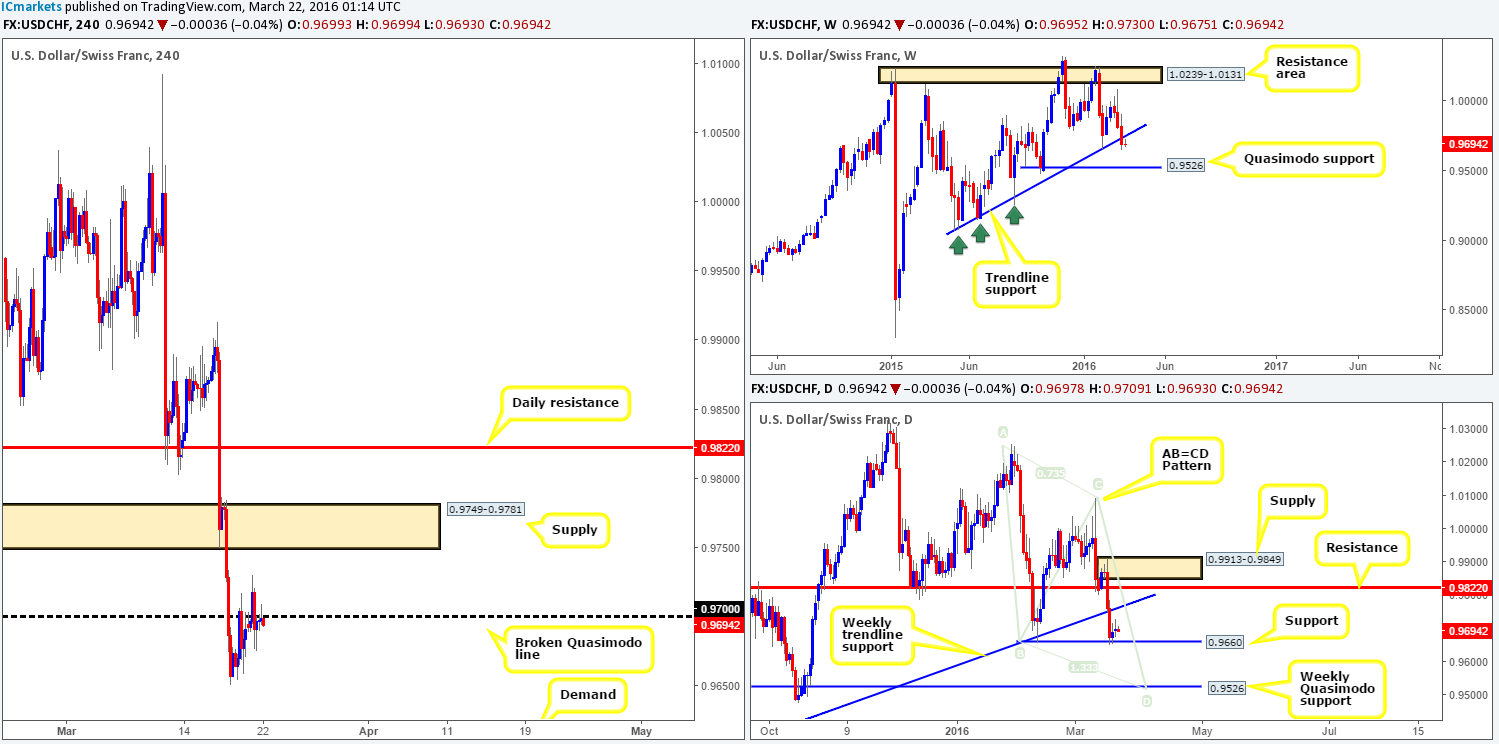
Levels to watch/live orders:
- Buys: Flat (Stop loss: N/A).
- Sells: 0.9700 region [Tentative – confirmation required] (Stop loss: dependent on where one confirms this level).
DOW 30:
Reporting directly from the weekly timeframe this morning, one can see that price recently edged higher within supply at 17752-17552, resulting in the DOW crossing swords with a trendline resistance taken from the high 18365. Considering how strong the selling momentum was from this supply base, it’s unlikely that the bulls are going to just breeze through this area!
Jumping across to the H4 chart, supply (now acting demand) chalked in at 17606-17538 was taken out during the course of yesterday’s sessions. As a result of this, all eyes are now on the H4 resistance area at 17811-17736 since the underside of this small zone is positioned within the extremes of the weekly supply discussed above. Therefore, should price reach this H4 area today, we would, dependent on the approach and the time of day, look to short here at market with our stops placed above at 17830. Targets will be decided upon once price connects with the sell zone since we would want to analyze the approach structure before deciding on the first take-profit area.
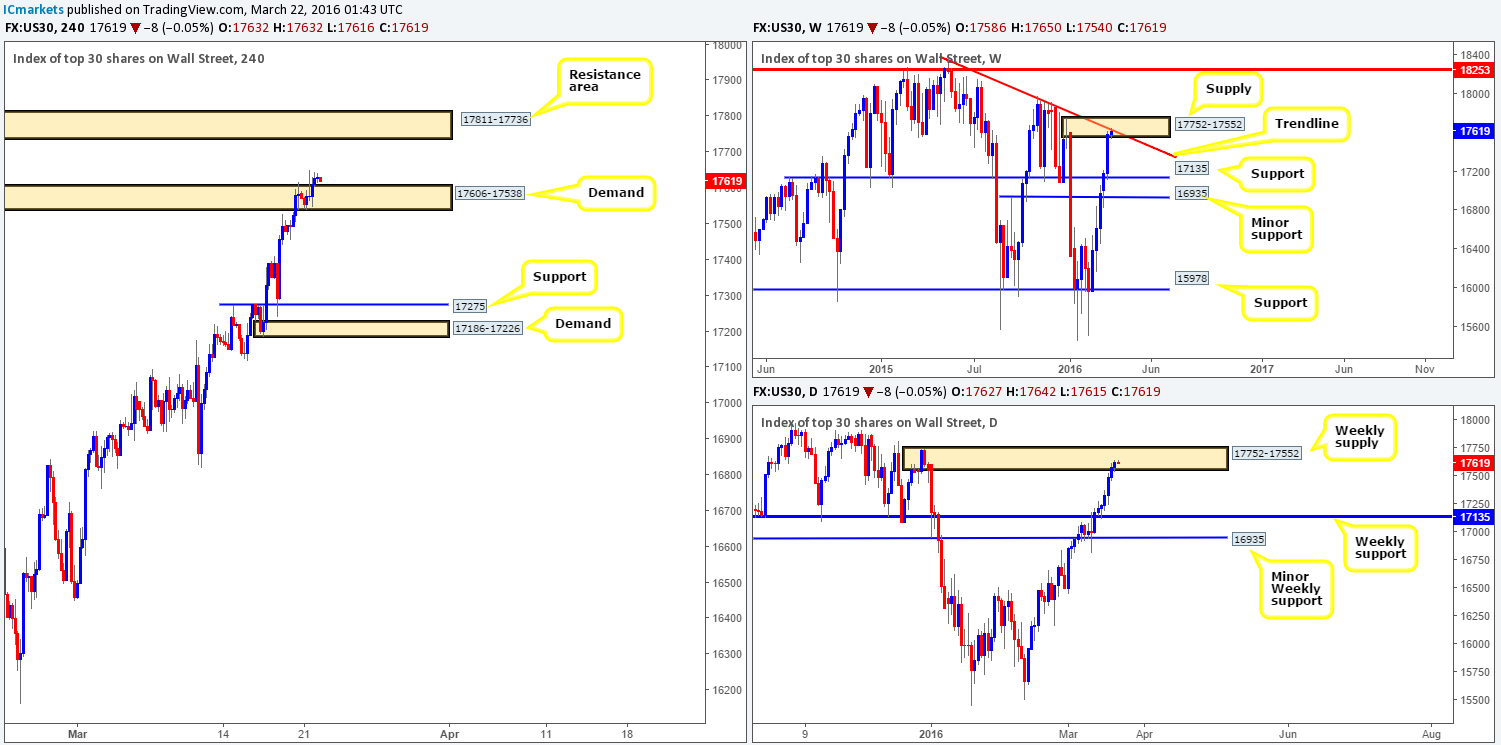
Levels to watch/live orders:
- Buys: Flat (Stop loss: N/A).
- Sells: 17726 (Stop loss: 17830).
XAU/USD: (Gold)
Shortly after the Gold market opened (1254.5) H4 action plummeted south, breaking below Friday’s low 1247.7, followed by a drive into bids around demand chalked up at 1237.2-1243.9. The reaction from this area, other than the two candle wicks north at 1249.1/1248.1 which attacked Friday’s low as resistance, has so far not registered much meaning in our opinion.
Looking across to the weekly chart, we see little direction on this timeframe as price remains loitering mid-range between supply at 1307.4-1280.0 and support drawn from 1224.1. Turning our attention to the daily chart, however, support (now acting resistance) at 1246.4 was consumed yesterday opening the path south, albeit a small one, down to demand coming in at 1224.6-1238.3.
In view of the current structure, we only have interest in one area today and that is the H4 demand seen at 1224.6-1230.8. The reason being is simply because it’s bolstered by the aforementioned weekly support and sits within the extremes of the above said daily demand zone. Before going long from here, nevertheless, we would like to see what the lower timeframes response is. If we manage to pin down a buy signal on a lower scale (see top of page for confirmation techniques), we’ll confidently buy the yellow metal, targeting the first supply formed on approach. Another reason for requiring confirmation here is due to the weekly level being positioned just BELOW the H4 demand, thus indicating a fakeout of this zone could be seen!
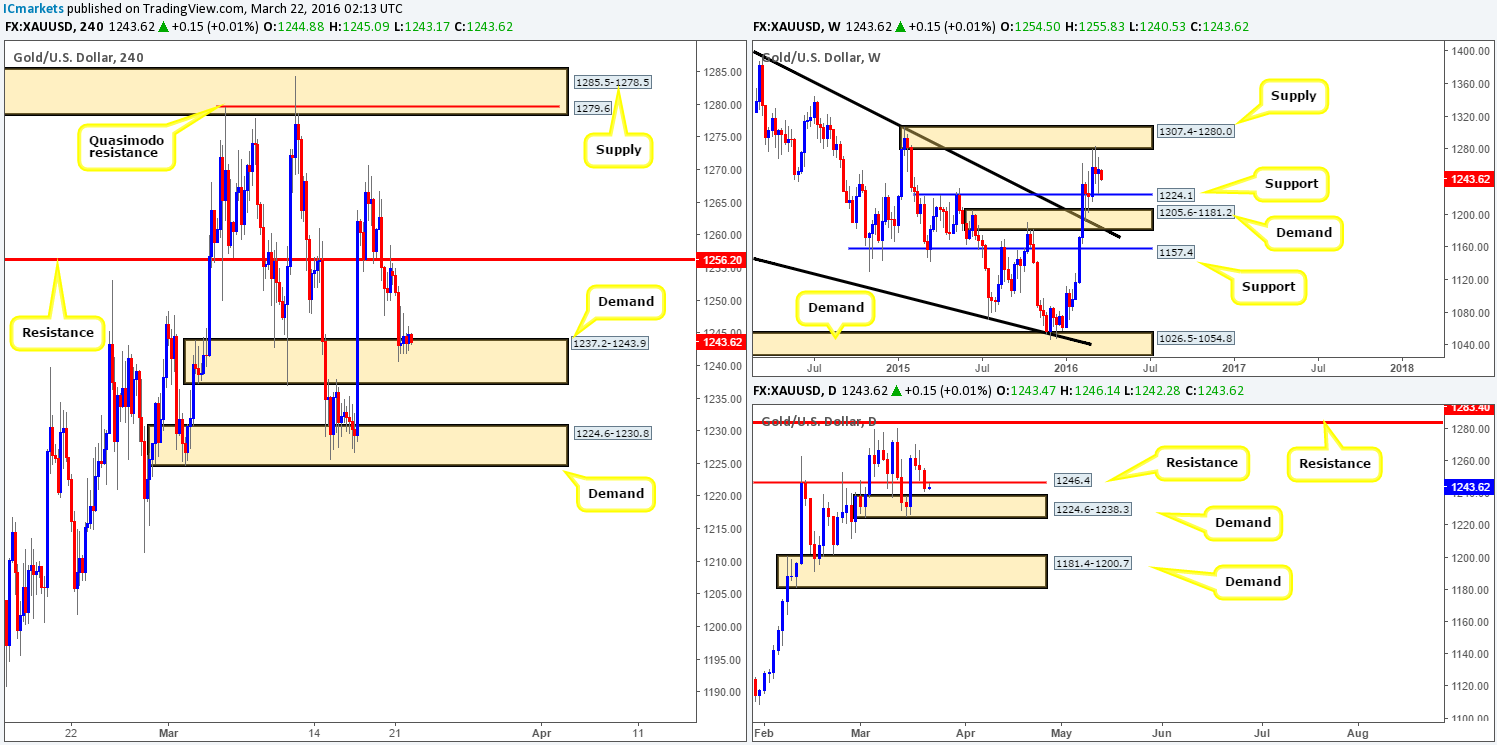
Levels to watch/live orders:
- Buys: 1224.6-1230.8 [Tentative – confirmation required] (Stop loss: dependent on where one confirms this area).
- Sells: Flat (Stop loss: N/A).


