
EUR/USD:
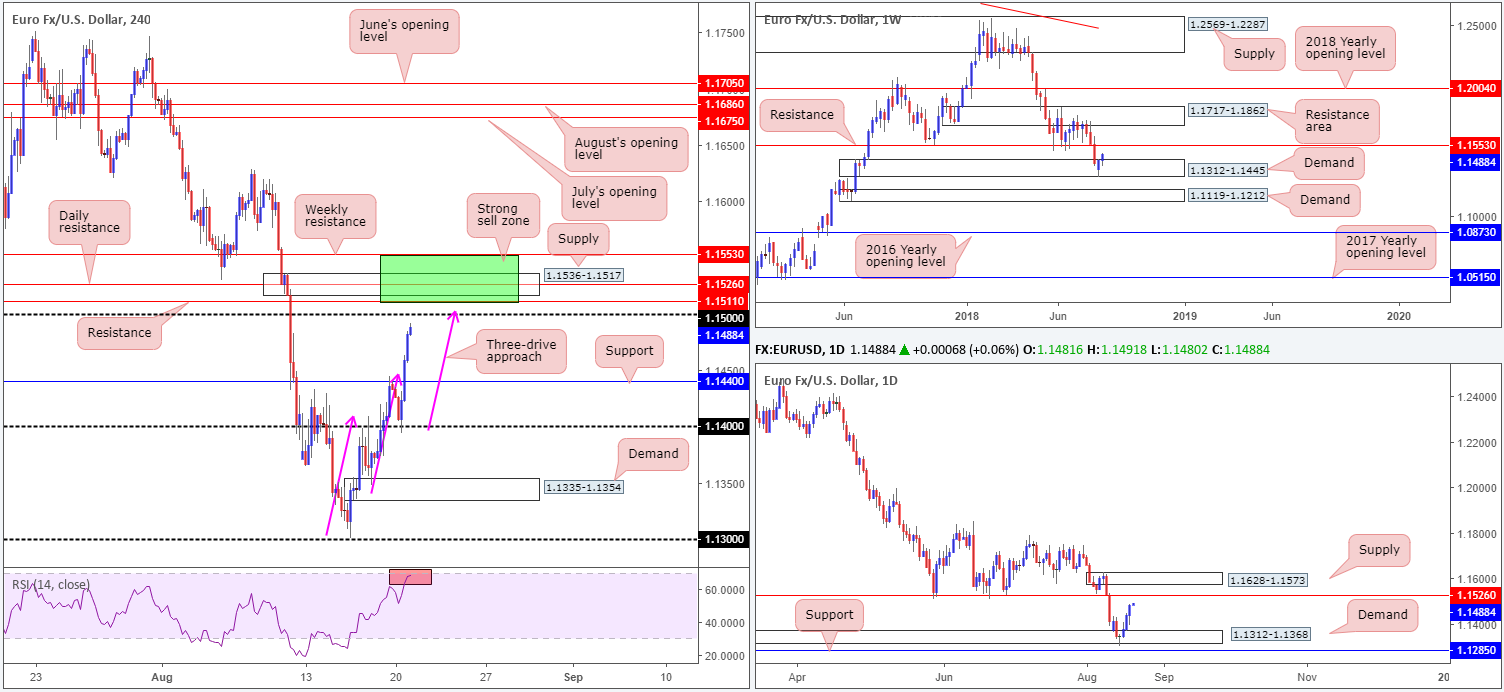
EUR/USD bulls were on fine form during Monday’s session, largely buoyed by a waning US dollar. USD downside was exacerbated amid US trade on comments from US President Trump, where he reiterated disagreement with the Fed’s decision to hike interest rates, saying he is not thrilled with Powell for doing so.
Following a break of H4 resistance at 1.1440 (now acting support level), the pair gathered momentum and settled for the day just south of the 1.15 handle, recording its fourth consecutive daily gain. Beyond this psychological number, a collection of notable resistances are observed (green zone): H4 resistance seen at 1.1511, H4 supply at 1.1536-1.1517 which happens to envelope daily resistance at 1.1526, followed by weekly resistance at 1.1553. Also note the H4 three-drive approach (pink arrows) that terminates a few pips above 1.15, along with the H4 RSI indicator testing overbought territory.
Areas of consideration:
With heavy resistance seen above 1.15 between 1.1553/1.1511, entering long on the breakout of 1.15 is likely to end in drawdown. Ultimately, the team has noted to keep eyeballs on H4 action once, or indeed if, price engages with the noted green area for possible shorts. A full or near-full-bodied bearish candle printed within this neighborhood would, given resistances seen coming together from all three timeframes here, likely be enough to draw in sellers and reclaim 1.15. Stop-loss orders are best placed beyond 1.1553, with the first take-profit target set at 1.1440: the recently broken H4 resistance.
Today’s data points: Limited.
GBP/USD:
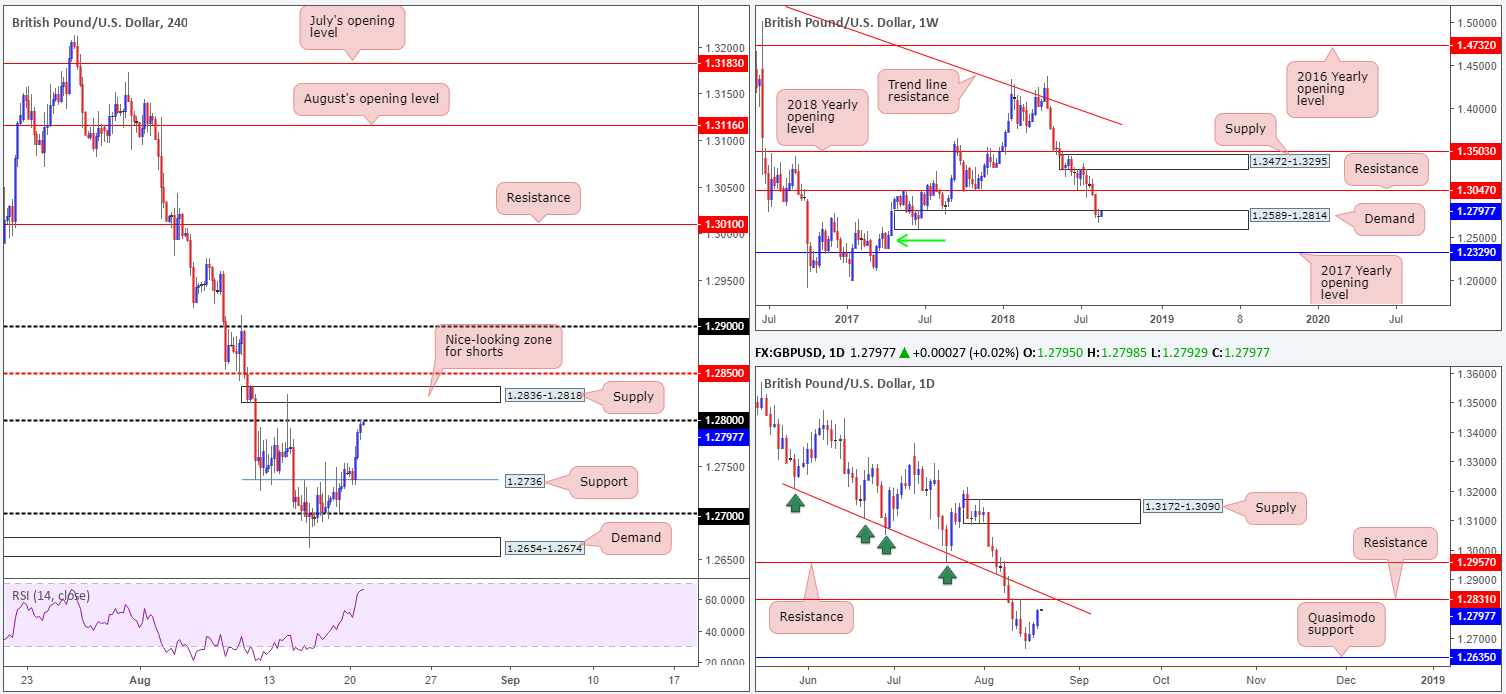
The British pound, as you can see, outperformed its US counterpart on Monday, bolstered by USD weakness amid further criticism of the Fed from US President Trump.
As is evident from the H4 timeframe, the unit retested support at 1.2736 and made a run towards the 1.28 handle. For those who read Monday’s report you may recall this move was highlighted as a possibility, therefore well done to anyone who jumped aboard here! Above 1.28 we can see strong H4 supply registered at 1.2836-1.2818, followed closely by H4 mid-level resistance at 1.2850.
Meanwhile, weekly action remains firmly within the walls of demand at 1.2589-1.2814. Having seen this area tested once already in August 2017, though, further selling could be seen. Beyond the current zone, demand marked with a green arrow at 1.2365-1.2555 is likely the next hurdle in the firing range, though with the 2017 yearly opening level lurking just beneath it at 1.2329, there’s a possibility price could fake lower to bring in buyers from this hurdle.
Two main structures decorate the daily timeframe at the moment. Resistance at 1.2813 is an interesting level due to it seen converging closely with trend line resistance (taken from the low 1.3204). To the downside, a Quasimodo support at 1.2635 is seen, which, as you can probably see, is situated within the walls of the current weekly demand zone.
Areas of consideration:
Selling from 1.15, although likely tempting for most, is considered low-probability according to the overall structure. The H4 supply area seen above it at 1.2836-1.2818 is the better option it seems, given the stop-loss orders above 1.15 will likely act as liquidity for pro traders to sell, along with the H4 area housing the daily resistance level mentioned above at 1.2831. The only drawback here, of course, is the weekly demand currently in play at 1.2654-1.2674. For that reason, traders are urged to trade carefully.
Today’s data points: UK public sector net borrowing.
AUD/USD:
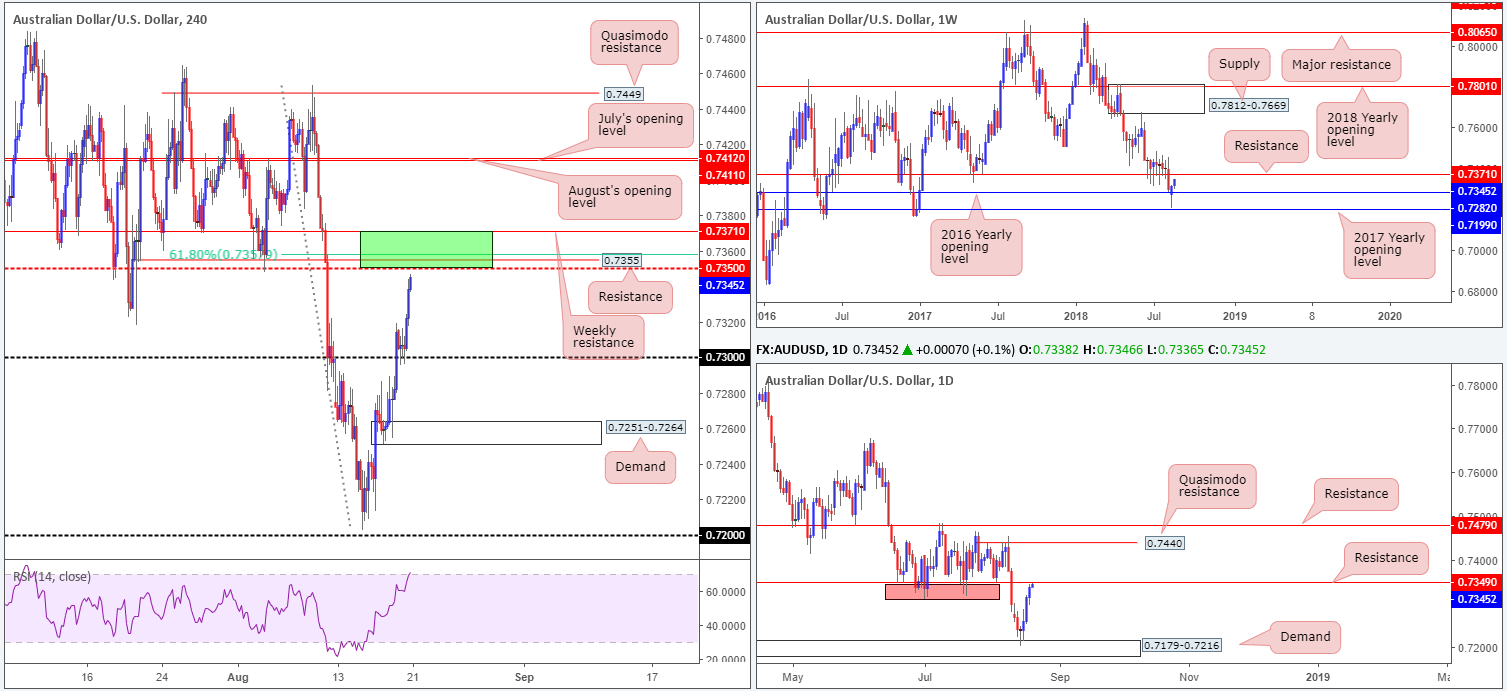
Supported by a reasonably well-bid US equity market and a fading US dollar, the commodity currency registered its third consecutive daily gain on Monday, concluding the day just south of a H4 mid-level resistance at 0.7350.
0.7350 is interesting. Besides converging closely with a H4 resistance at 0.7355, a 61.8% Fib resistance at 0.7357 and a daily resistance level at 0.7349, we can also see weekly resistance planted directly above these levels at 0.7371. Therefore, between 0.7371 and 0.7349 (22-pip zone – green area marked on the H4 timeframe) this area holds a healthy portion of resistance!
Areas of consideration:
Keeping it Simple Simon today, 0.7371/0.7349 is an area to consider watching for shorts. Traders are, however, urged to wait for additional candle confirmation to form before pulling the trigger. This is to help avoid being whipsawed out of a position on a fakeout through the weekly resistance level: the top edge of the green sell zone at 0.7371.
A H4 full or near-full-bodied bearish candle printed within 0.7371/0.7349 would, technically speaking, be ideal, targeting the 0.73 handle as the initial take-profit zone (stop-loss orders can either be positioned above the rejecting candle’s wick, or above 0.7371).
Today’s data points: RBA monetary policy meeting minutes.
USD/JPY:
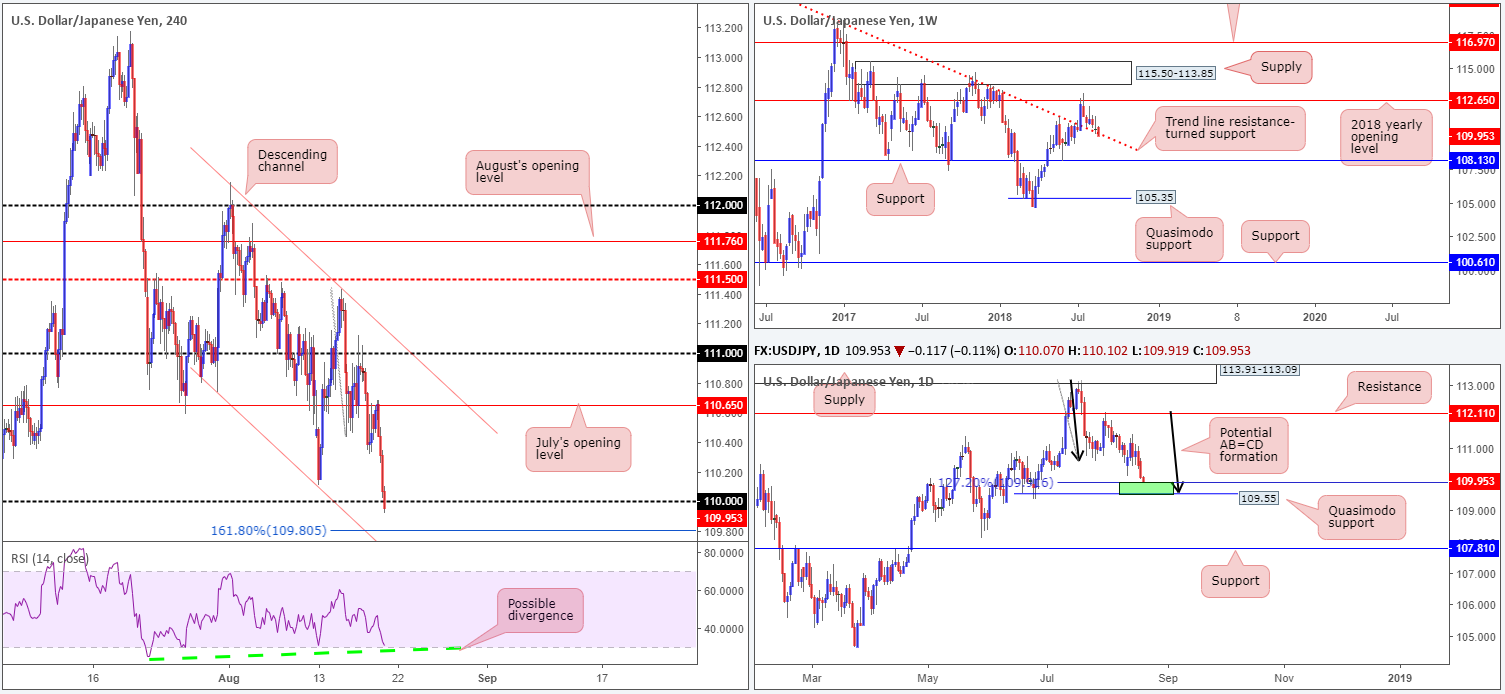
In recent hours, the USD/JPY overlapped the 110 handle seen on the H4 timeframe, following a somewhat bearish Monday on further criticism of the Fed from US President Trump.
While the break of 110 has likely enticed breakout traders into the fold, traders are urged to exercise caution here. H4 structure displays nearby support in the form of a 161.8% Fib ext. point at 109.80 that fuses closely with a channel support (taken from the low 110.73). In the technical domain, this is considered an ‘alternate AB=CD pattern’ (developed by Scott Carney). Also notable is the H4 RSI indicator nearing oversold terrain, along with a possible divergence play.
Weekly movement, as you can see, remains toying with a trend line resistance-turned support (taken from the high 123.57). Having seen this line hold firm as resistance on a number of occasions in the past, it’s likely to remain a defensive barrier going forward. In conjunction with weekly flow, an AB=CD formation (black arrows) recently completed around the 127.2% Fib ext. point at 109.91, which happens to be positioned nearby a Quasimodo support at 109.55 (green area).
Areas of consideration:
Longs off the 161.8% Fib ext. at 109.80 on the H4 timeframe are an option today, placing stop-loss orders beneath 109.55: the daily Quasimodo support level, and targeting a close back above 110 (this would be sufficient enough to consider reducing risk to breakeven).
Today’s data points: Limited.
USD/CAD:
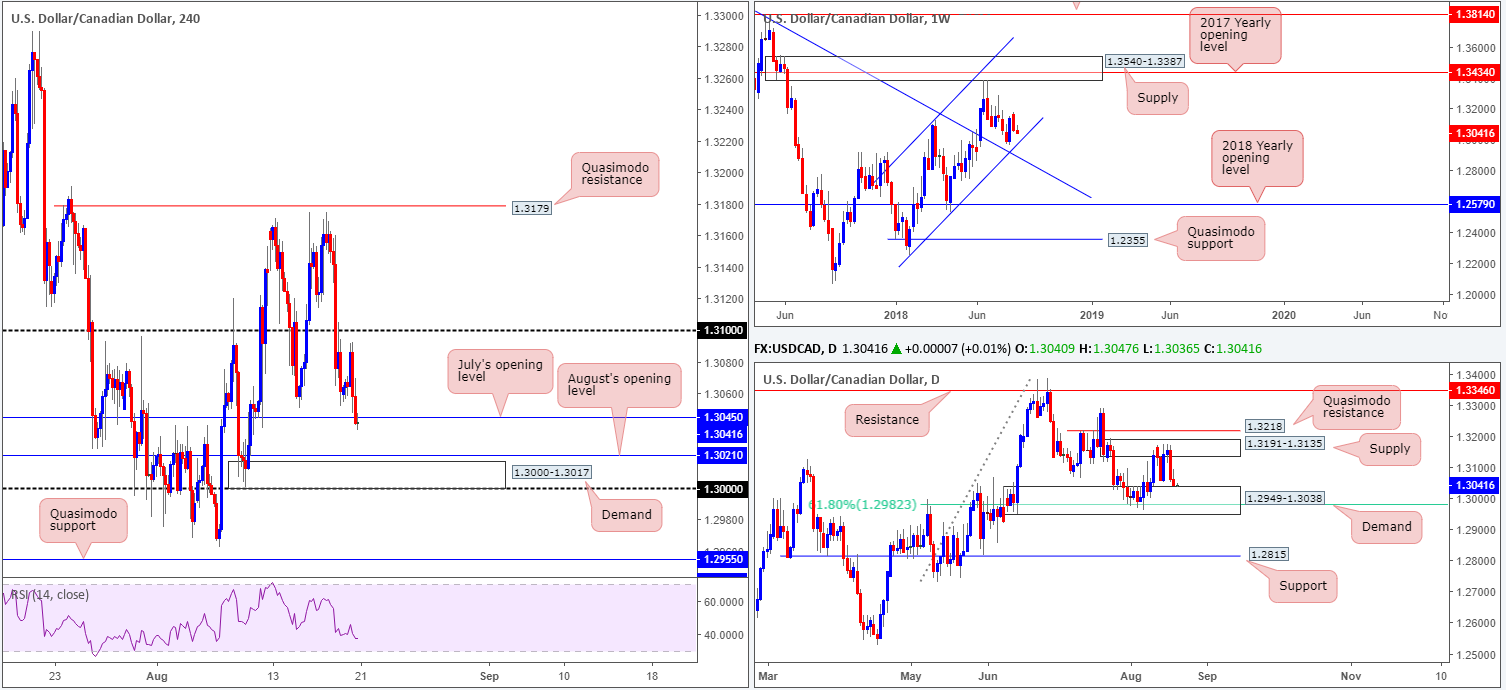
USD/CAD bulls lost their flavor just south of the 1.31 handle on Monday, as trade entered US hours. Likely bolstered by strong oil prices and a fragile US dollar (exacerbated on Trump’s fresh criticism of the Fed), the H4 candles tested waters beneath July’s opening level at 1.3045, challenging the top edge of daily demand at 1.2949-1.3038 (houses a 61.8% Fib support value at 1.2982). Beneath July’s opening level, August’s opening level at 1.3021 is the next port of call, shadowed closely by H4 demand at 1.3000-1.3017 (formed on top of the key figure 1.30).
Since the beginning of the year, weekly movement has been compressing within an ascending channel formation (1.2247/1.3098). Of late, though, traders may have noticed the unit basing just north of the lower edge of this channel, strengthened by additional support in the form of a nearby trend line resistance-turned support (etched from the high 1.4689).
Areas of consideration:
The H4 demand at 1.3000-1.3017 remains an area of interest. Besides forming on top of the key figure 1.30, it is positioned a few pips beneath August’s opening level at 1.3021 and is also sited within the walls of the current daily demand area. Therefore, a bounce from this zone is expected. However, traders are still urged to wait for additional candle confirmation to form here (a full or near-full-bodied H4 bull candle) before pulling the trigger, since round numbers (1.30) are prone to fakeouts. On top of this, there’s also a chance weekly sellers may push price lower to reach the weekly channel support.
Today’s data points: Limited.
USD/CHF:
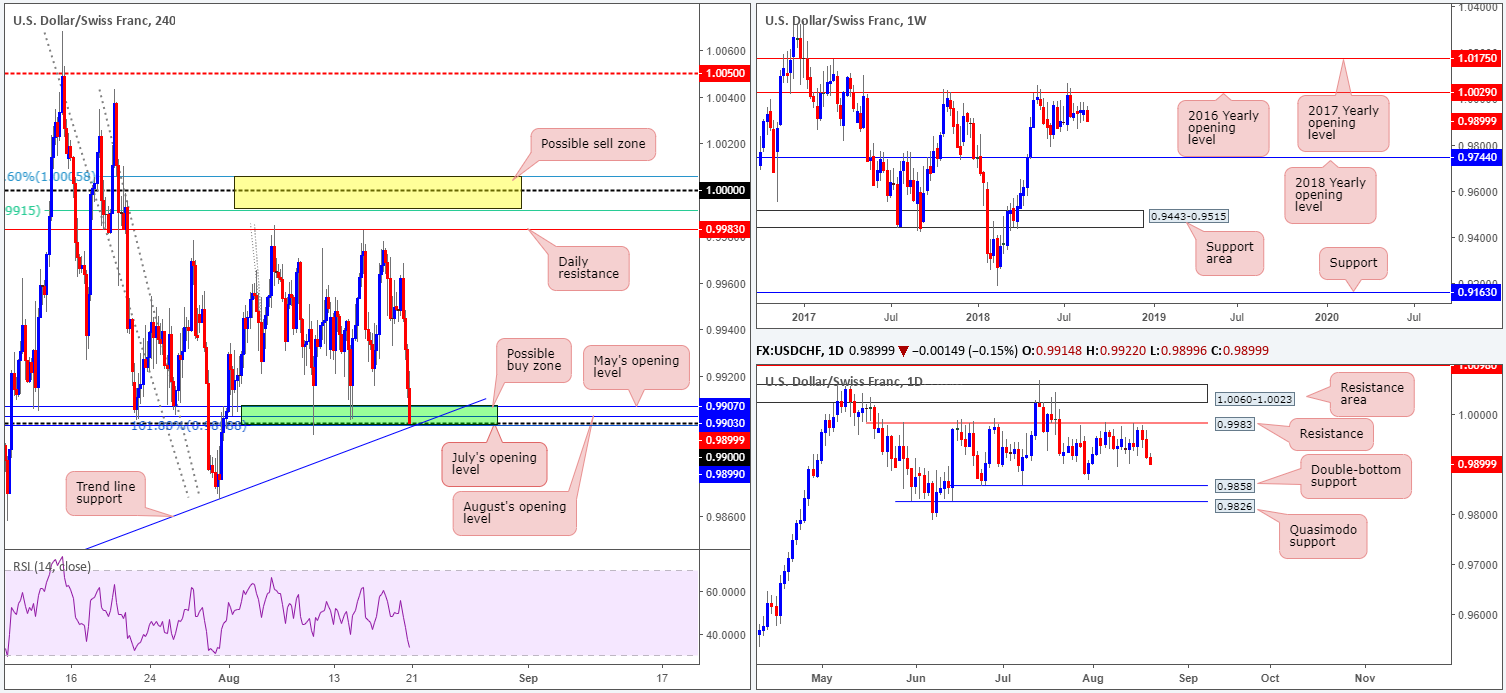
Broad-based USD weakness was observed on Monday, consequently weighing on the USD/CHF. Latest movements, as you can see, has aggressively pressured the H4 candles back into a H4 buy zone marked in green at 0.9899/0.9907 (comprised of July’s opening level at 0.9899, a 161.8% Fib ext. point at 0.9899 [taken from the high 0.9984], the 0.99 handle, August’s opening level at 0.9903 and May’s opening level at 0.9907). Note, we also have H4 trend line support (taken from the low 0.9788) converging with the lower edge of this zone!
Should the market witness a break of the current H4 green zone at 0.9899/0.9907, further losses towards 0.9858 could be on the cards: a double-bottom daily support, shadowed closely by a daily Quasimodo support at 0.9826.
Areas of consideration:
The H4 buy zone highlighted on the H4 chart in green remains of interest despite strong USD selling on Monday. Traders are urged to wait for additional H4 candle confirmation to print here before pressing the buy button, preferably in the shape of a full or near-full-bodied bull candle (stop-loss orders can then be positioned beyond the extreme of this formation). The reason being is round numbers (0.99) tend to attract ‘stop runs’ (fakeouts). There’s little worse than having your stop-loss order triggered by a hair only to watch price shortly after hit your initial take-profit area, which in this case would be daily resistance at 0.9983.
Today’s data points: Limited.
Dow Jones Industrial Average:
US equities ended the day in positive terrain on Monday, as the market trades on hope of a positive outcome from upcoming trade negotiations between China and the US. Despite this, US President Trump has stated there’s no time-frame for ending the China trade dispute, and does not anticipate much coming from the trade talks with China this week.
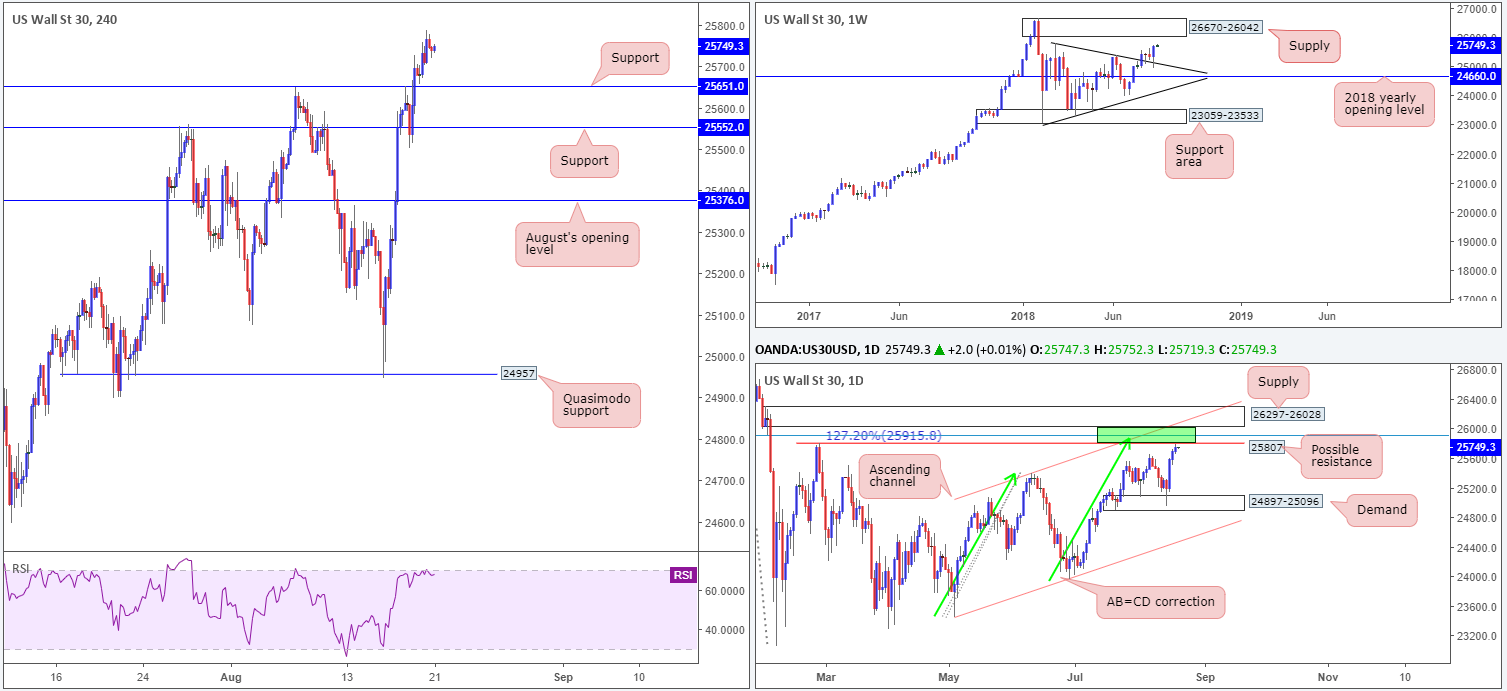
On the weekly timeframe, the market recently observed a strong retest of a trend line resistance-turned support (etched from the high 25807). In view of this, a run up to supply coming in at 26670-26042 is a possible scenario to keep tabs on this week.
In conjunction with weekly action, daily supply at 26297-26028 is an interesting area. Not only does it boast strong downside momentum from its base and is seen glued to the underside of the noted weekly supply, it converges closely with an area of confluence: daily channel resistance (taken from the high 25399), a daily resistance level at 25807 (Feb 27 high), a 127.2% daily AB=CD (green arrows) correction point at 25915 and a 78.6% daily Fib resistance at 25904 (green zone).
A quick look at recent dealings on the H4 scale shows support at 25654 (prior double-top formation) is seen below current price, while the next upside target on this timeframe falls in at resistance drawn from 25923 (not seen on the screen). Also worth noting is the H4 RSI indicator is seen teasing overbought territory.
Areas of consideration:
The H4 resistance mentioned above at 25923 is certainly an area worth watching this week. Positioned nicely within the daily area of (green) confluence, a response from this angle is likely. Yet, do not go into this full throttle! There’s a chance this level could break as the index may want to test the underside of daily supply at 26297-26028 or even bring the market towards weekly supply at 26670-26042. For that reason, tread carefully!
Should the market retest H4 support at 25654 (before reaching the green area of confluence on the daily timeframe), longs from this angle are also an option. Waiting for a full or near-full-bodied H4 bull candle to form, however, is advised. This will help avoid being taken out on a fakeout and offers an area to position stops (below the rejection candle’s tail).
Today’s data points: Limited.
XAU/USD (Gold)
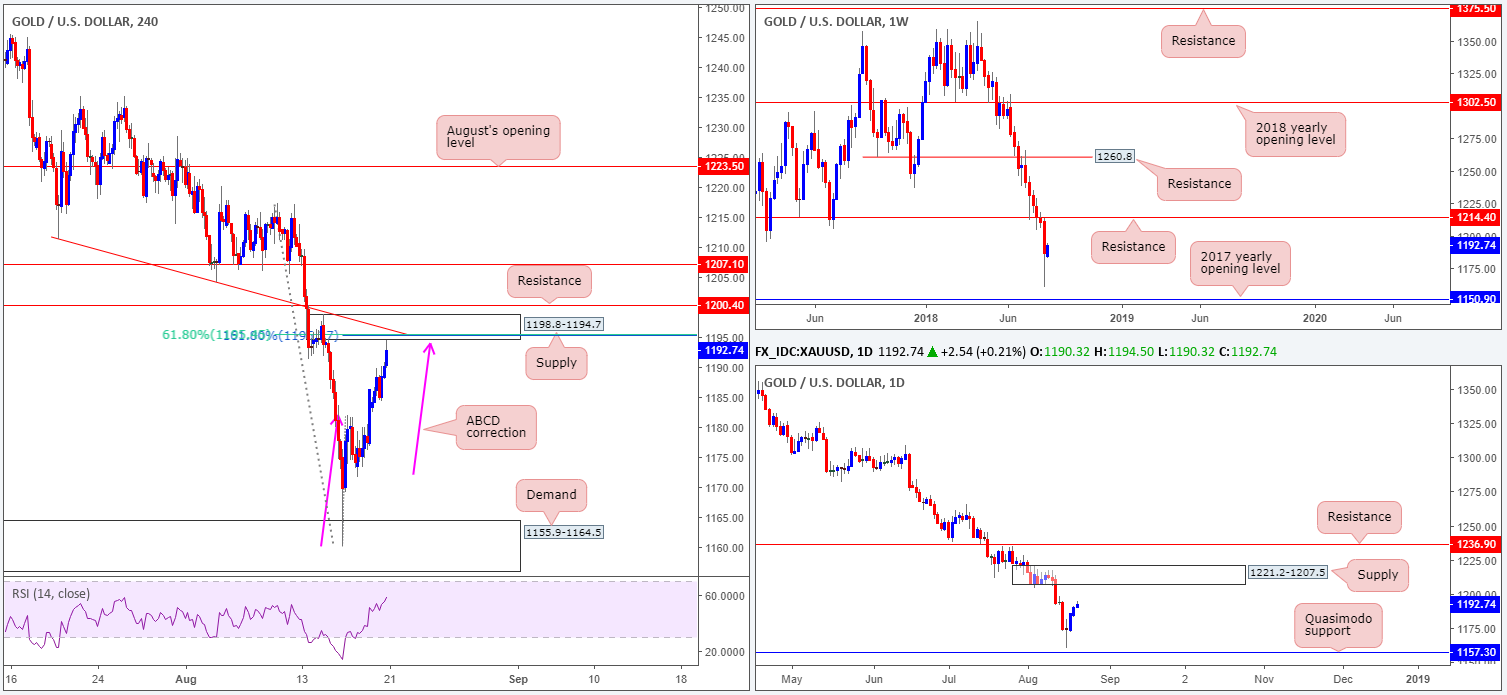
As the greenback continues to search for lower levels, the yellow metal looks to climb higher. Recording its second consecutive daily gain on Monday, the H4 candles are now seen trading within touching distance of a rather interesting area of supply at 1198.8-1194.7. What’s also notable from a technical perspective is the potential ABCD correction (pink arrows) completing within the lower limits of the noted supply at 1195.3 (161.8% Fib ext. point). This – coupled with a trend line resistance (taken from the low 1211.2) and a 61.8% Fib resistance at 1195.5 – marks a highly confluent supply zone.
The only drawback is higher-timeframe structure displays limited resistance around the aforementioned H4 supply. Weekly price has room to stretch as far north as resistance at 1214.4, while daily price appears poised to tackle supply at 1221.2-1207.5 – both zones located above the current H4 supply.
Areas of consideration:
The H4 supply area mentioned above at 1198.8-1194.7 boasts strong H4 confluence for a possible short. The only concern, as mentioned above, is the limited higher-timeframe convergence. Does that mean we should ignore the H4 confluence? Definitely not! Traders are, however, urged to wait and assess H4 price action before pulling the trigger at the aforementioned H4 supply. A full or near-full-bodied bearish candle printed from this area would likely be enough to draw in sellers and pull the market lower. Stop-loss orders can be positioned above the rejecting candle’s wick, with the first take-profit target set at the 38.2% Fib support (taken from the low 1160.0 and the completing point of the H4 ABCD).
The use of the site is agreement that the site is for informational and educational purposes only and does not constitute advice in any form in the furtherance of any trade or trading decisions.
The accuracy, completeness and timeliness of the information contained on this site cannot be guaranteed. IC Markets does not warranty, guarantee or make any representations, or assume any liability with regard to financial results based on the use of the information in the site.
News, views, opinions, recommendations and other information obtained from sources outside of www.icmarkets.com.au, used in this site are believed to be reliable, but we cannot guarantee their accuracy or completeness. All such information is subject to change at any time without notice. IC Markets assumes no responsibility for the content of any linked site. The fact that such links may exist does not indicate approval or endorsement of any material contained on any linked site.
IC Markets is not liable for any harm caused by the transmission, through accessing the services or information on this site, of a computer virus, or other computer code or programming device that might be used to access, delete, damage, disable, disrupt or otherwise impede in any manner, the operation of the site or of any user’s software, hardware, data or property.


