
A note on lower timeframe confirming price action…
Waiting for lower timeframe confirmation is our main tool to confirm strength within higher timeframe zones, and has really been the key to our trading success. It takes a little time to understand the subtle nuances, however, as each trade is never the same, but once you master the rhythm so to speak, you will be saved from countless unnecessary losing trades. The following is a list of what we look for:
- A break/retest of supply or demand dependent on which way you’re trading.
- A trendline break/retest.
- Buying/selling tails/wicks – essentially we look for a cluster of very obvious spikes off of lower timeframe support and resistance levels within the higher timeframe zone.
- Candlestick patterns. We tend to stick with pin bars and engulfing bars as these have proven to be the most effective.
We search for lower timeframe confirmation between the M15 and H1 timeframes, since most of our higher-timeframe areas begin with the H4. Stops are usually placed 5-10 pips beyond confirming structures.
EUR/USD:
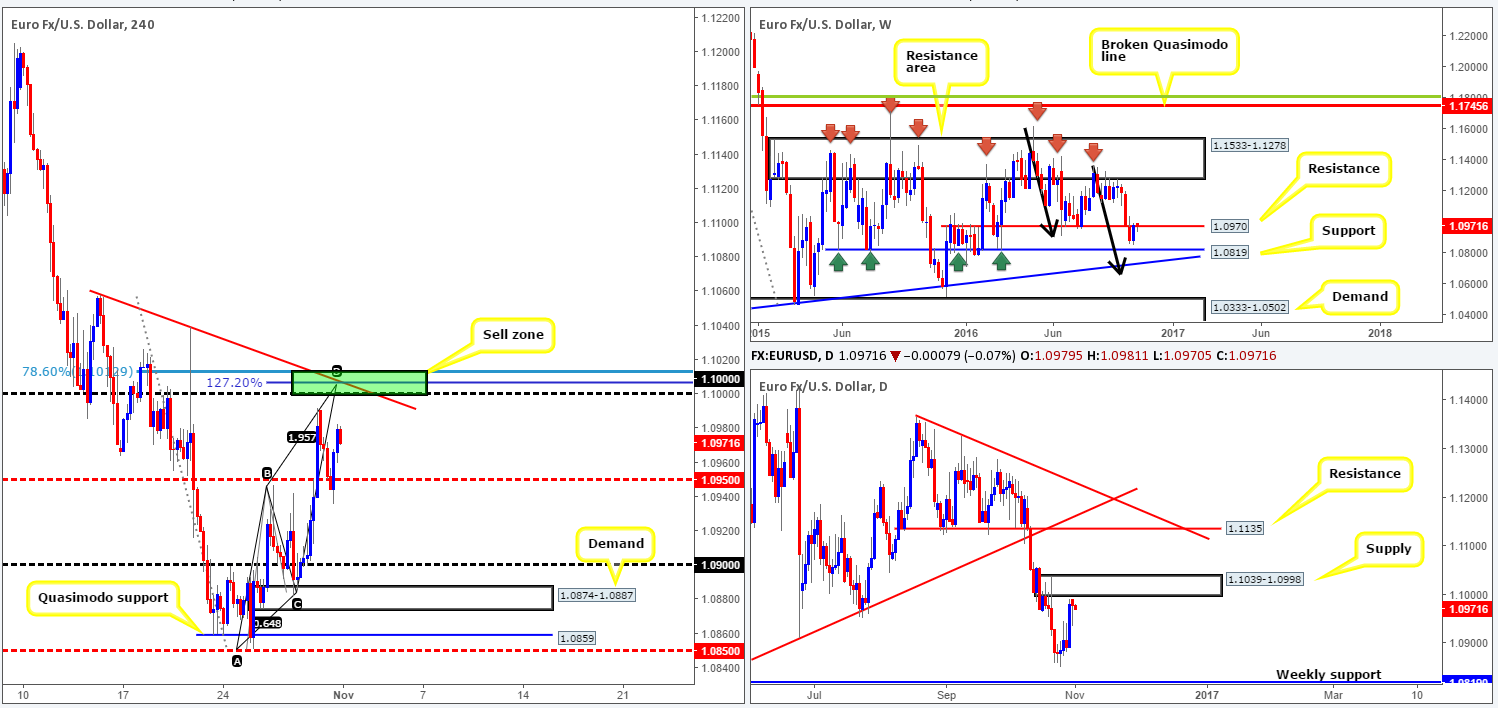
Following Sunday’s minor gap north, the EUR sold off and shook hands with the H4 mid-way support 1.0950 going into the London open. The sellers, as you can see, attempted to push beyond this hurdle, but failed as strong buyers stepped in as US traders entered the fight, consequently rounding off the day two pips below Friday’s close. With this in mind, and very little change seen to the market’s technical structure, much of the following analysis will echo thoughts put forward in Monday’s weekly report.
Over on the weekly picture, the unit marginally closed above resistance coming in at 1.0970. Until we see a more decisive close beyond this level, we remain unsure as to whether this is a genuine signal to trade higher. Despite the weekly candle closing above a resistance, the daily chart depicts a slightly different picture as supply at 1.1039-1.0998 is now seen within touching distance. Our desk would need to see this zone taken out before we’d consider the close above the aforementioned weekly resistance to be valid.
Our suggestions: The 1.10 handle remains our key point of interest today. Not only does this number denote the lower edge of the above said daily supply zone, it’s also positioned nearby a H4 alternate AB=CD completion point at 1.1005, a H4 trendline resistance extended from the high 1.1058 and a H4 78.6% Fib resistance level at 1.1012 (green rectangle). In view of the confluence seen around the 1.10 mark, and the uncertainty surrounding the weekly candle’s close (see above), we feel a short from 1.10 is a valid call. To give the trade some room to breathe we would advise placing stops above the current H4 trendline at around the 1.1025ish range. If you prefer, however, you could always wait for price to confirm bearish intent here in the form of a H4 bearish close, but this would likely get you in at a worse price and significantly reduce the risk/reward down to the first take-profit target: the H4 mid-way support 1.0950.
Data points to consider: On the data front today, we have the US ISM manufacturing report scheduled for release at 2pm GMT. This is considered to be a leading indicator, and is a market-moving event. Therefore, do remain vigilant during this time!
Levels to watch/live orders:
- Buys: Flat (stop loss: N/A).
- Sells: 1.10 ([pending order] stop loss: 1.1025).
GBP/USD:
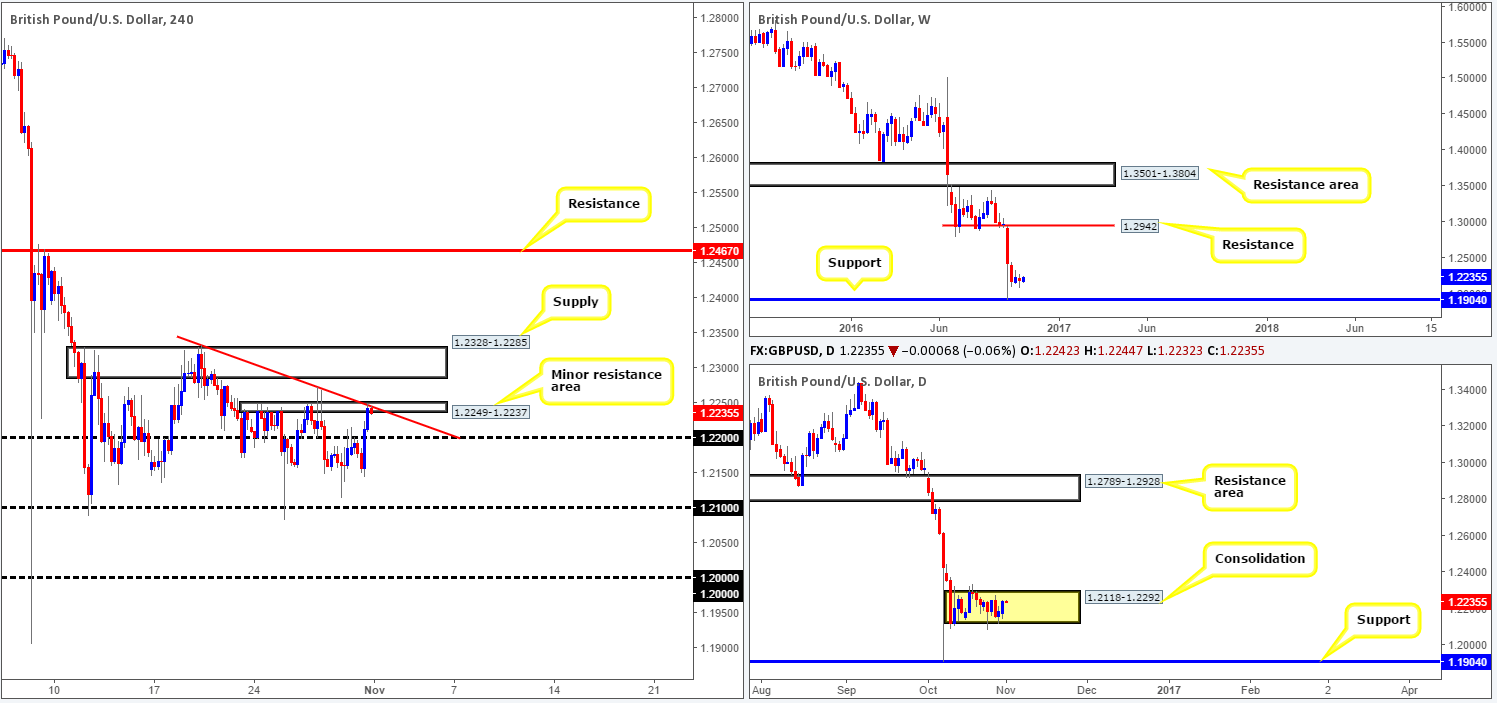
Despite the GBP catching an offer from the 1.22 handle in the early hours of yesterday’s trading, dollar weakness helped bid the unit higher going into the US session. As a result of this, 1.22 was engulfed, leaving price free to test the minor H4 resistance area at 1.2249-1.2237 (converges with H4 trendline resistance taken from the high 1.2332) by the day’s end.
Unless a decisive close is seen above both the aforementioned H4 resistance area, and the H4 supply sitting directly above it at 1.2328-1.2285, our team would not be comfortable buying this market. A close above this supply would also take out the top edge of the daily range (1.2292), thus potentially clearing the path north toward H4 resistance at 1.2467. To become sellers, however, a close below the 1.21 neighborhood would be ideal, since this takes out the lower edge of the daily consolidation (1.2118) and opens up downside to the key figure 1.20. Nevertheless, do keep in mind that by shorting here, you’re effectively selling into a large monthly demand which can be seen here:
Our suggestions: Once a close is seen (see above in bold), we would require a subsequent retest of that area followed up by a H4 candle close to permit a trade. Patience is key here as this is not the most attractive market to trade right now!
Data points to consider: The UK’s manufacturing PMI report at 9.30am, along with the US ISM number at 2pm GMT.
Levels to watch/live orders:
- Buys: Watch for a close above the H4 supply at 1.2328-1.2285 and then look to trade any retest seen thereafter (H4 bullish close required – stop loss: ideally beyond the trigger candle).
- Sells: Watch for a close below the 1.21 handle and then look to trade any retest seen thereafter (H4 bearish close required – stop loss: ideally beyond the trigger candle).
AUD/USD:
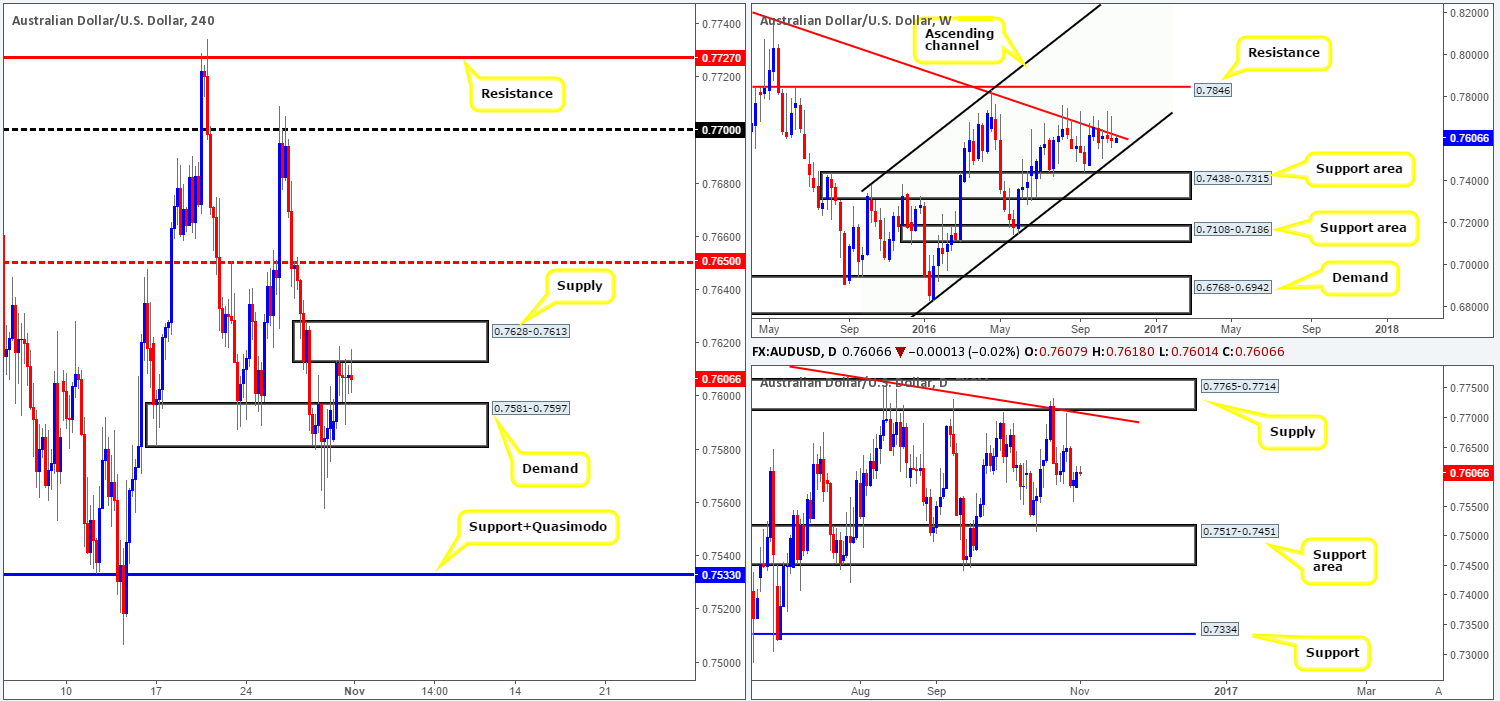
Although the H4 buyers opened the week on a strong footing, they failed to sustain gains beyond the H4 supply at 0.7628-0.7613. As of this point, the buyers and sellers remain battling for position between the above said H4 supply and a H4 demand coming in at 0.7581-0.7597.
In that the weekly chart recently chalked up its second consecutive selling wick that pierced through a trendline resistance extended from the high 0.8295, as well as room seen for the daily candles to drop lower and test a support area carved from 0.7517-0.7451 (intersects with the weekly ascending channel support line drawn from the low 0.6827 – the next downside target on the weekly timeframe), the above said H4 demand is vulnerable, in our opinion.
Our suggestions: Watch for price to close below the current H4 demand. Should this come into view, wait for a retest to the underside of this zone followed up by a H4 bearish close. Once this has been satisfied, a short from here is, at least in our book, valid down to the combined H4 support/Quasimodo at 0.7533 that sits directly above the aforementioned daily support area.
Data points to consider: We have Chinese manufacturing data at 1-1.45am, and a policy statement from the RBA (Reserve Bank of Australia) at 3.30am, which will both likely affect the Aussie currency. Furthermore, do keep an eye on the US ISM number being released at 2pm GMT.
Levels to watch/live orders:
- Buys: Flat (stop loss: N/A).
- Sells: Watch for a close below the H4 demand at 0.7581-0.7597 and then look to trade any retest seen thereafter (H4 bearish close required – stop loss: ideally beyond the trigger candle).
USD/JPY:
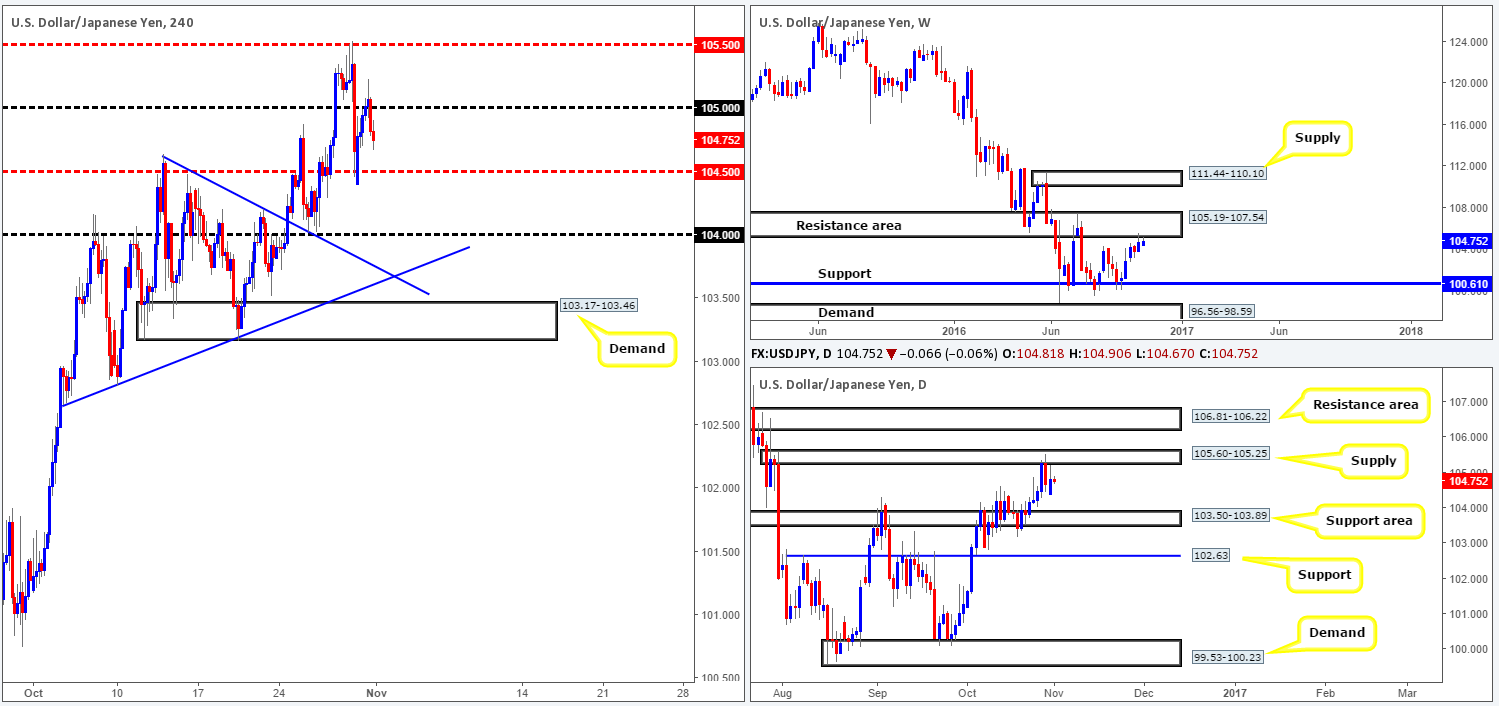
Kicking this morning’s report off with a quick look at the weekly chart, we can see that the candles remain loitering around the underside of a resistance area at 105.19-107.54. Bearing in mind that this barrier stretches as far back as 2014, we feel the buyers will have their work cut out for them if they intend on pushing things higher from here. In conjunction with the weekly chart, the daily candles also recently shook hands with a supply zone carved from 105.60-105.25, which happens to sit within the lower limits of the above said weekly resistance zone. In the event that bears remain in the driving seat here, the next target to have on your hit list falls in at 103.50-103.89: a support area.
Stepping across to the H4 chart, the pair steadied itself around the H4 mid-way support 104.50 following the week’s open and rallied to highs of 105.23 on the day. In yesterday’s report, we highlighted the possibility of the bulls defending 104.50 and bidding price back up to retest the 105 number for a short trade. Unfortunately, The H4 bearish close from here was too large for us to consider shorting.
Our suggestions: From a technical standpoint, we see very little standing in the way of price continuing to decline lower today. Should a close below 104.50 be seen, however, we would look to short down to 104 (essentially the top edge of the above mentioned daily support area) if price retested the underside of 104.50 and produced a H4 bearish close.
Data points to consider: BoJ statement sometime today along with US ISM figures due at 2pm GMT.
Levels to watch/live orders:
- Buys: Flat (stop loss: N/A).
- Sells: Watch for a close below the H4 mid-way support at 104.50 and then look to trade any retest seen thereafter (H4 bearish close required – stop loss: ideally beyond the trigger candle).
USD/CAD:
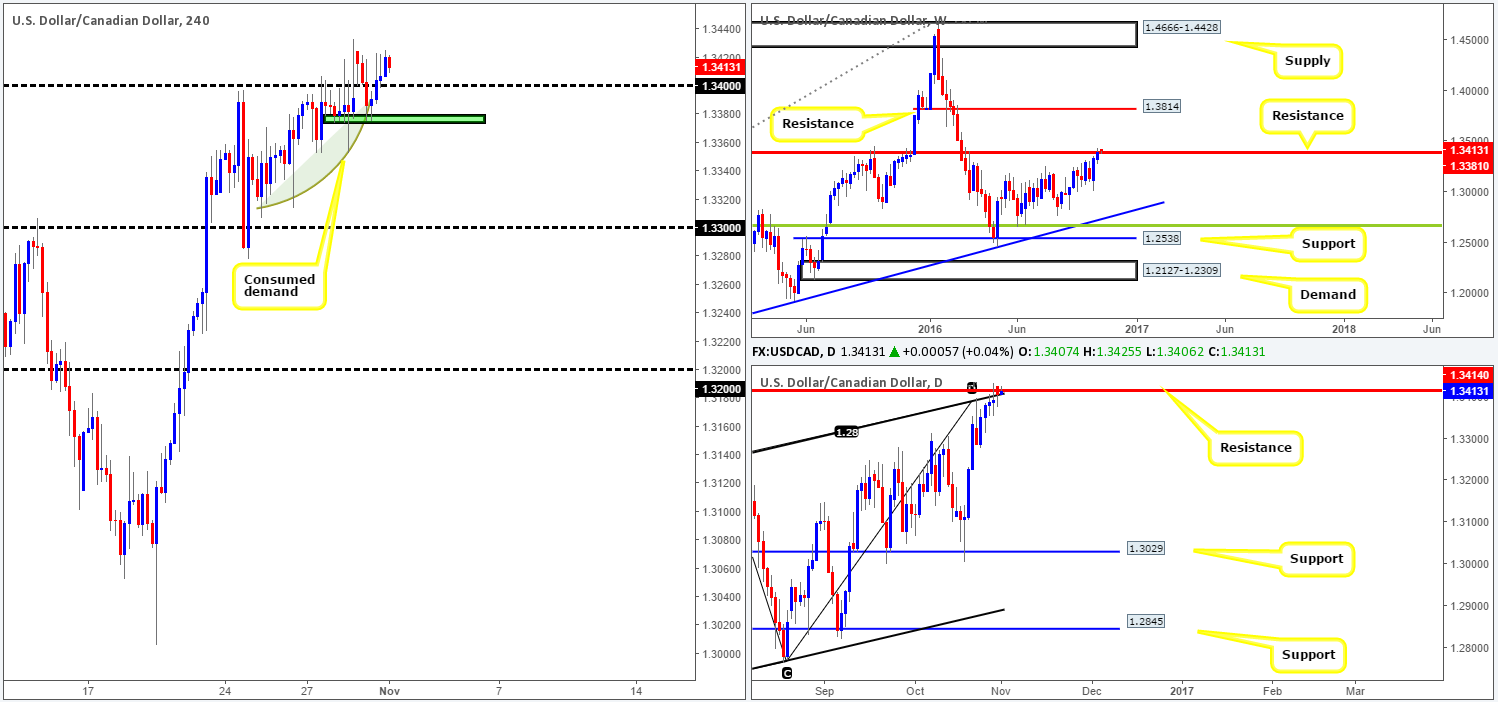
As of yesterday’s close, price was, and still is, seen trading above the 1.34 handle. In the event that the bulls remain above this number, there’s a chance that we may see the pair continue north towards the 1.35 boundary/H4 supply at 1.3555-1.3515. The reason is that we see very little active supply (check the history around the beginning of March 2016) to the left of current price between 1.34/1.35.
While a move higher seems a reasonable possibility on the H4 chart, let’s see where we stand on the higher-timeframe picture. The weekly chart shows that candle action closed the week slightly above the resistance level seen at 1.3381. In addition to this, there is a daily resistance level seen at 1.3414, which boasts an AB=CD completion point around the 1.3384ish range and a channel resistance taken from the high 1.3241. Therefore, there is a little divergence seen here.
Our suggestions: On account of the above points, here’s what we have jotted down so far:
- If price breaks through the H4 green shaded area at 1.3374-1.3379, then we see little active H4 demand stopping prices from challenging the 1.33 band. We would, however, only consider this a tradable move once we see price retest the underside of 1.3374-1.3379 and chalk up a H4 bearish close.
- On the other hand, if a daily close is seen above the current daily resistance at 1.3414, we would begin looking for buys up to the 1.35 barrier.
Data points to consider: CAD GDP at 12.30pm, BoC Gov. Poloz due to speak at the business council of British Columbia in Vancouver at 4pm, and also we have US ISM figures due at 2pm GMT.
Levels to watch/live orders:
- Buys: Flat (stop loss: N/A).
- Sells: Watch for a close below the H4 area at 1.3374-1.3379 and then look to trade any retest seen thereafter (H4 bearish close required – stop loss: ideally beyond the trigger candle).
USD/CHF:
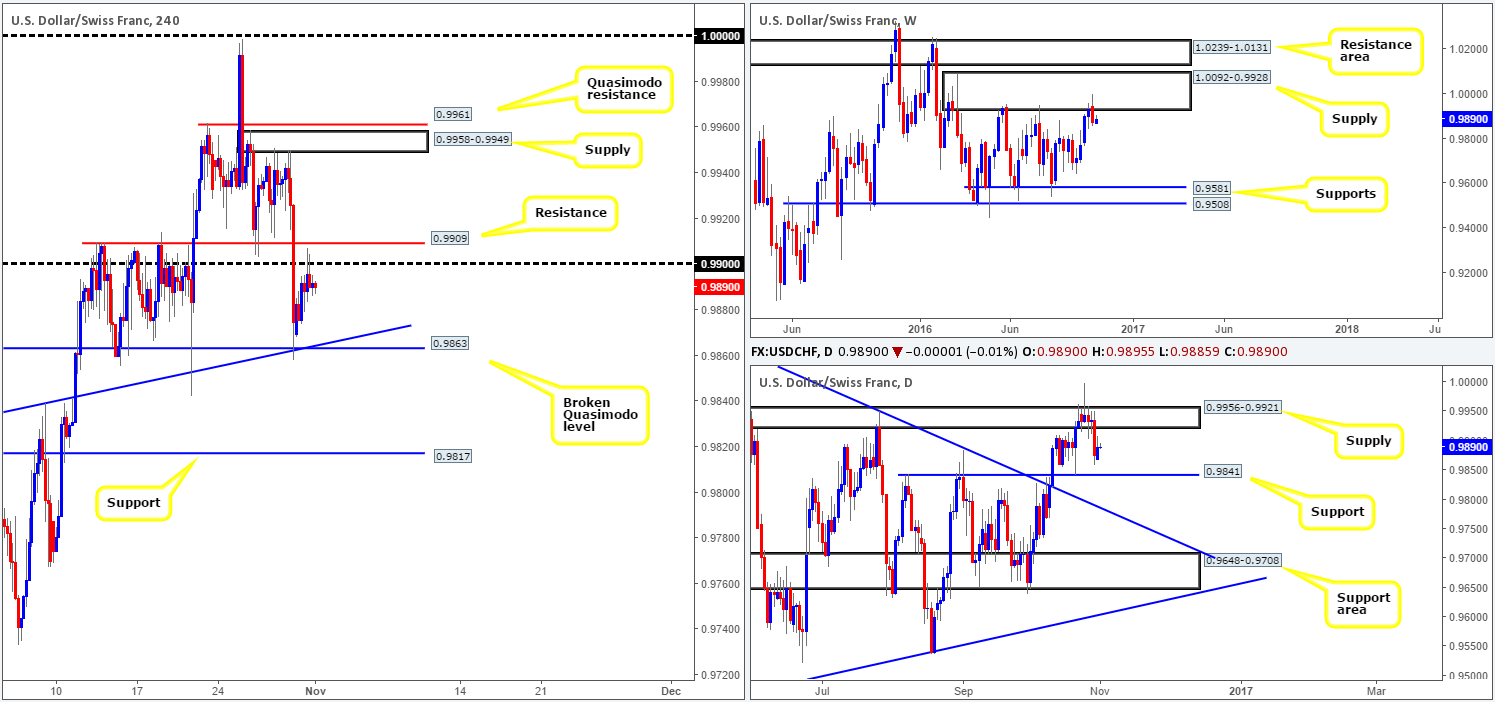
Monday’s action shows that price extended Friday’s bounce from the H4 broken Quasimodo line at 0.9863 (fuses with a H4 trendline support extended from the high 0.9817), and managed to clock a high of 0.9907 on the day. A violation of the 0.99 handle along with a nearby H4 resistance at 0.9909 would see the pair land itself within reaching distance of the daily supply at 0.9956-0.9921. As such, be wary of looking to buy the breakout beyond 0.9909! Conversely, a break below the current H4 broken Quasimodo line would also land price on top of a daily support coming in at 0.9841. Therefore, we’d also advise one to take caution if you intend on selling the breakout beyond here!
Our suggestions: In that weekly action shows that the Swissy recently sold off from a supply zone painted at 1.0092-0.9928, we feel the more likely path will be south this week. However, it will not be until we see a close beyond the current daily support at 0.9841, will our team be confident shorting this market. And so, our desk has come to a consensus that sitting on our hands is the safer approach for the time being.
Data points to consider: US ISM figures due at 2pm GMT.
Levels to watch/live orders:
- Buys: Flat (stop loss: N/A).
- Sells: Flat (stop loss: N/A).
DOW 30:
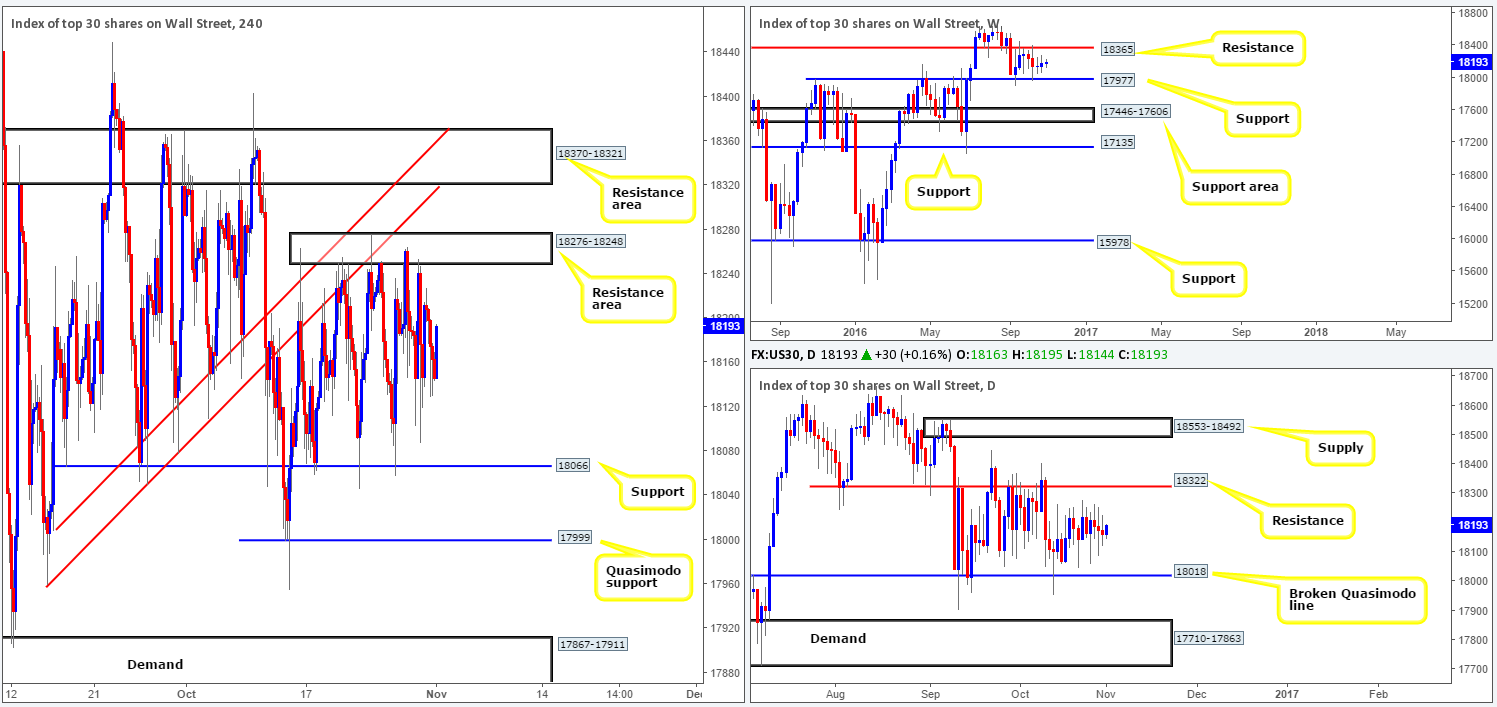
Equities remain in a phase of consolidation this morning, which is, as far as we can see, due to the uncertainty surrounding the upcoming US elections. From the weekly picture, price has been capped between resistance at 18365 and a support level coming in at 17977 since September 12. Along the same vein, the daily candles have also been consolidating between a resistance at 18322 and a broken Quasimodo line penciled in at 18018. In addition to this, three back-to-back indecision candles recently formed mid-way between these barriers. Looking across to the H4 chart, the buyers and sellers have been seen trading between a resistance area at 18276-18248 and a support registered at 18066 since mid-Oct.
Taking into account that this H4 consolidation has very little higher-timeframe confluence, our desk has absolutely no interest in trading within these walls. Instead, as we have mentioned several times in previous reports, the only areas we have interest in at the moment is the Quasimodo support at 17999 and the resistance area at 18370-18321. The Quasimodo is attractive because it fuses with nearby weekly support at 17977 and also the daily broken Quasimodo line at 18018.The resistance zone, however, is equally attractive since it houses both the daily resistance level at 18322 and the weekly resistance at 18365.
Our suggestions: For us personally, at least for the time being, we’ll stick with our original outlook and target the above said zones outside of the current H4 range. For those who agree with our analysis, we would still advise waiting for a H4 close prior to risking capital at these areas.
Data points to consider: US ISM figures due at 2pm GMT.
Levels to watch/live orders:
- Buys: 17999 ([H4 bullish close required] stop loss: ideally beyond the trigger candle).
- Sells: 18370-18321 ([H4 bearish close required] stop loss: ideally beyond the trigger candle).
GOLD:
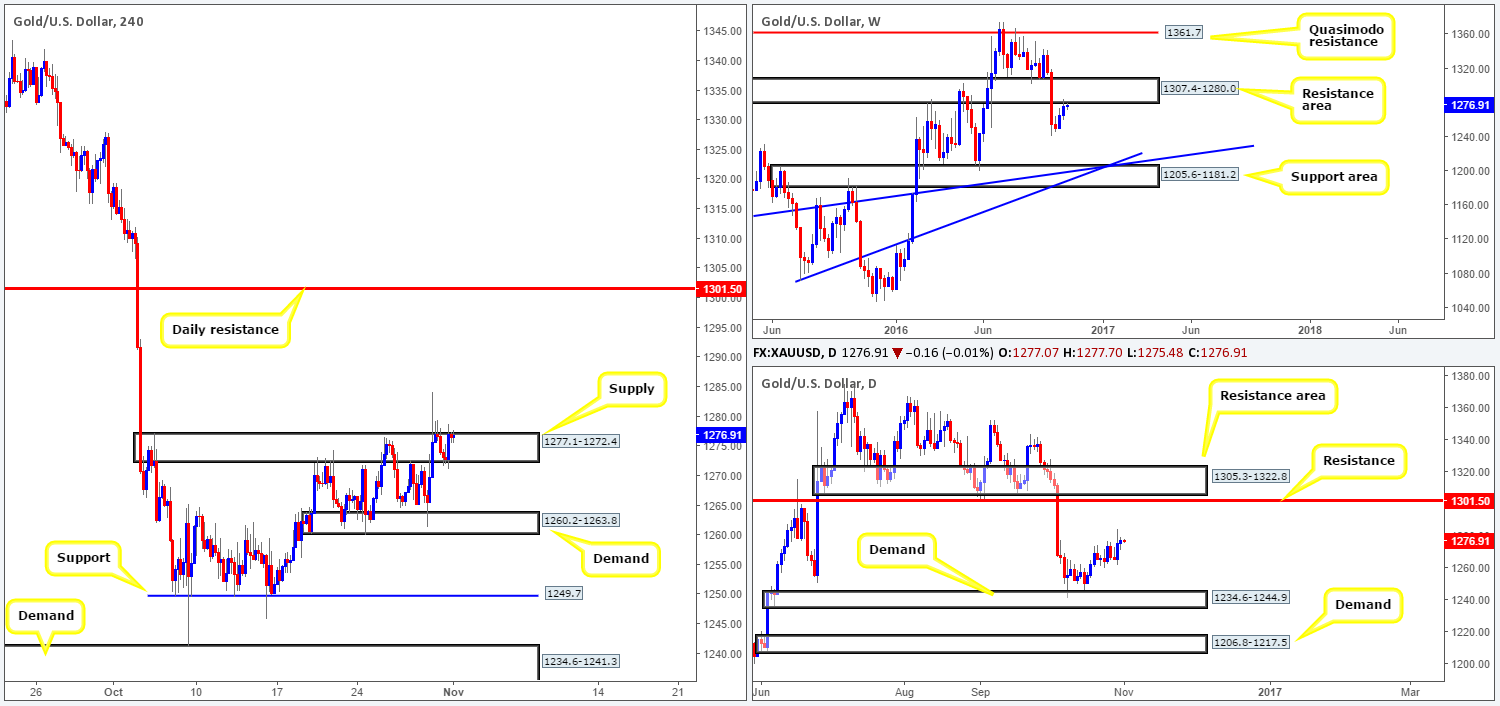
As can be seen from the H4 chart, the buyers and sellers remain battling for position around the top edge of the supply barrier drawn from 1277.1-1272.4. Given Friday’s aggressive spike through this area, a truckload of sellers were likely taken out here. In the case that this zone is engulfed today, the river north should be ‘ripple free’ up to the daily resistance level at 1301.5. However, looking over on the weekly chart, you’ll see that the metal recently retested the underside of a resistance zone at 1307.4-1280.0. Assuming that the sellers hold ground here, there’s potential for move down to the support area coming in at 1205.6-1181.2 (fuses with two weekly trendline supports [1071.2/1130.1]).
Our suggestions: With the above notes taken on board, our desk is still interested in seeing a break above the current H4 supply barrier. The reason being is that beyond this area the pathway north on both the H4and daily charts is clear up to the aforementioned daily resistance. As such, should price retest this boundary as demand (after a close higher) followed by a reasonably sized H4 bull candle, one could look to go long from here targeting the daily level. However, do remain aware that by entering long from here, even with the confirmation of a H4 bull candle, you’re effectively buying directly into a weekly resistance area.
Should a close be seen below the H4 demand at 1260.2-1263.8 on the other hand, we may, depending on if the H4 candles retest the underside of this area as supply, look to short from here (H4 bearish close required), given that price recently came into contact with the aforementioned weekly resistance area.
Levels to watch/live orders:
- Buys: Watch for a close above the H4 supply at 1277.1-1272.4 and then look to trade any retest seen thereafter (H4 bullish close required – stop loss: ideally beyond the trigger candle).
- Sells: Watch for a close below the H4 demand at 1260.2-1263.8 and then look to trade any retest seen thereafter (H4 bearish close required – stop loss: ideally beyond the trigger candle).


