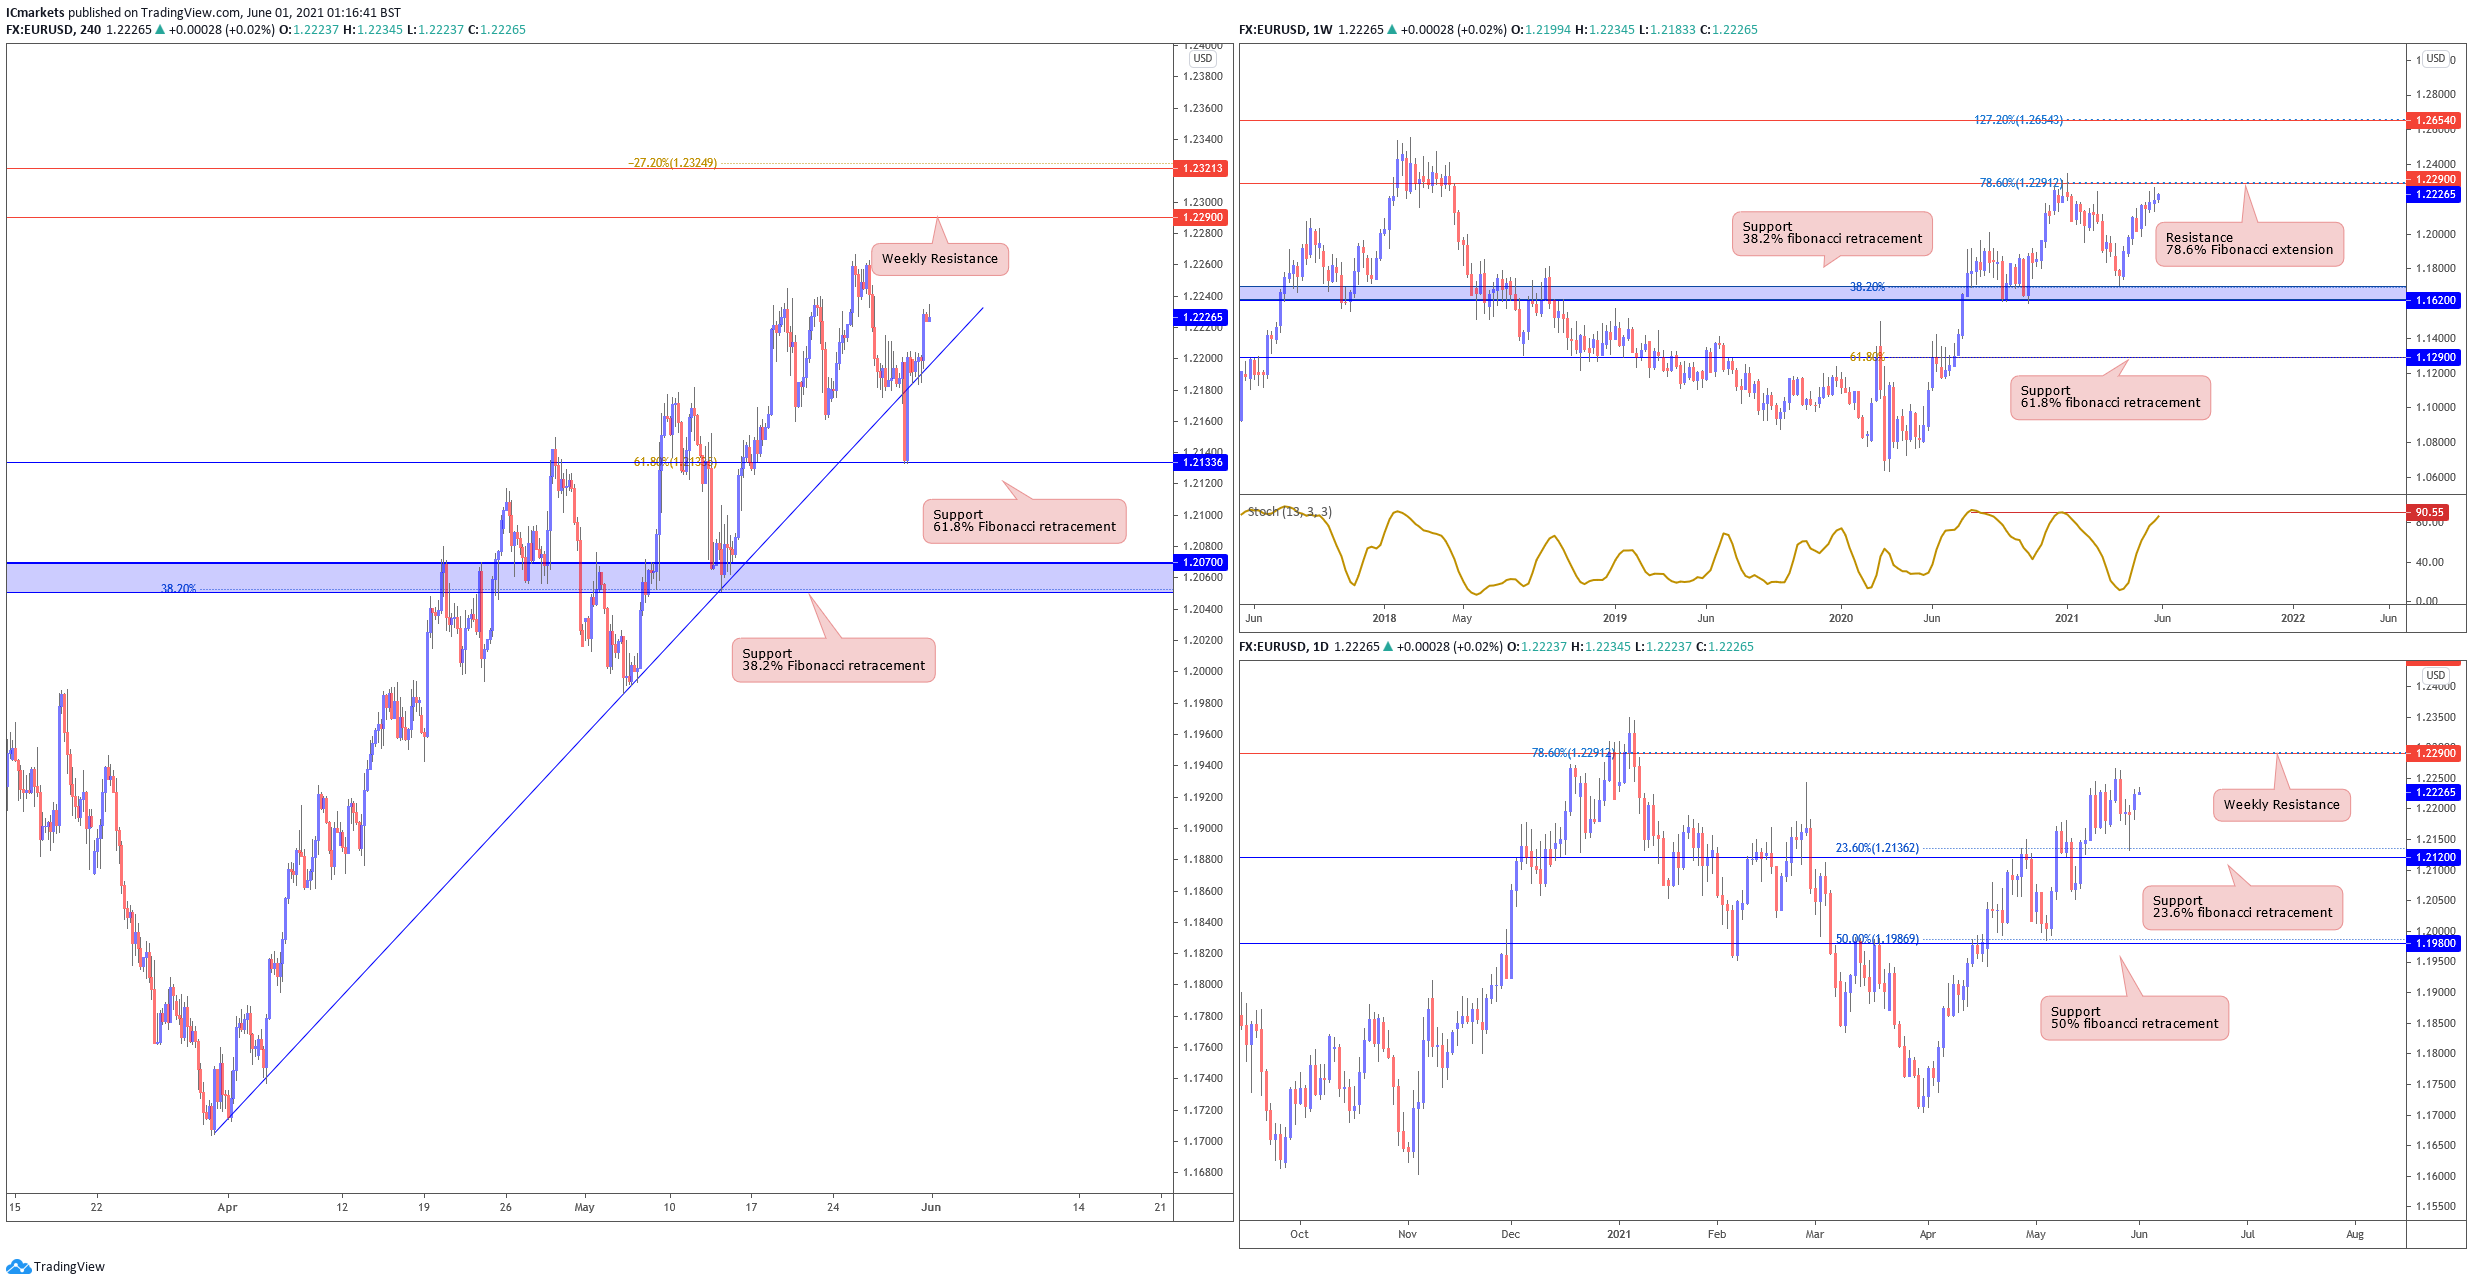
EUR/USD:
Looking at the weekly chart, we can see that prices are seeing further limited upside before it reaches our resistance area at 1.22900. On the daily chart, price is holding above support at 1.21200 where we could possibly see some bullish pressure with 1.22900 as our resistance target as well.
On the H4 timeframe, prices are still facing bullish pressure from our support at 1.21336, in line with the horizontal swing low support and 61.8% retracement where we could see a limited upside above this level with 1.22900 as our first resistance target. Failure to hold above the 1.21336 support level could see a swing towards our next support target at 1.20700.
Areas of consideration:
- 1.22900 resistance area found on H4 time frame
- 1.21336 support area found on H4 time frame
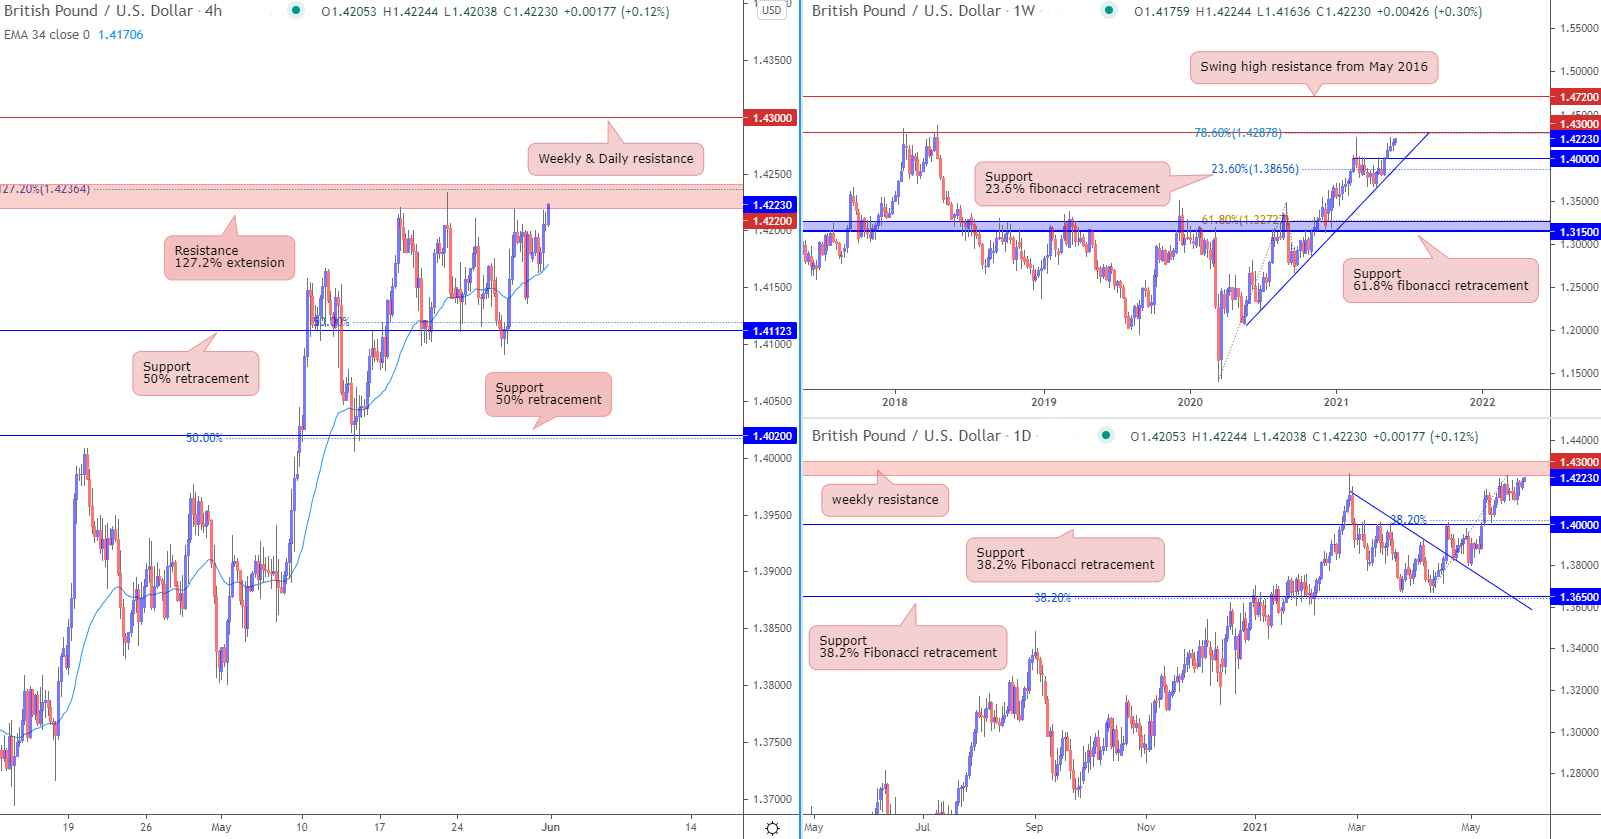
GBP/USD:
Looking at the weekly chart, we can see that prices are facing bullish pressure from our ascending trend line and support at 1.40000 where we could see a further upside above this level to our resistance target at 1.43000, in line with the 78.6% fibonacci extension. The daily time frame echoes the same bullish view as well where we could see a limited upside above our support level at 1.40000 with 1.43000 as our resistance target.
On the H4 timeframe, prices are trading between our support and resistance levels at 1.41123 and 1.42200 respectively. A break above the resistance at 1.42200 in line with our 127.2% fibonacci extension could see a further push up to our next resistance target at 1.43000. EMA is also below prices, showing a bullish pressure in prices, consistent with our weekly and daily bias.
Areas of consideration:
- 1.42200 resistance area found on H4 time frame
- 1.41123 support area found on H4 timeframe
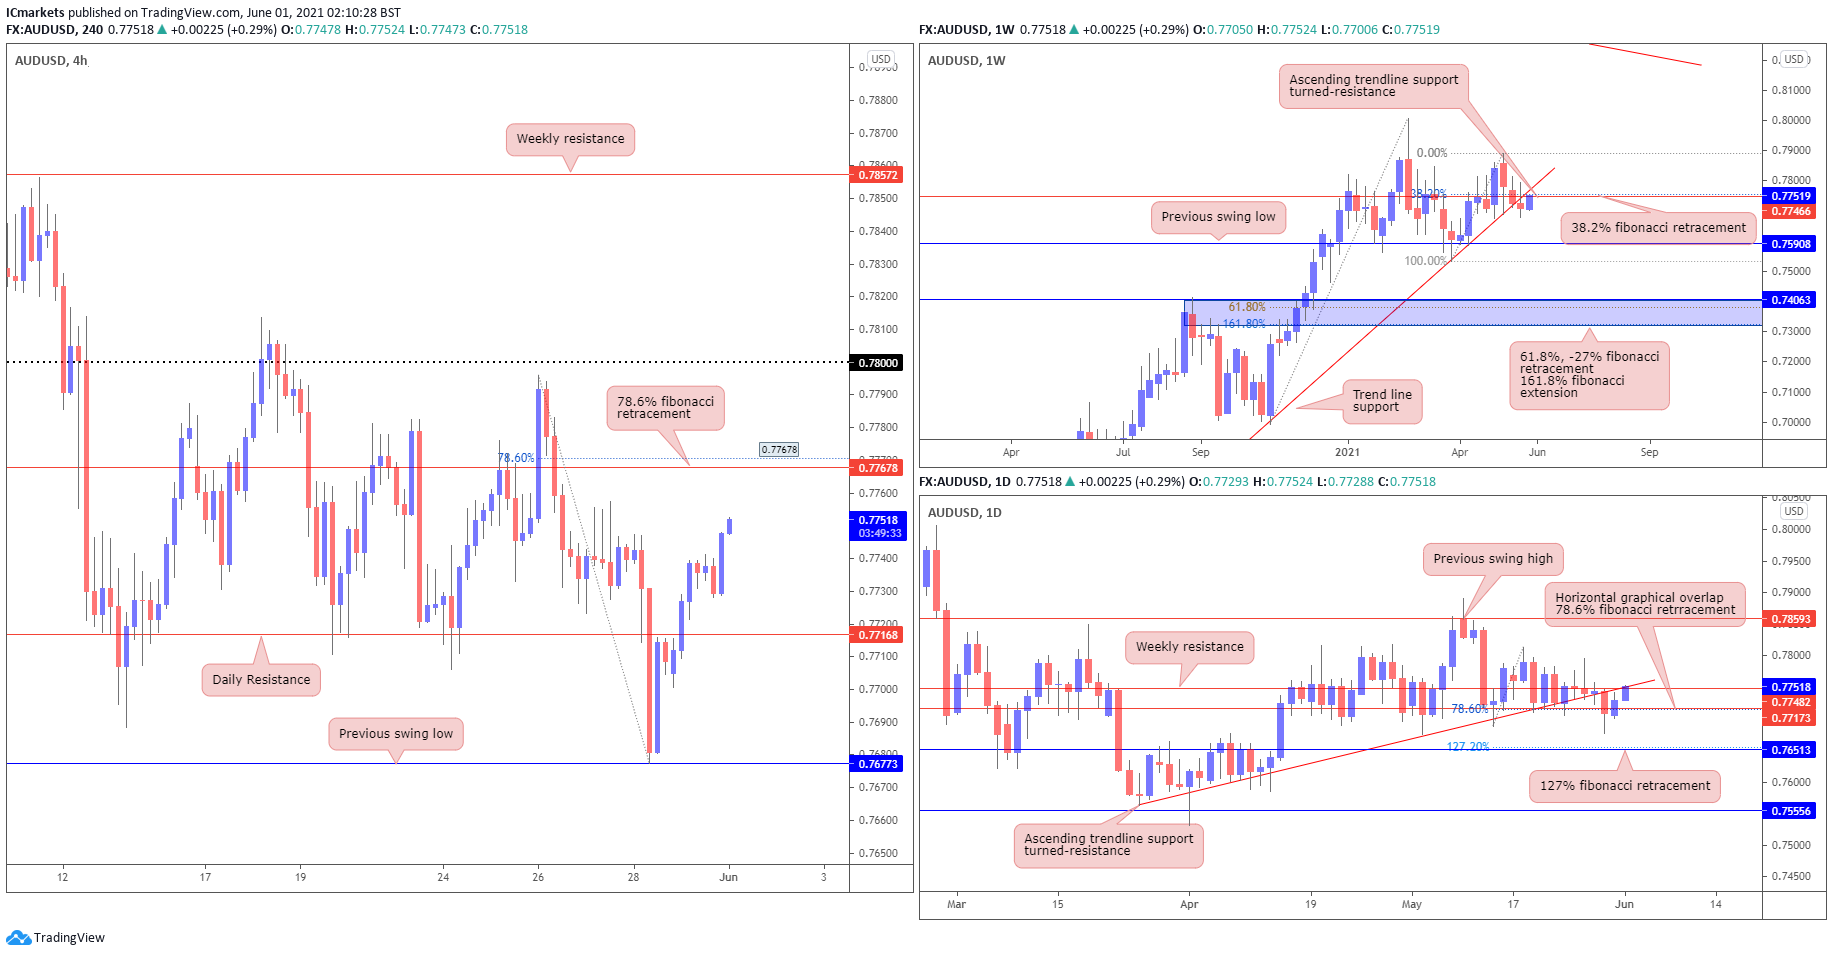
AUD/USD:
From the Weekly timeframe, we see price breaking beneath the ascending trendline support, now turned-resistance. It is also in line with 38.2% fibonacci retracement level, price may pull back to tap on the 0.77466 level before pushing lower to previous swing low. From the daily timeframe, we see that price has also broken beneath the ascending trendline in line with 78.6% fibonacci retracement, where we may see a push down towards the 0.76513 level, in line with 127% fibonacci retracement.
On the H4 timeframe, We see price pushing towards 0.77678, in line with 78.6% fibonacci retracement, where we could potentially look for shorts towards the Daily resistance level before price creates new levels of low.
Areas of consideration:
- H4 timeframe, price may push further down towards previous swing low.
- Daily and weekly time frames showing bearish momentum.
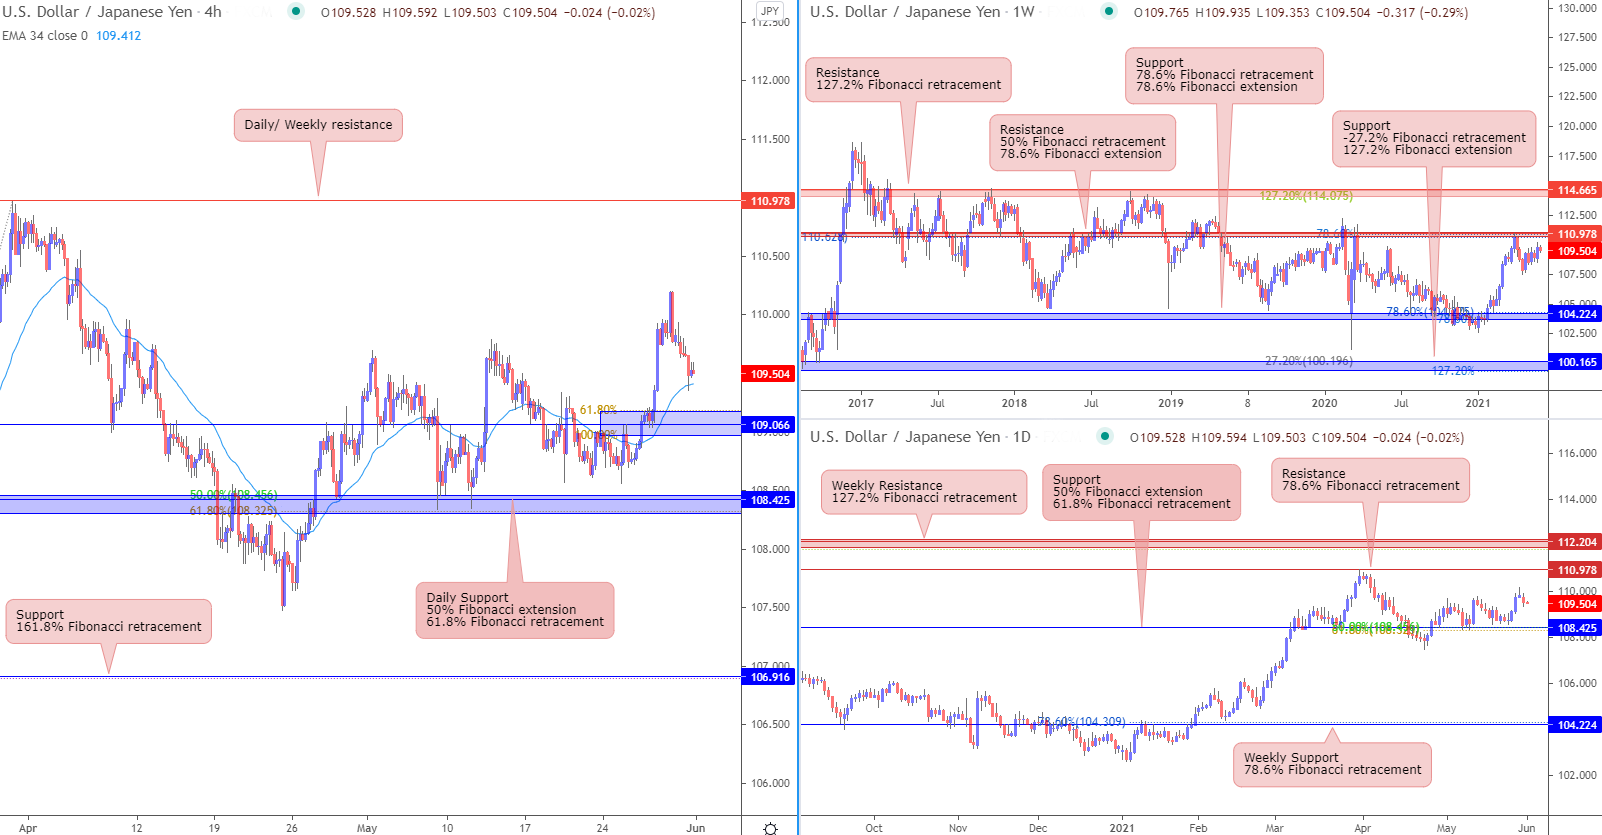
USD/JPY
From the weekly timeframe, prices are facing resistance from horizontal swing high resistance which coincides with 50% Fibonacci retracement and 78.6% Fibonacci extension, taking support from 104.224 level which is in line with 78.6% Fibonacci retracement and 78.6% Fibonacci extension. On the daily time frame, prices are facing support from 108.425 level which coincides with 61.8% Fibonacci retracement and 50% Fibonacci extension. Prices might bounce towards daily resistance level 110.978 in line with 78.6% Fibonacci retracement. Daily EMA is also below prices, showing a bullish pressure for prices.
On the H4 timeframe, prices might take support on 109.066 support level in line with 61.8% Fibonacci retracement and 100% Fibonacci extension. Prices might push up towards the daily resistance level of 110.978. If prices did not push up further, prices could fall and take support on 108.425 level, in line with daily support levelt. EMA is also below prices, showing a bullish pressure for prices.
Areas of consideration:
- On the H4, prices might push up towards 110.978 daily resistance level
- 109.066 support level on the H4 timeframe
- 108.425 support level on the daily timeframe
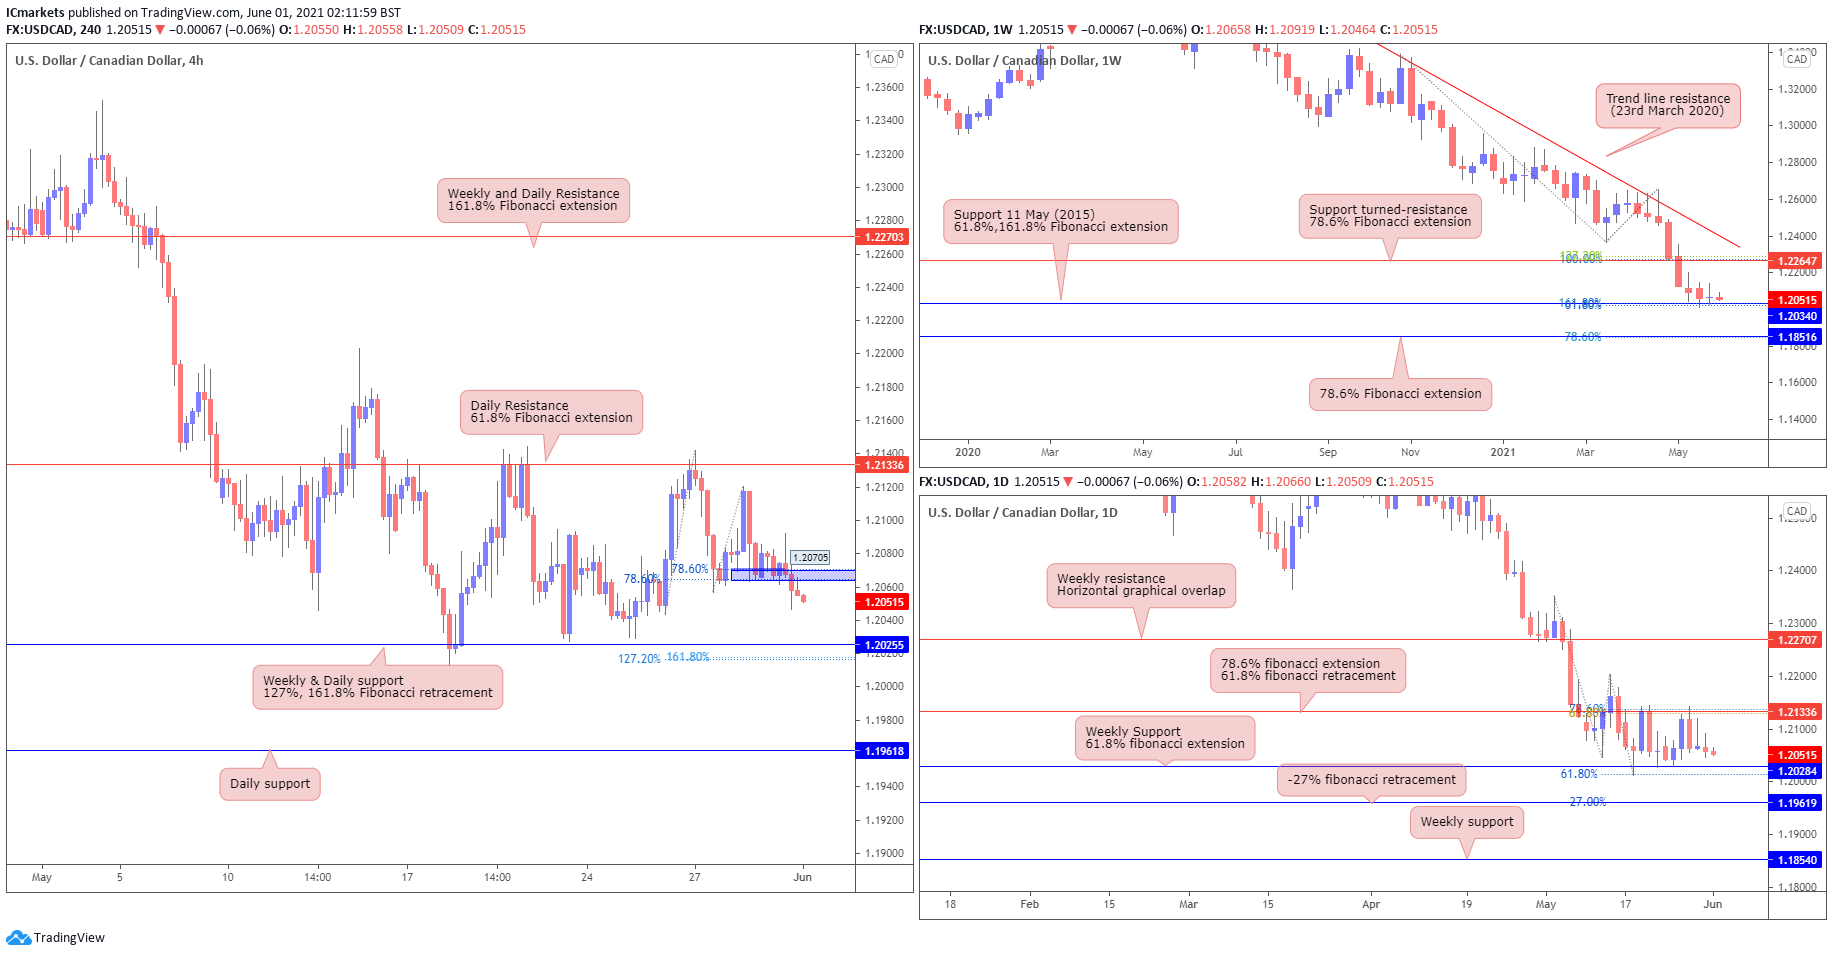
USD/CAD:
From the Weekly timeframe, we see price trending between the previous swing high in line with 78.6% fibonacci retracement, and the ascending trendline, it is currently testing the support level from 11th May (2015), in line with 61.8%, 161.8% fibonacci extension. From the daily timeframe, we see that price bounced from the recent support level 1.20284 in line with 61.8% fibonacci extension, where it’s consolidating between this level and 1.21336, in line with 78.6% fibonacci extension, 61.8% fibonacci retracement.
The H4 timeframe shows price breaking beneath the level of 1.20705, in line with 78.6%, 78.6% fibonacci retracement and horizontal graphical overlap, we may see a further drop towards 1.20255, in line with Weekly, daily support, 127% and 161.8% fibonacci retracement.
Areas of consideration:
- The weekly and daily time frame showing a slow down from this bearish momentum.
- On H4, price may break under 1.20705 and push down towards 1.20255.
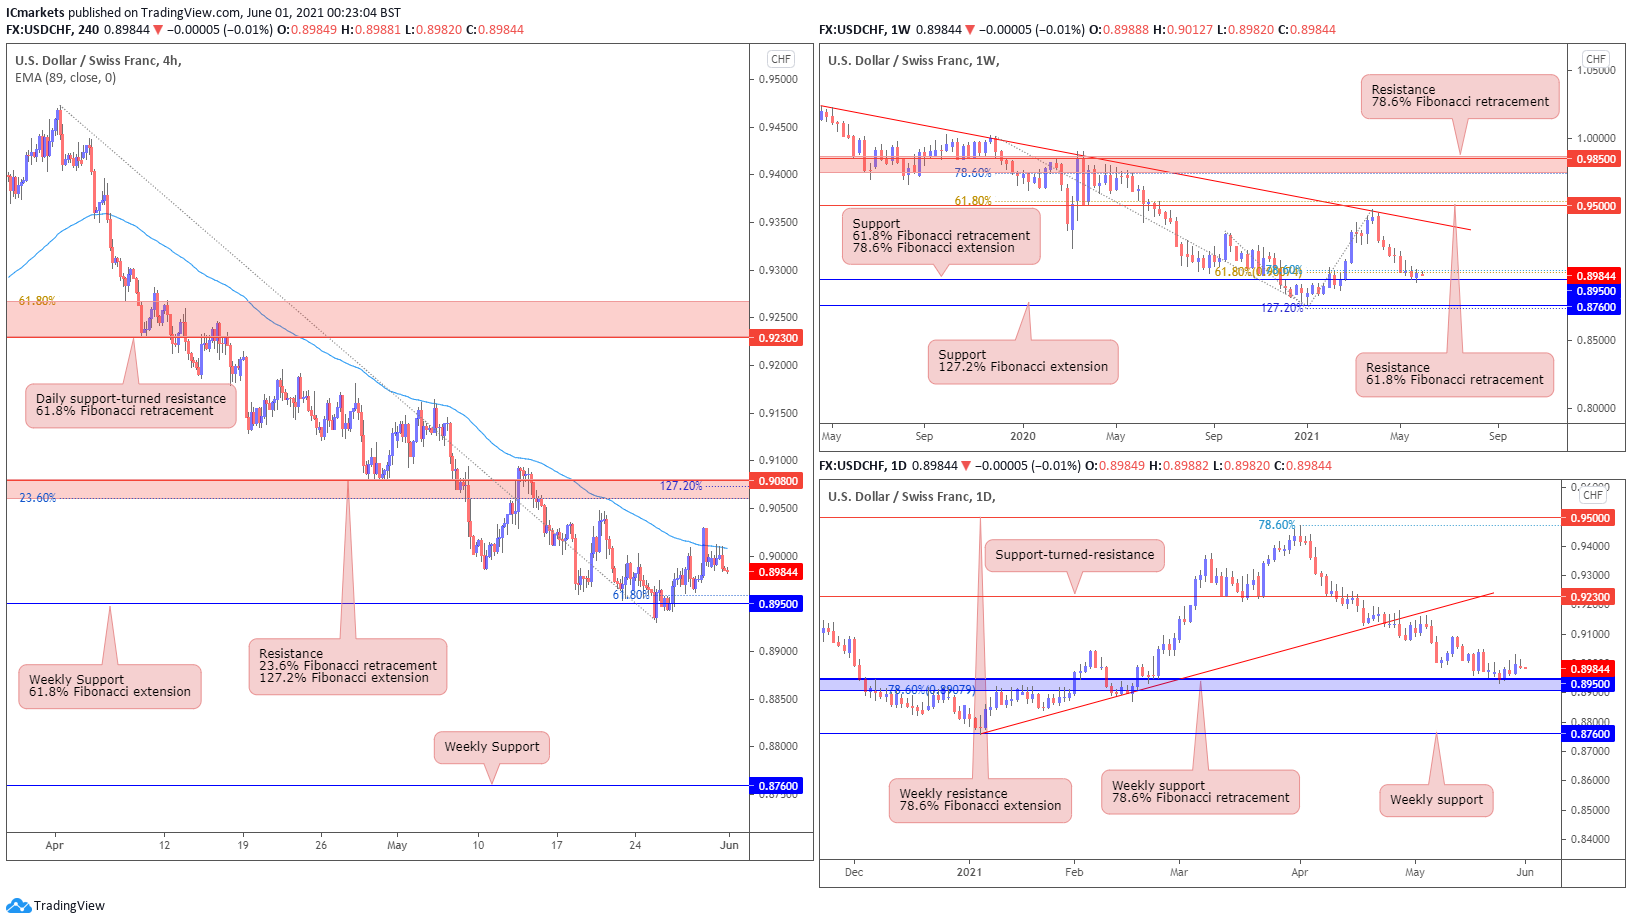
USD/CHF:
USD/CHF is now testing the weekly 0.89800 support, in line with 61.8% Fibonacci retracement and 78.6% Fibonacci extension. The daily chart shows that price is now holding below the key daily 0.92300 support-turned-resistance, and has also broken below the ascending trendline support-turned-resistance. The weekly 0.89500 support level is a key level to watch.
On the H4 chart, we can see that price pulled back to retest the moving average resistance and 0.90800 resistance, which is in line with our 23.6% Fibonacci retracement and 127.2% Fibonacci extension. We also note that price is now holding below the moving average resistance, showing bearish pressure in line with our analysis. In this scenario, a break and close below the key 0.89500 support would see price swing towards the next weekly 0.87600 support level. Otherwise, price could also pull back to retest the 0.90800 resistance as it continues to move sideways.
Areas of consideration:
- The 0.89800 weekly support is a key intraday level to watch.
- Price is facing bearish pressure as it holds below the moving average resistance.
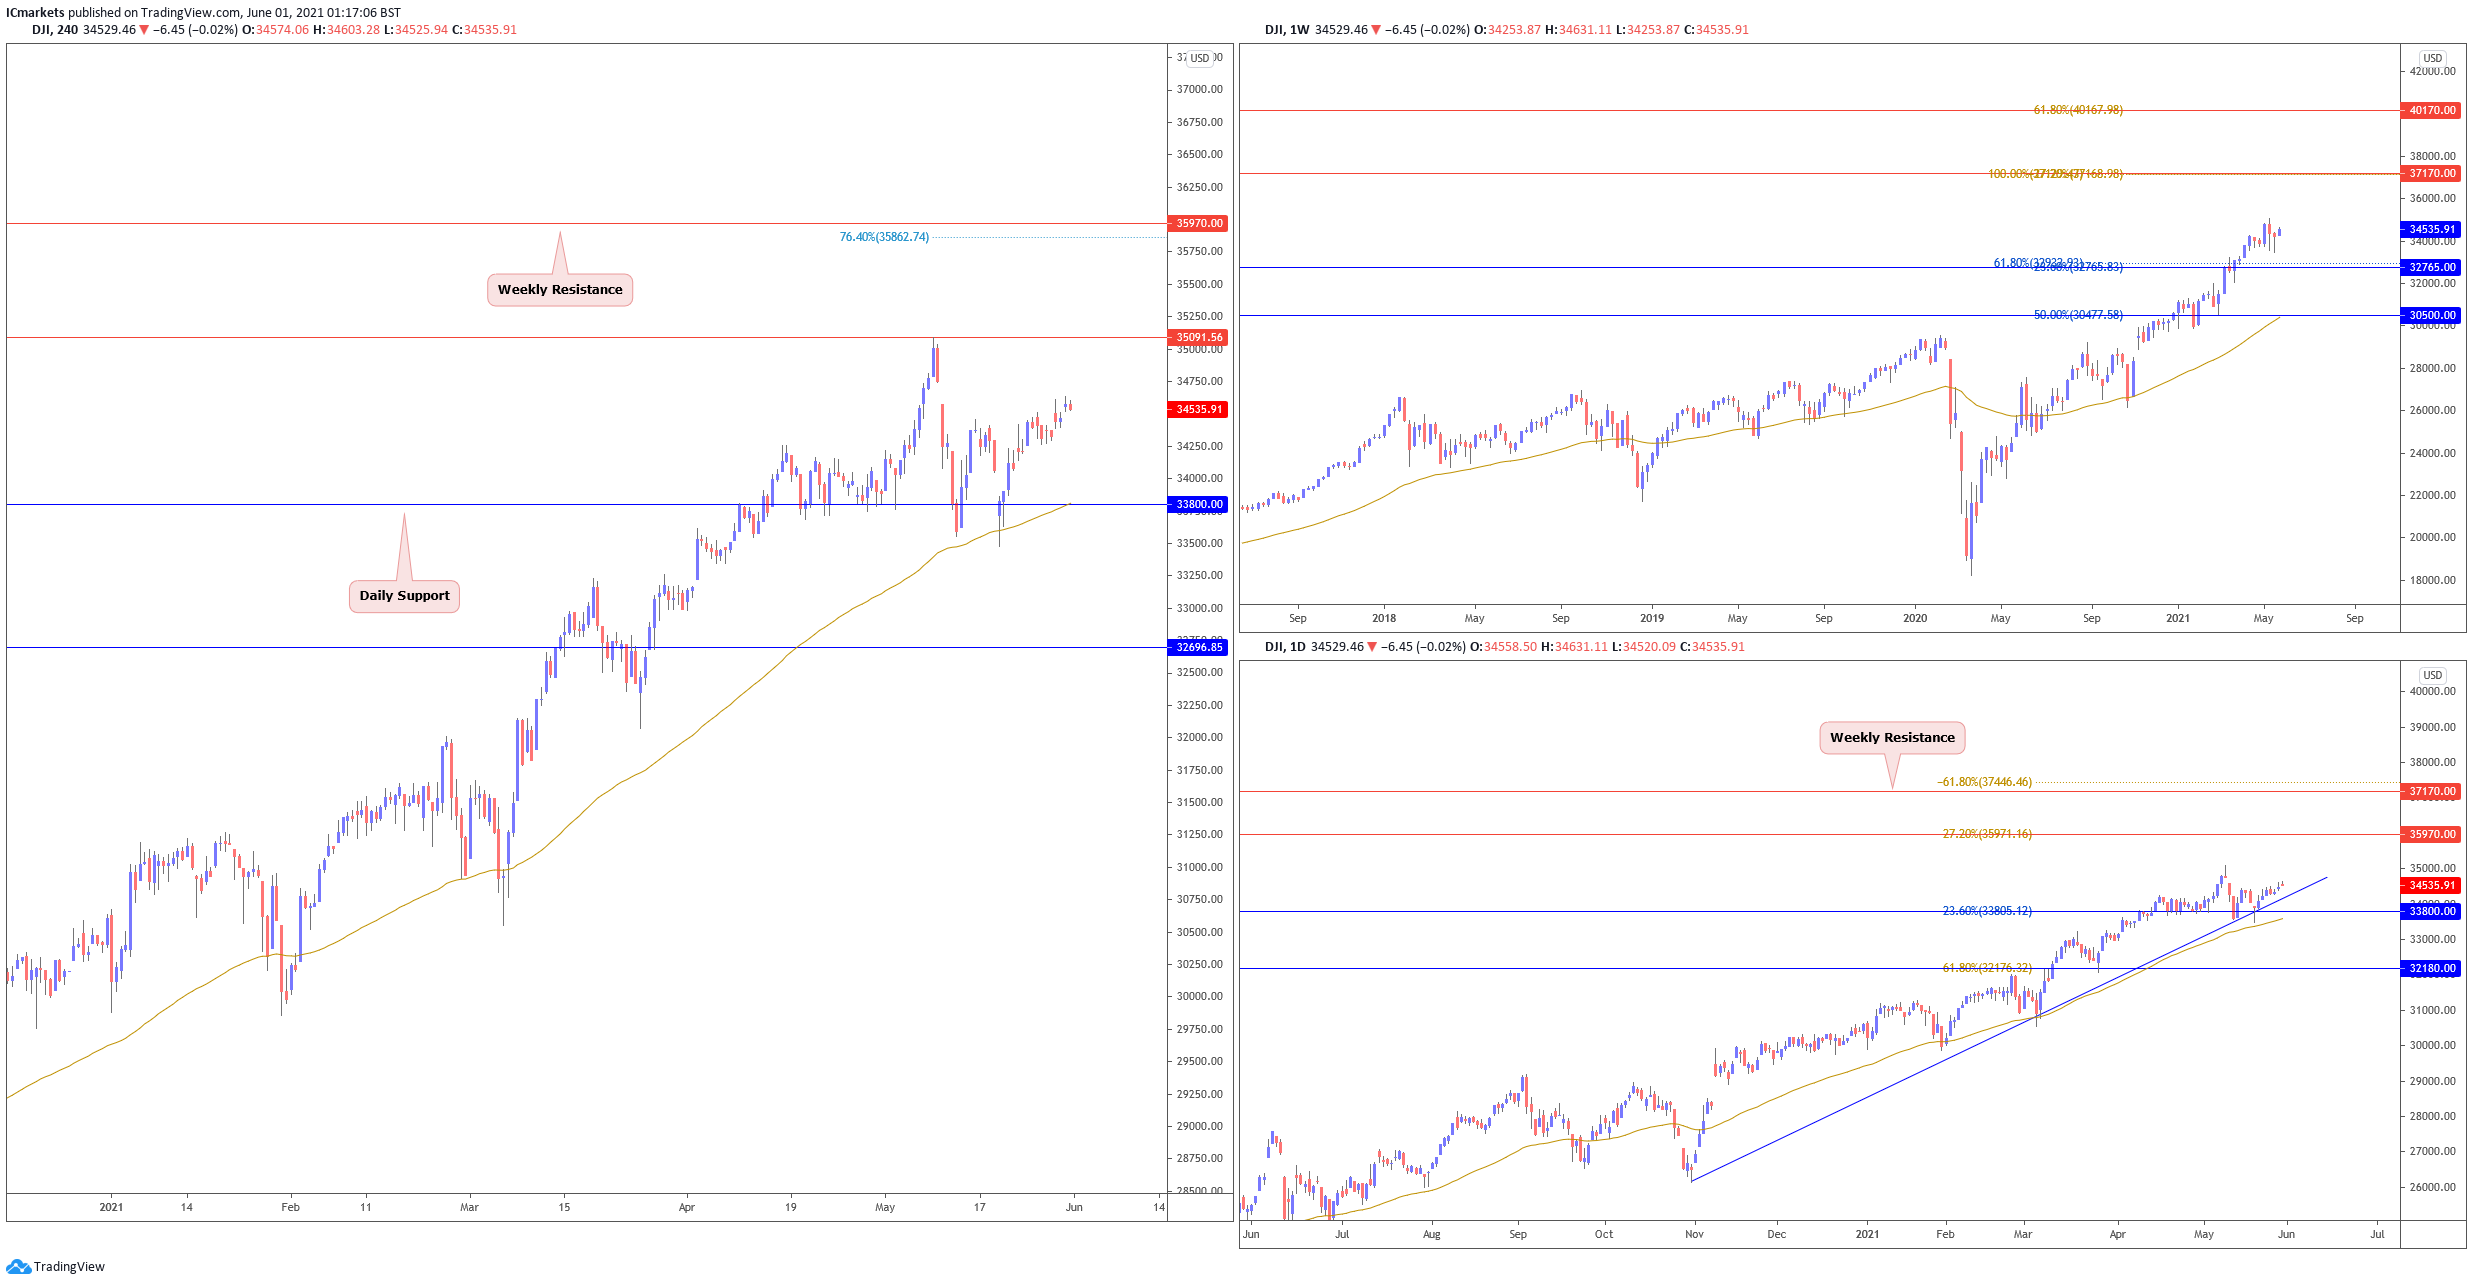
Dow Jones Industrial Average:
On the weekly chart, price traded sideways. With price holding above the long term moving average, we can expect further bullish pressure above 32765 support. On the daily chart, price pulled back lower and reacted above moving average and bounced above ascending trendline support. Buyers may look to add their longs to push price higher towards possible target at 35970 resistance.
On the H4, prices drifted higher and is still holding between 33800 support and 35091 resistance. A limited push higher could be possible but with no level for good risk to reward opportunity, we prefer to remain neutral for now.
Areas of consideration:
- Technical indicators across all timeframes confirm bullish momentum
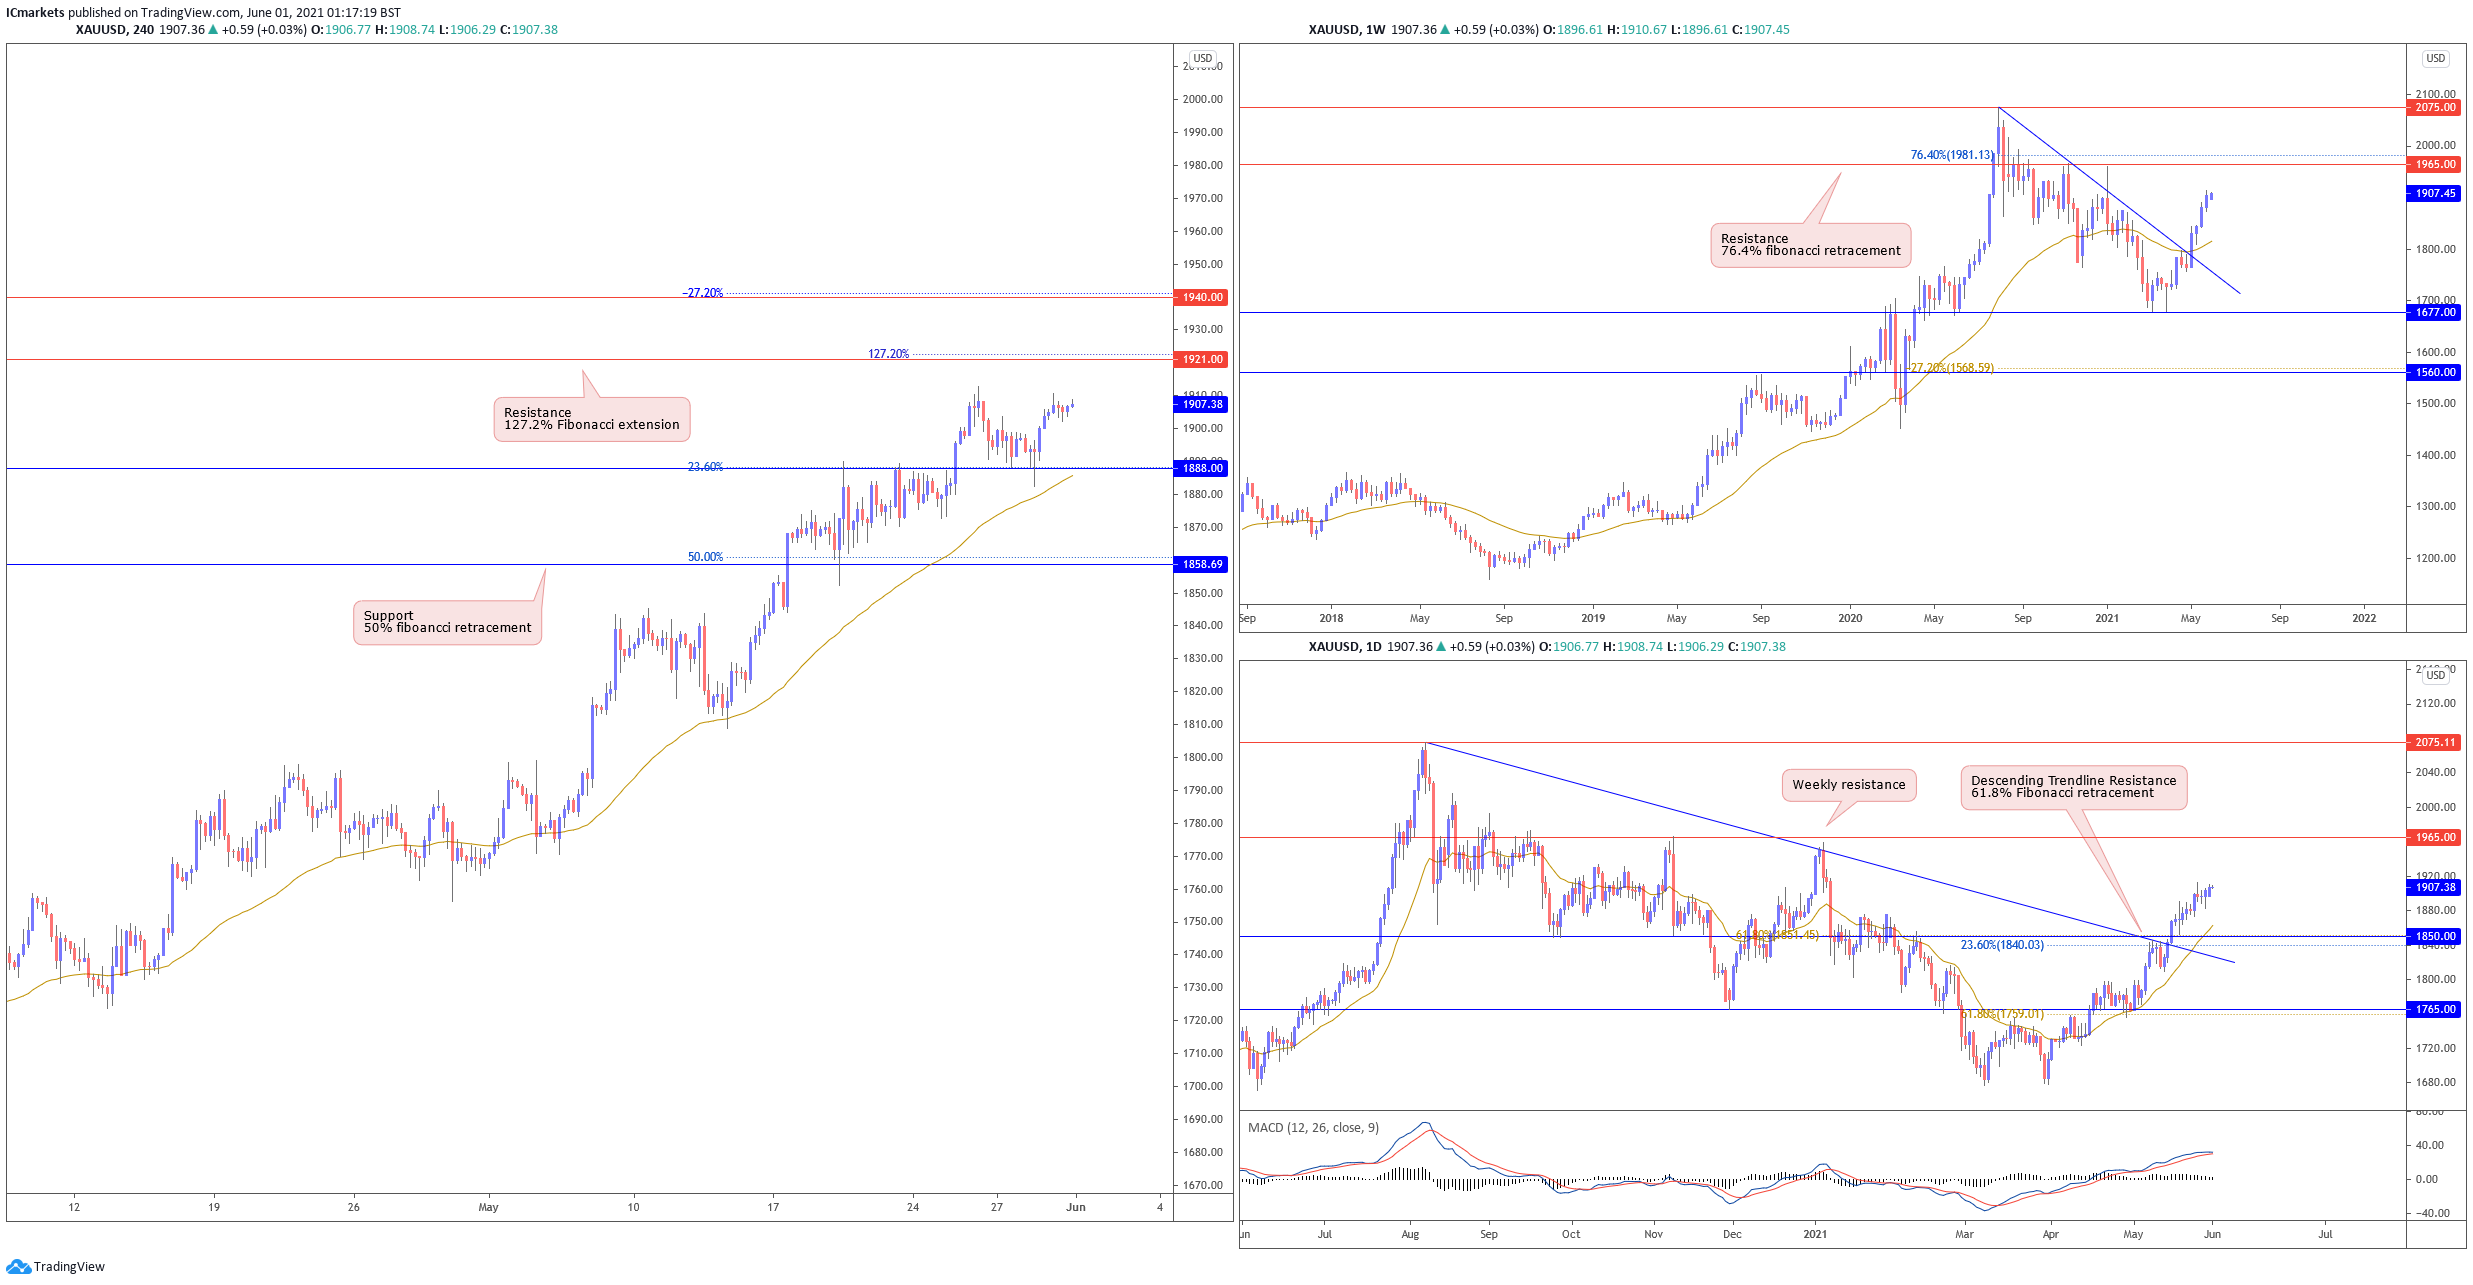
XAU/USD (GOLD):
On the weekly timeframe, prices are facing bullish pressure and could still see further upside, with 1965 as the weekly resistance target. We could see renewed bullish pressure this coming week. On the daily, price pushed higher and is currently holding between 1850 support and 1965 resistance. With technical indicator showing room for further bullish momentum, we could see limited upside towards 1965 resistance. Otherwise, price could pull back to re-test 1850 support level.
On the H4, price is currently holding between 1888 support and 1921 resistance. While we maintain our slight bullish bias, there are no clear levels of entry and it is advisable to remain neutral watching the respective support and resistance levels. Breaking above 1921 resistance will see price push higher towards 1940 resistance next. Otherwise, a break below 1888 support could see price fall further towards 1858 support.
Areas of consideration:
- 1888 support level on the H4 time frame
- 1921 resistance level on the H4 time frame