
EUR/USD:
Despite the euro seen opening the week lower against its US counterpart, H4 price managed to find active support around lows of 1.1565 as London opened its doors for business on Monday, consequently reclaiming the 1.16 handle. Aside from a slightly more bullish tempo within the H4 resistance area at 1.1639-1.1607, EUR/USD price is effectively unchanged this morning.
Over on the weekly timeframe, we can see that the single currency lost considerable ground against its US counterpart over the course of last week’s trade. Modelled in the shape of a weekly bearish engulfing candle, the pair snowballed south from the upper limit of a weekly demand-turned resistance area at 1.1717-1.1862 and shook hands with weekly support at 1.1600 into the close.
Meanwhile, there’s also a nice-looking support priced in at 1.1574 on the daily timeframe to take into consideration, coupled with a neighboring daily trend line support taken from the low 1.0340.
Areas of consideration:
Having seen both weekly and daily support brought into the picture (see above) last week, we still feel that hunting for shorts inside the current H4 resistance area is going to be a challenge. Should our analysis be correct and price extends Monday’s gains, the next area of interest on the H4 scale falls in at a H4 resistance area plotted from 1.1710-1.1734. This area screams shorts. Not only have we recently put in a lower low (see red arrows) on the H4, the area itself is further bolstered by the 1.17 handle and June’s opening level at 1.1705 (green zone). Further adding to this, traders may have also observed that the H4 zone is glued to the underside of the weekly resistance area highlighted above at 1.1717-1.1862.
In addition to the above, traders might also want to contemplate longs off 1.16 as a retest play in the shape of either a full or near-full-bodied H4 bull candle, targeting the 1.17 region. Yes, we know this entails buying into the current H4 resistance area, but given the backing seen from higher-timeframe supports, this remains a high-probability setup.
Today’s data points: ECB President Draghi takes to the stage; US building permits and Housing starts.

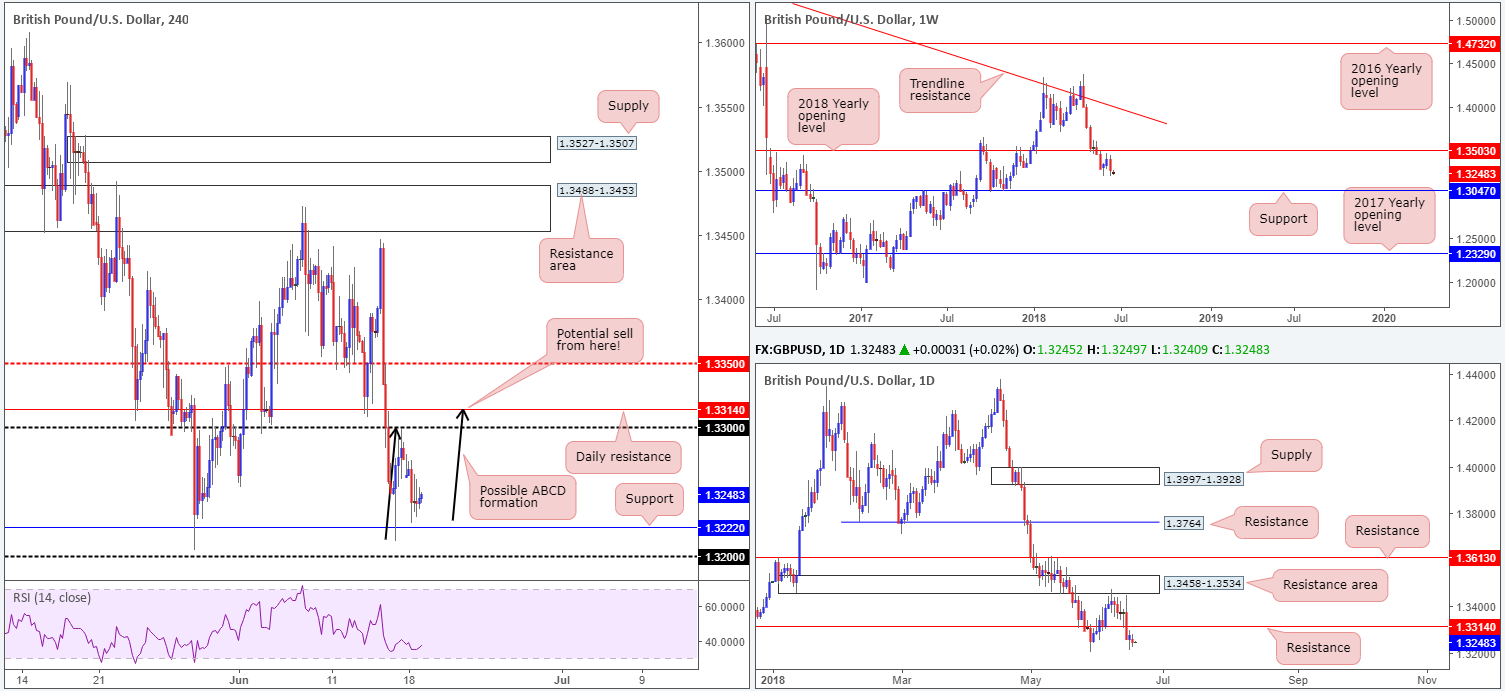
GBP/USD:
In spite of Friday’s modest recovery from H4 support at 1.3222, the British pound met renewed selling pressure at the beginning of the week. The GBP/USD held on to its weaker tone going into European hours, though managed to establish a floor of support off intraday lows of 1.3225 as we transitioned into US trade (just north of the aforementioned H4 support), amid a subdued USD and weaker US Treasury yields.
The story on the higher timeframes show that the pair managed to erase two weeks’ worth of gains last week, and potentially set the stage for a continuation move lower this week. The next support target on the weekly scale can be found at 1.3047.
Recent selling, as is shown on the daily timeframe, brought price through support at 1.3314 (now acting resistance) to the May 29 low at 1.3204. In the event that sellers remain defensive, the next support can be drawn in at 1.3063 (sited a few pips above the aforementioned weekly support – not seen on the screen).
Areas of consideration:
On account of all three timeframes continuing to air somewhat bearish vibes, a potential H4 ABCD bearish correction has caught our eye this morning, which happens to complete around the daily resistance level mentioned above at 1.3314. Traders may also want to note that the daily resistance is located just above the 1.33 handle. Stops are generally positioned above psychological numbers and therefore tend to attract fakeouts. These (stops) orders, once filled, become buy orders, possibly providing liquidity for sellers at the daily resistance level.
On account of the above, we have labelled shorts off the daily resistance level as high probability.
Today’s data points: US building permits and Housing starts.
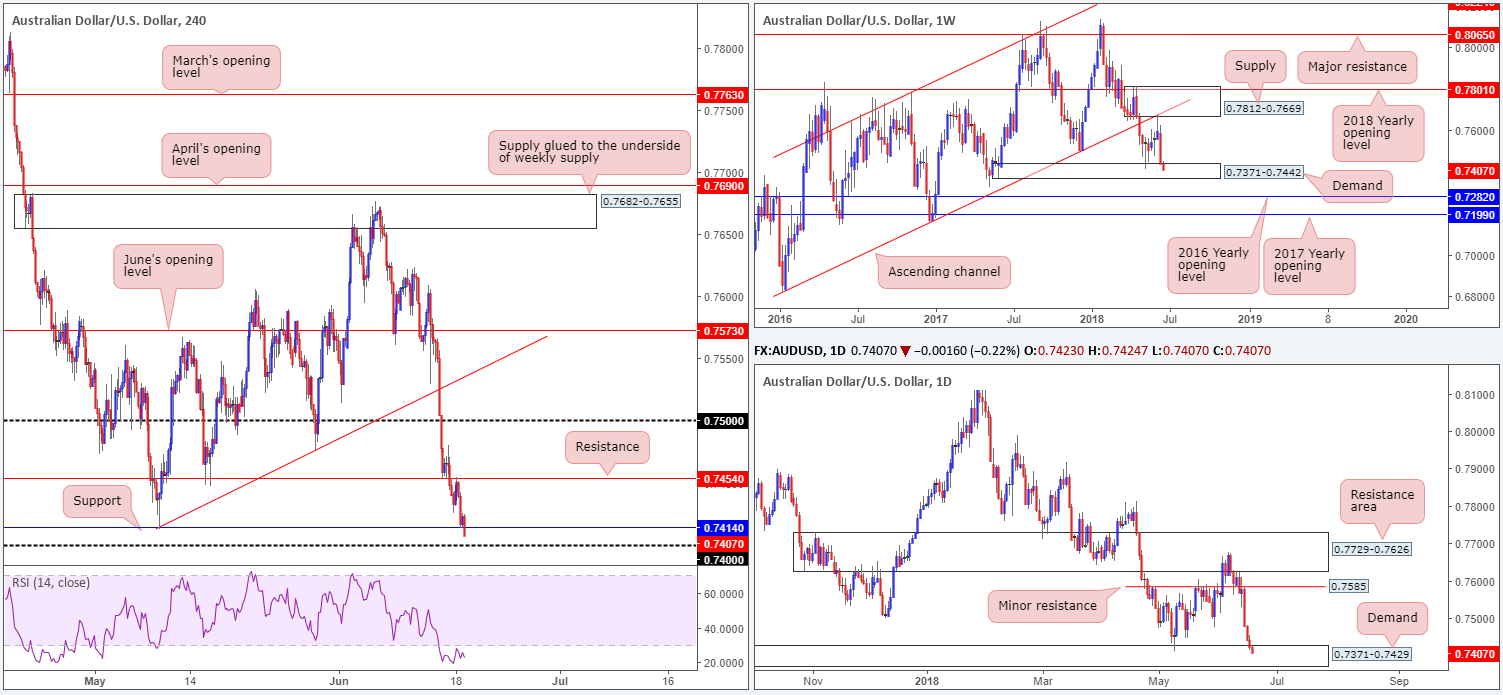
AUD/USD:
Kicking this morning’s AUD/USD analysis off from the higher timeframes, we can clearly see that the commodity currency recently entered into the walls of a weekly demand plotted at 0.7371-0.7442. A little lower down on the curve, the daily candles have also recently shook hands with a daily demand base coming in at 0.7371-0.7429 (housed within the lower limit of the aforementioned weekly demand area).
A closer look at price action on the H4 timeframe, however, places the candles below H4 support at 0.7414, possibly en route to test the 0.74 handle. Also worthy of mention on the H4 timeframe is the RSI indicator is currently displaying a clear oversold signal.
Areas of consideration:
In view of the unit trading at clear areas of demand on the higher timeframes, selling this market remains a daredevil move.
As for possible buying opportunities this morning, the team has noted to keep eyes on the 0.74 handle for signs of bullish activity. Ultimately, we would need to witness a H4 close printed back above the recently broken H4 support, before placing any conviction on longs. The next port of call beyond here can be seen at 0.7454: a H4 resistance level which, as you can see, held firm during Monday’s trade.
Today’s data points: Au. Monetary policy meeting minutes; Au. HPI q/q; US building permits and Housing starts.
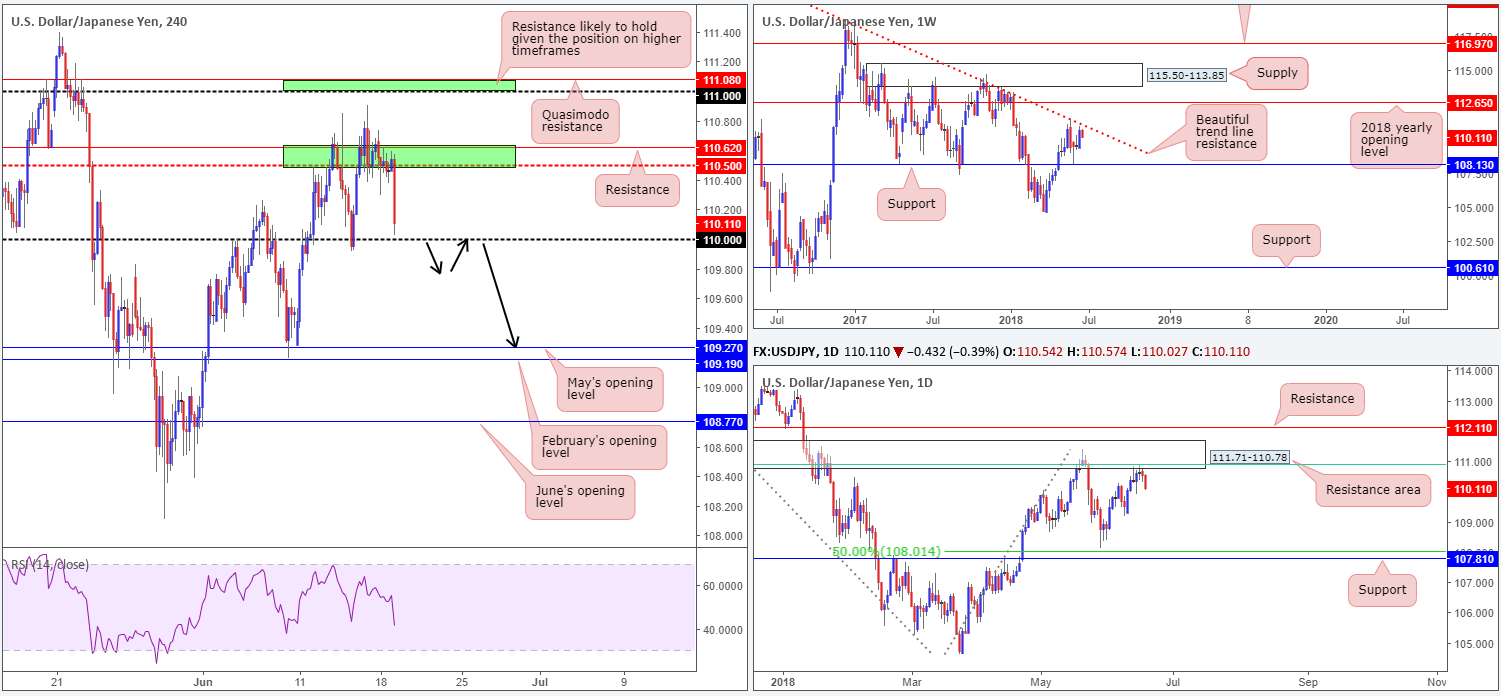
USD/JPY:
In recent news, US President Donald Trump has asked US Trade Representatives to identify $200bln in Chinese goods for further tariffs of 10% if China goes through with its $50bln retaliation threat. As a result of this, the USD/JPY immediately turned lower and is, at the time of writing, seen approaching the 110 handle on the H4 timeframe.
The move lower, although sparked off from Trump’s comments, is in harmony with the overall technical picture. Weekly price action is seen trading a stone’s throw away from trend line resistance taken from the high 123.67, and daily movement is currently selling off from a daily resistance zone seen at 111.71-110.78. This is an area that not only fuses with the aforementioned weekly trend line resistance, it also converges with a 61.8% daily Fib resistance value at 110.91 (green line) and has reasonably significant history dating back to August 2017. The next support target on the daily scale, as far as we can see, is the June 8 low drawn from 109.19. This is then followed by weekly support at 108.13.
Areas of consideration:
Owing to a somewhat bearish vibe in the market this morning, shorts could be the order of the day!
With the above in mind, should H4 price CLOSE below the 110 handle in the not so distant future, and retest the underside of the level as resistance (in the shape of a full or near-full-bodied H4 bearish candle), shorting this market could be an option. The first take-profit level can be found around May’s opening barrier at 109.27, followed closely by February’s opening level at 109.19 (essentially representing the June 8 low at 109.19).
Today’s data points: US building permits and Housing starts.
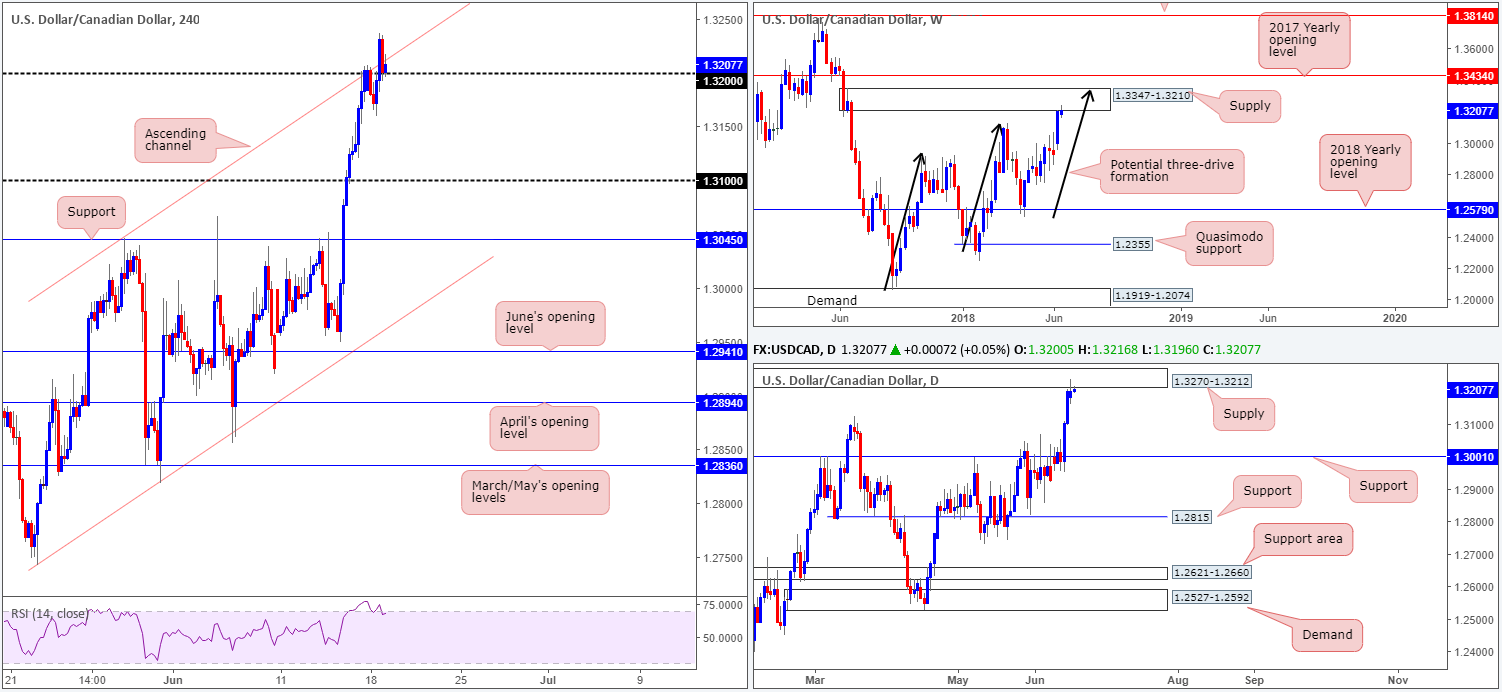
USD/CAD:
Unable to benefit from a recovery in crude oil prices on Monday, the Canadian dollar dipped to its lowest level in almost a year against its US counterpart amid US trading hours.
The USD/CAD, as is shown on the H4 timeframe, firmly breached the 1.32 handle and clocked fresh highs of 1.3237. Shortly after, a retest of 1.32 took shape and remains supportive at this time. Buyers off this level, however, may want to exercise caution. Why? Weekly price is currently kissing the underside of a weekly supply zone at 1.3347-1.3210, along with daily action also challenging the underside of a daily supply at 1.3270-1.3212. On top of this, H4 price continues to shake hands with a H4 channel resistance extended from the high 1.3046, as well as the H4 RSI indicator displaying overbought conditions.
Areas of consideration:
Despite a recent breach of 1.32 on the H4 timeframe, all three timeframes continue to point to a possible downside move this week:
- Weekly price hitting the underside of supply at 1.3347-1.3210.
- Daily price trading at daily supply drawn from 1.3270-1.3212.
- H4 action seen grazing a H4 channel resistance.
Ultimately, we would like to witness a decisive H4 close (preferably in the shape of a full or near-full-bodied bearish candle) back beneath 1.32 in order to confirm bearish intent. In the event that this comes to fruition, traders will likely have their crosshairs fixed on the 1.31 handle as the initial port of call, followed then by H4 support at 1.3045.
Today’s data points: US building permits and Housing starts.
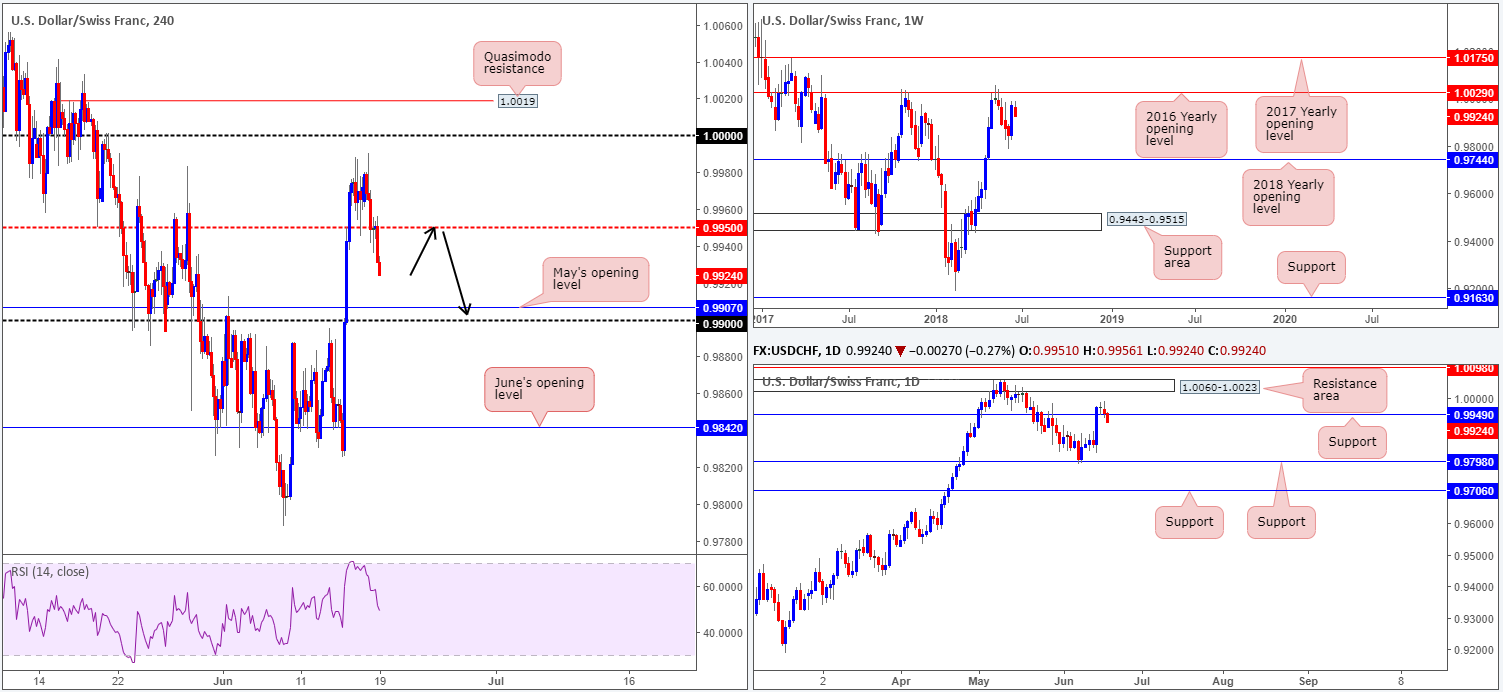
USD/CHF:
Once again, the USD/CHF failed to cross swords with parity (1.0000) on Monday before turning lower. Following a relatively quiet session during Asia hours, the Swissie gained traction in Europe which saw the market connect with H4 mid-level support coming in at 0.9950. In recent hours, however, the pair extended Monday’s losses on the back of US President Donald Trump asking US Trade Representatives to identify $200bln in Chinese goods for further tariffs of 10% if China goes through with its $50bln retaliation threat. This has positioned May’s opening level at 0.9907, shadowed closely by the 0.99 handle, in the firing range.
Traders may have also noticed that recent selling has forced daily price back below support at 0.9949, opening up the possibility for another test of daily support plotted at 0.9798. On the other side of the spectrum, though, weekly price still shows room to probe higher and reconnect with the 2016 yearly opening level at 1.0029: a barrier which held price lower in early May of this year and in late October in 2017.
Areas of consideration:
Intraday, it’d be great to see H4 price retest 0.9950 as resistance for a possible shorting opportunity down to the 0.99 region (as per black arrows).
Longer term, nevertheless, we could potentially be in for a test of daily support mentioned above at 0.9798, should trade talks/threats remain in the limelight, as traders will look to transition into safe-haven assets.
Today’s data points: US building permits and Housing starts.
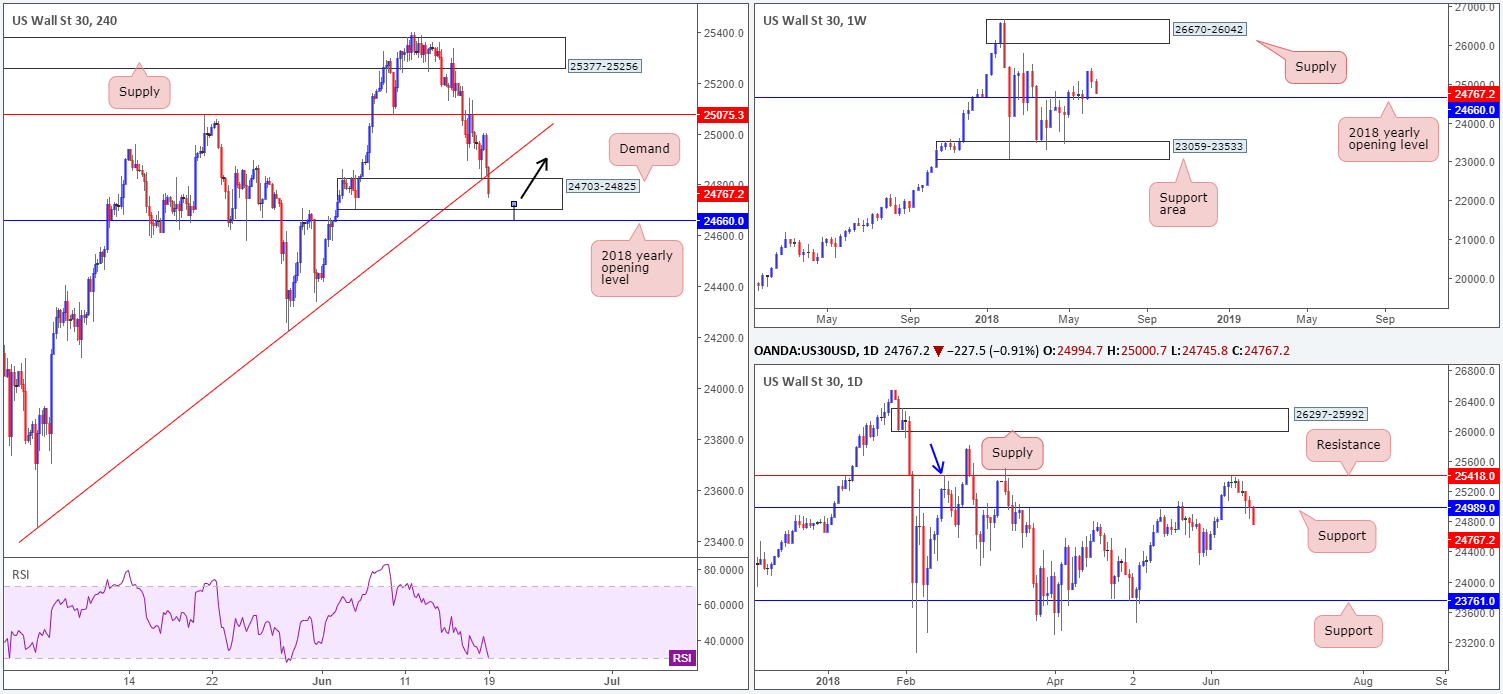
Dow Jones Industrial Average:
US equity indexes concluded Monday’s session on a negative note amid concerns over trade conflict between the US and China. The DJIA, however, extended these losses during Asia this morning after US President Donald Trump asked US Trade Representatives to identify $200bln in Chinese goods for further tariffs of 10% if China goes through with its $50bln retaliation threat.
The move lower forced H4 candles below trend line support taken from the low 23451 into the walls of a H4 demand area drawn from 24703-24825. Furthermore, on the H4 scale we can see that the RSI indicator is trading within striking distance of oversold readings. For those looking to enter long from the H4 demand area, do remain aware that daily price shows room to stretch as far south as the May 29 low at 24224. In addition to this, it is worth noting that directly beneath the current H4 demand zone is the 2018 yearly opening level plotted on the weekly timeframe at 24660.
Areas of consideration:
To our way of seeing things, and this is assuming that trade talks/threats ease, an ideal buy signal would be for H4 price to chalk up a bullish pin-bar formation that pierces through the current H4 demand and brings in the 2018 yearly opening level mentioned above at 24660 (see H4 chart for a visual representation). From this point, the next upside target would likely be the aforementioned H4 trend line support-turned resistance.
Today’s data points: US building permits and Housing starts.
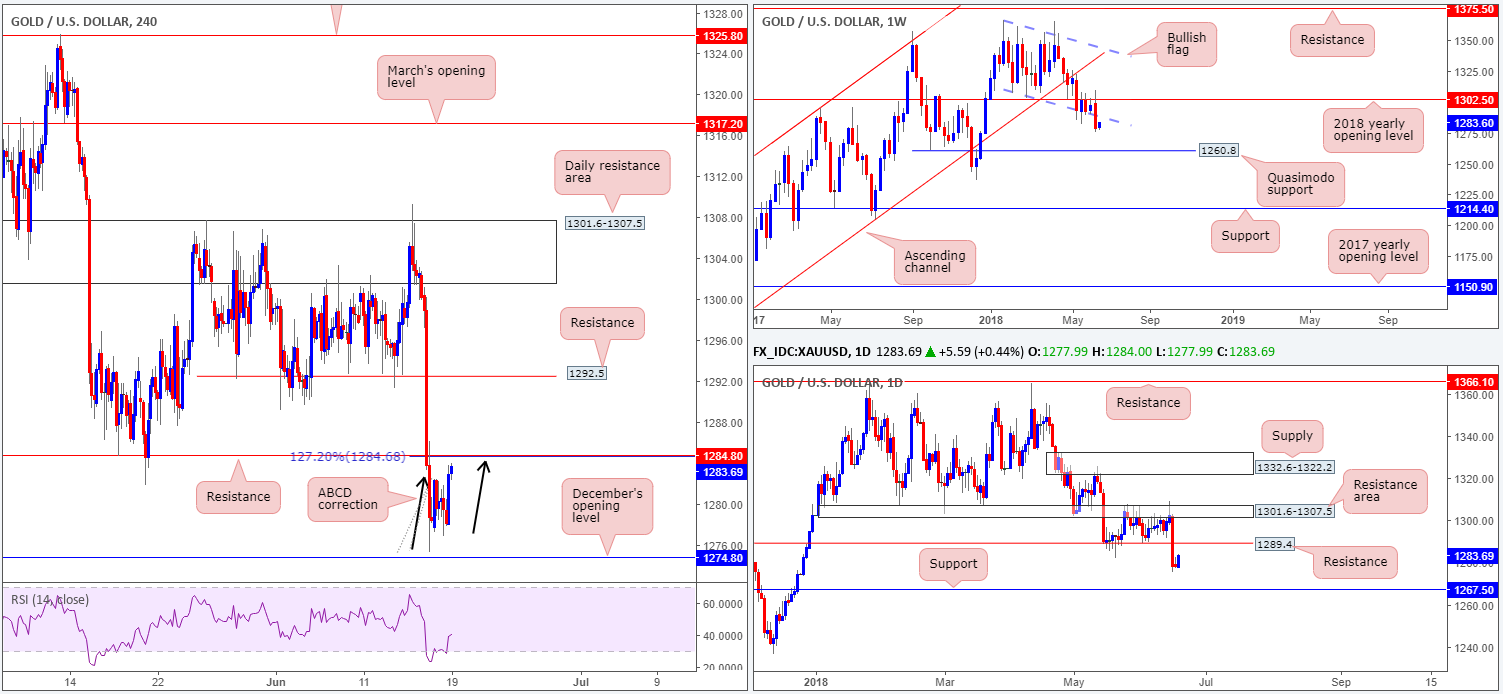
XAU/USD (Gold)
The price of gold is trading with a reasonably strong bias to the upside this morning, as traders flock to the yellow metal amid concerns of a trade war between the US and China. Traders bought heavily into bullion in early Asia after US President Donald Trump asked US Trade Representatives to identify $200bln in Chinese goods for further tariffs of 10% if China goes through with its $50bln retaliation threat. As you can see, this has lifted the yellow metal up to within striking distance of a H4 resistance level coming in at 1284.8. Also of particular interest here is the approach to this level: in the shape of a H4 ABCD correction (black arrows) that terminates at the 127.2% H4 Fib ext. point drawn from 1284.6.
Areas of consideration:
Although the H4 resistance level is considered a reasonably strong base, there are two cautionary points to consider. Firstly, weekly price may drag the unit back up to the underside of the recently broken weekly bullish flag (taken from the low 1307.2), and secondly, daily action is seen approaching a resistance level plotted at 1289.4. Both levels are sited ABOVE the current H4 resistance, which leaves it open to a possible fakeout.
To help overcome this, traders are encouraged to wait and see if H4 price can print a full or near-full-bodied bearish candle off 1284.8 before pulling the trigger. The first area of concern from this point, assuming one manages to pin down a trade short here, is December’s opening level at 1274.8.
The use of the site is agreement that the site is for informational and educational purposes only and does not constitute advice in any form in the furtherance of any trade or trading decisions.
The accuracy, completeness and timeliness of the information contained on this site cannot be guaranteed. IC Markets does not warranty, guarantee or make any representations, or assume any liability with regard to financial results based on the use of the information in the site.
News, views, opinions, recommendations and other information obtained from sources outside of www.icmarkets.com.au, used in this site are believed to be reliable, but we cannot guarantee their accuracy or completeness. All such information is subject to change at any time without notice. IC Markets assumes no responsibility for the content of any linked site. The fact that such links may exist does not indicate approval or endorsement of any material contained on any linked site.
IC Markets is not liable for any harm caused by the transmission, through accessing the services or information on this site, of a computer virus, or other computer code or programming device that might be used to access, delete, damage, disable, disrupt or otherwise impede in any manner, the operation of the site or of any user’s software, hardware, data or property.


