
A note on lower timeframe confirming price action…
Waiting for lower timeframe confirmation is our main tool to confirm strength within higher timeframe zones, and has really been the key to our trading success. It takes a little time to understand the subtle nuances, however, as each trade is never the same, but once you master the rhythm so to speak, you will be saved from countless unnecessary losing trades. The following is a list of what we look for:
- A break/retest of supply or demand dependent on which way you’re trading.
- A trendline break/retest.
- Buying/selling tails – essentially we look for a cluster of very obvious spikes off of lower timeframe support and resistance levels within the higher timeframe zone.
- Candlestick patterns. We tend to only stick with pin bars and engulfing bars as these have proven to be the most effective.
For us, lower timeframe confirmation starts on the M15 and finishes up on the H1, since most of our higher timeframe areas begin with the H4. Stops usually placed 5-10 pips beyond your confirming structures.
EUR/USD:
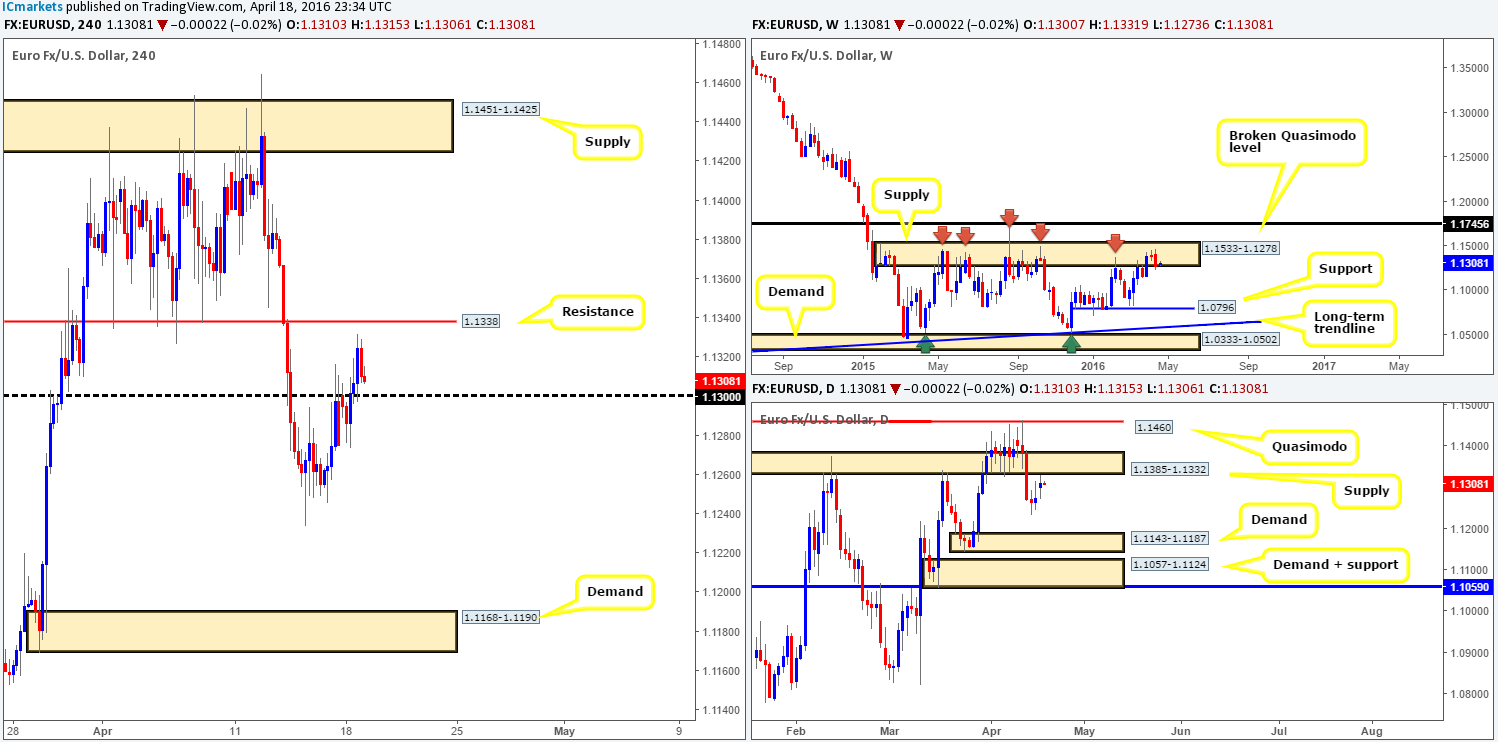
Starting from the top this morning, we can see that the single currency formed a bearish engulfing candle last week within the confines of a weekly supply drawn from 1.1533-1.1278. Should this area hold prices lower for a sixth consecutive time, weekly support at 1.0796 will likely be the next target in the firing range. Lower down the scale, daily action recently retested the underside of a broken demand yesterday at 1.1385-1.1332, consequently forming an indecision candle in the process. Assuming that the bears manage to defend this area, the next zone on the hit list is likely going to be the fresh demand seen below at 1.1143-1.1187. Stepping across to the H4 chart, the EUR/USD shows that early morning trade in London saw price snap through offers at 1.1300 and reach highs of 1.1331 on the day.
Since we know that both the weekly and daily charts show price at supply right now (see above), our prime focus will be on shorting this pair today. To our way of seeing things, there are two ways in which we can approach this market:
- Watch the H4 resistance at 1.1338 for a sell trade. Historically, this level has provided the EUR significant support and resistance in the past, and considering the fact that it sits within both weekly and daily supply (see above) we believe it to be a nice base in which to look for shorting opportunities.
- In the event that price fails to reach the above said resistance, we’ll then be looking for price to break below and retest 1.1300. This would potentially clear the rubble for a try at 14th April lows (1.1233), followed closely by H4 demand at 1.1168-1.1190 (sits within daily demand at 1.1143-1.1187).
Levels to watch/live orders:
- Buys: 1.1338 [Tentative – confirmation required] (Stop loss: dependent on where one confirms this level).
- Sells: Watch for price to consume 1.1300 and look to trade any retest seen thereafter (lower timeframe confirmation required).
GBP/USD:
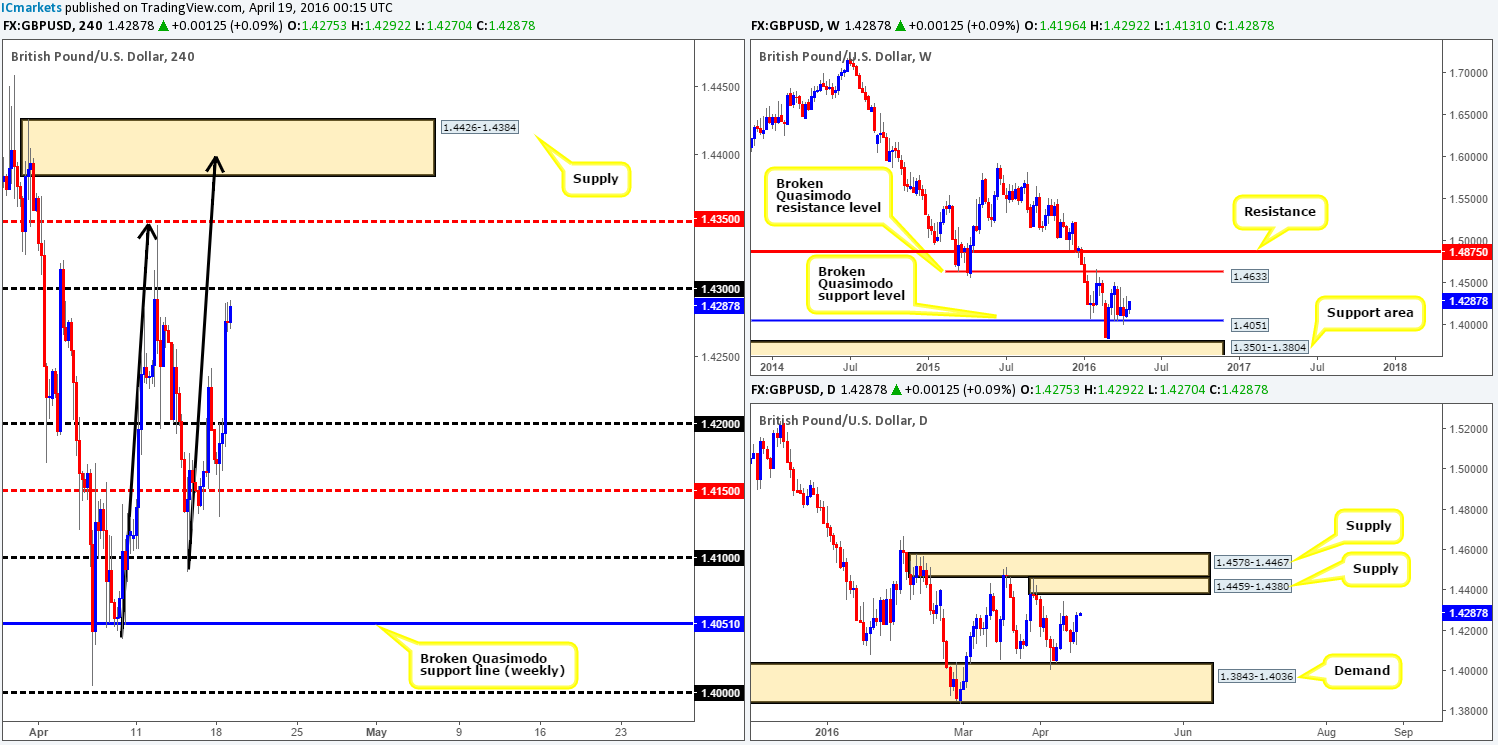
Early on in European trade yesterday price retested the H4 mid-level support at 1.4150 beautifully, which clearly set the tone for the remainder of the day. Consequent to this, psychological resistance 1.4200 was taken out, allowing for price to advance north to highs of1.4290 by the day’s end.
With the weekly still managing to hold firm around a broken Quasimodo support level at 1.4051, and the daily seen loitering between demand at 1.3843-1.4036 and supply drawn from 1.4459-1.4380, where do we go from here? Well, given the above, and also due to the H4 forming an AB=CD bearish pattern which shows scope for a move north prior to completion around H4 supply at 1.4426-1.4384 (sits snug within the daily supply mentioned above at 1.4459-1.4380); our team is swaying slightly to the buy-side of this market.
With these points in mind, we favor a break above the 1.4300 handle sometime today. On the assumption that we’re correct, we’ll be watching for price to retest this number as support together with a confirmation buy setup from the lower timeframes (for confirmation techniques, see the top of this article). Partial profits are to be taken at the mid-level number 1.4350, with the remaining position to be liquidated around H4 supply penciled in at 1.4426-1.4384, as this is where we plan on looking for shorts if this area hits!
Levels to watch/live orders:
- Buys: Watch for price to consume 1.4300 and look to trade any retest seen thereafter (lower timeframe confirmation required).
- Sells: Flat (Stop loss: N/A).
AUD/USD:
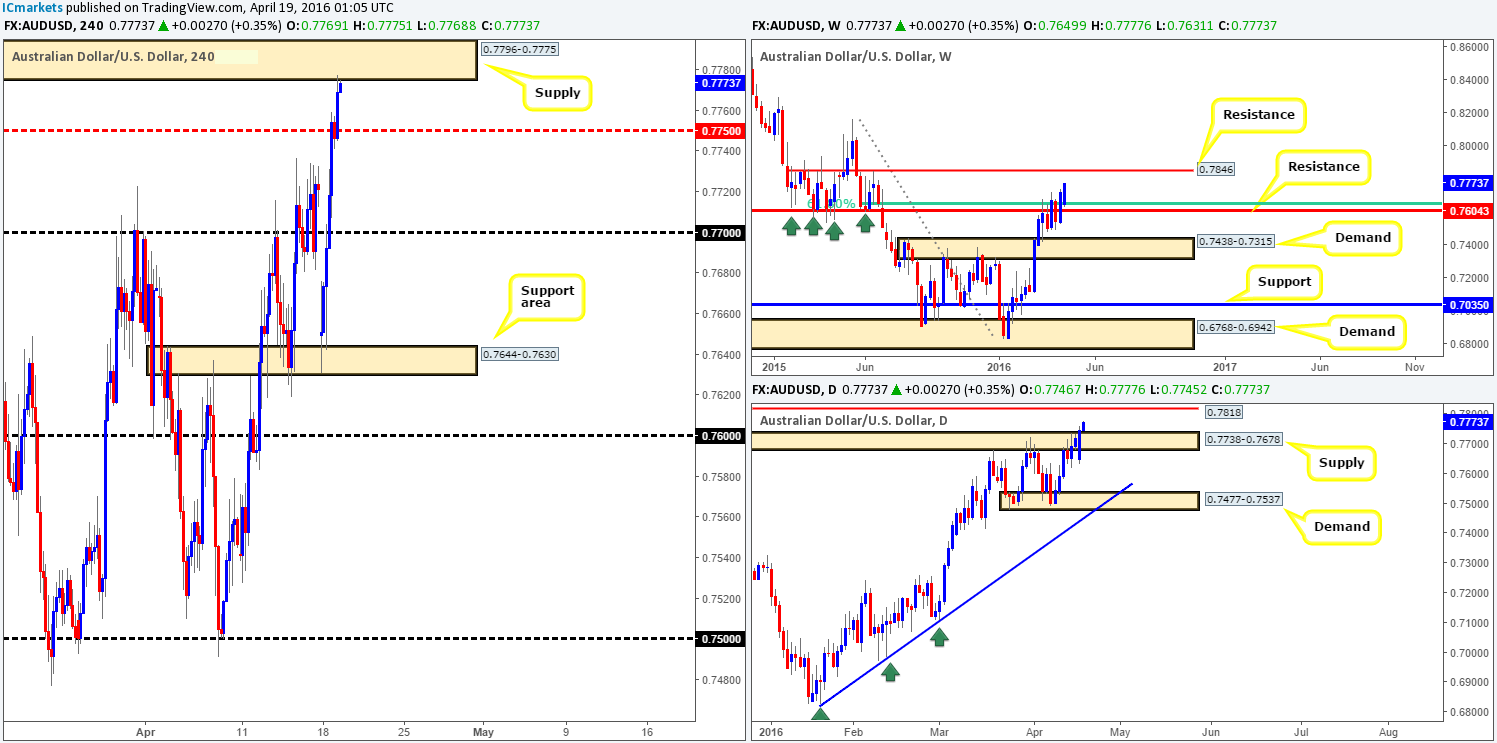
Following Sunday’s open 0.7649, an unrelenting squeeze to the upside took place yesterday. Psychological resistance 0.7700 was wiped out, allowing price to shake hands with H4 supply at 0.7796-0.7775. This recent bullish assault also saw price take out daily supply at 0.7738-0.7678 (now acting demand), potentially clearing the runway north to a daily Quasimodo resistance penciled in at 0.7818. In addition to this, weekly action also closed above the 61.8% Fibonacci resistance line at 0.7646 last week, opening up the possibility for a further advance up to resistance coming in at 0.7846.
In light of the above, the most we see price bouncing to from the current H4 supply is the mid-level barrier 0.7750, so it is not really something that we’d look to trade today. On a break above this area, however, upside is also relatively limited since let’s not forget that there is a daily Quasimodo resistance line sitting just above at 0.7818.
As you can see, there is not much in the way of a tradable setup on the Aussie at present. As such, we’ll patiently await further developments on the sidelines today.
Levels to watch/live orders
- Buys: Flat (Stop loss: N/A).
- Sells: Flat (Stop loss: N/A).
USD/JPY:
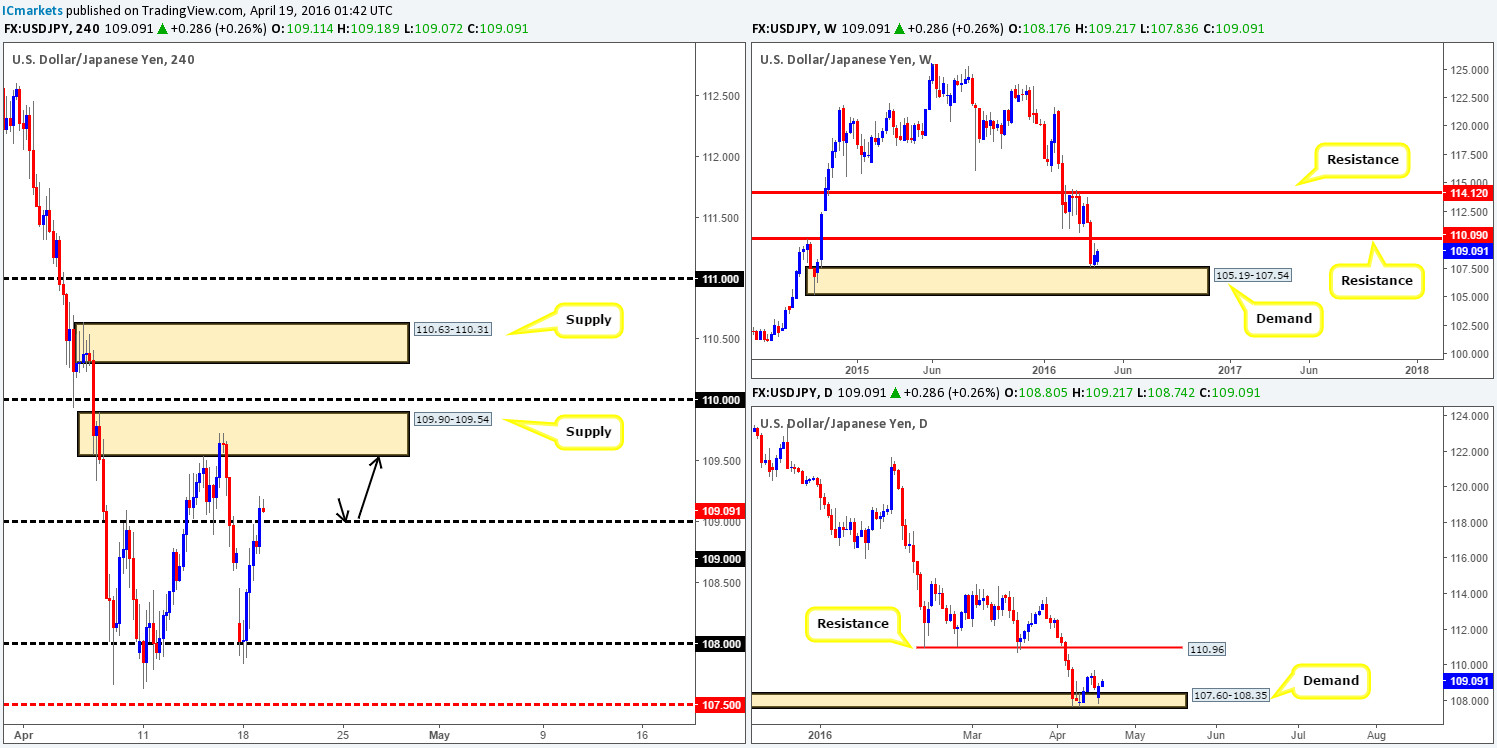
Shortly after a somewhat volatile start to the week, a fresh round of bids came into this market from the 108.00 boundary. This, as you can see, eventually forced the pair to close above 109.00, which in turn will likely attract further buying up to the lower edge of H4 supply coming in at 109.54. This is particularly interesting when considering the higher-timeframe picture. Over on the weekly chart, price remains supported just above demand painted at 105.19-107.54, whilst down on the daily chart, demand coming in at 107.60-108.35 remains well and truly in the game right now.
As things stand, our outlook for today’s action is relatively simple! Watch for price to retest the 109.00 handle and buy with lower timeframe confirmation (for confirmation techniques, see the top of this article), targeting the 109.50 mark as a first take-profit target. Following this, we’d be looking up to the 110.00 line, which if you look over on the weekly chart, is essentially the next upside resistance target at 110.09.
Levels to watch/live orders:
- Buys: 109.00 [Tentative – confirmation required] (Stop loss: dependent on where one confirms this level).
- Sells: Flat (Stop loss: N/A).
USD/CAD:
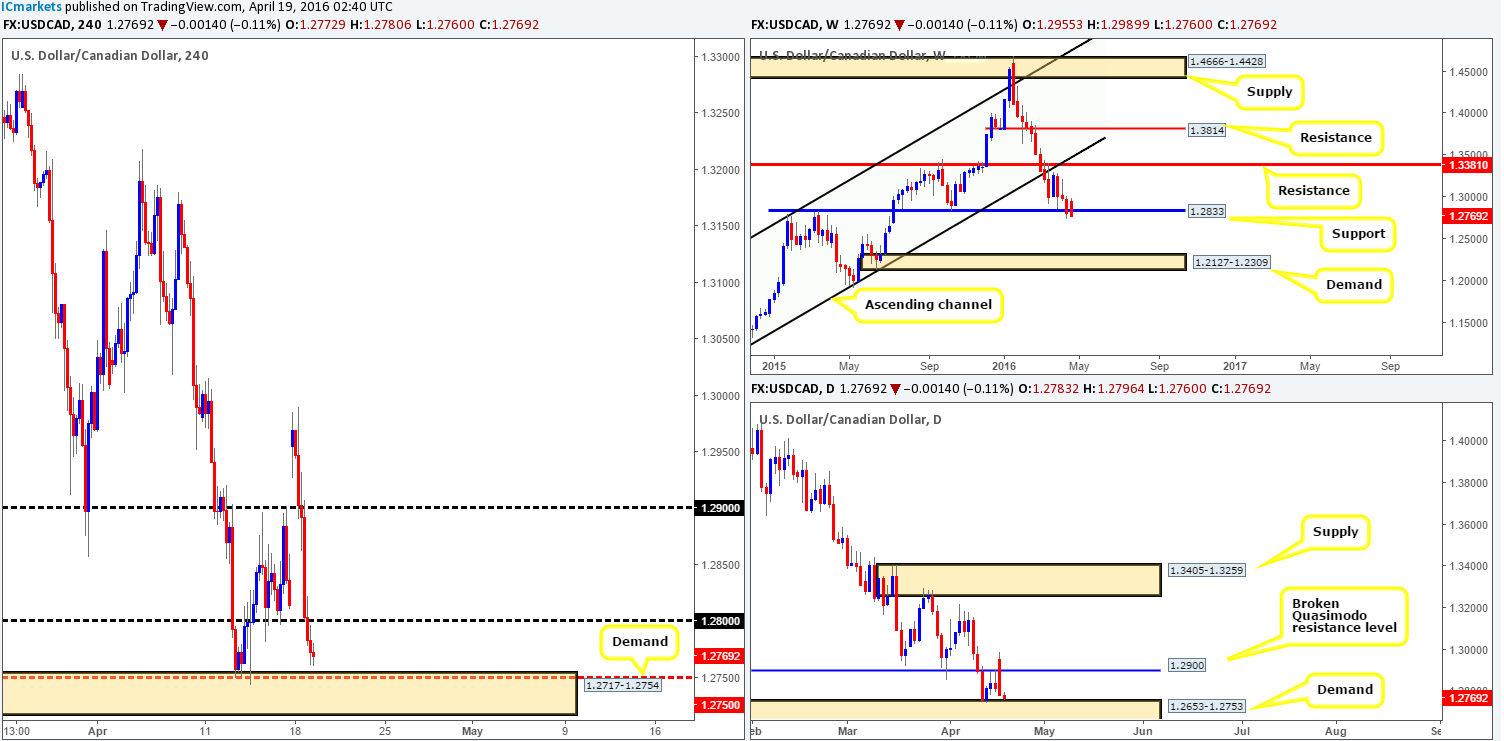
Reporting from the weekly chart this morning, support at 1.2833 is seen struggling to hold ground with price trading beneath this number at the moment. In the event that a sustained move south is seen beyond here, demand drawn from 1.2127-1.2309 is likely the next target on the hit list. Casting our fishing lines down into the daily chart, we can see that yesterday’s session was not a good day for anyone long the U.S. dollar! However, as things stand, price is now lurking just above the top-side of demand given at 1.2653-1.2753.
Moving across to the H4 chart, yesterday’s bearish descent saw price take out not only the 1.2900 line but also the 1.2800 line as well. This has, as shown on the chart, seen price find support just above demand penciled in at 1.2717-1.2754. This demand is certainly an area of interest for our team today, and we would, dependent on how the lower timeframe price action behaved (for confirmation techniques, see the top of this article), consider taking a long position from this base today. Following a satisfactory lower timeframe entry, we’d look to take partial profits around 1.2800 and aggressively reduce risk due to where price is positioned on the weekly timeframe (see above).
Levels to watch/live orders:
- Buys: 1.2717-1.2754 [Tentative – confirmation required] (Stop loss: dependent on where one confirms this area).
- Sells: Flat (Stop loss: N/A).


