
EUR/USD:
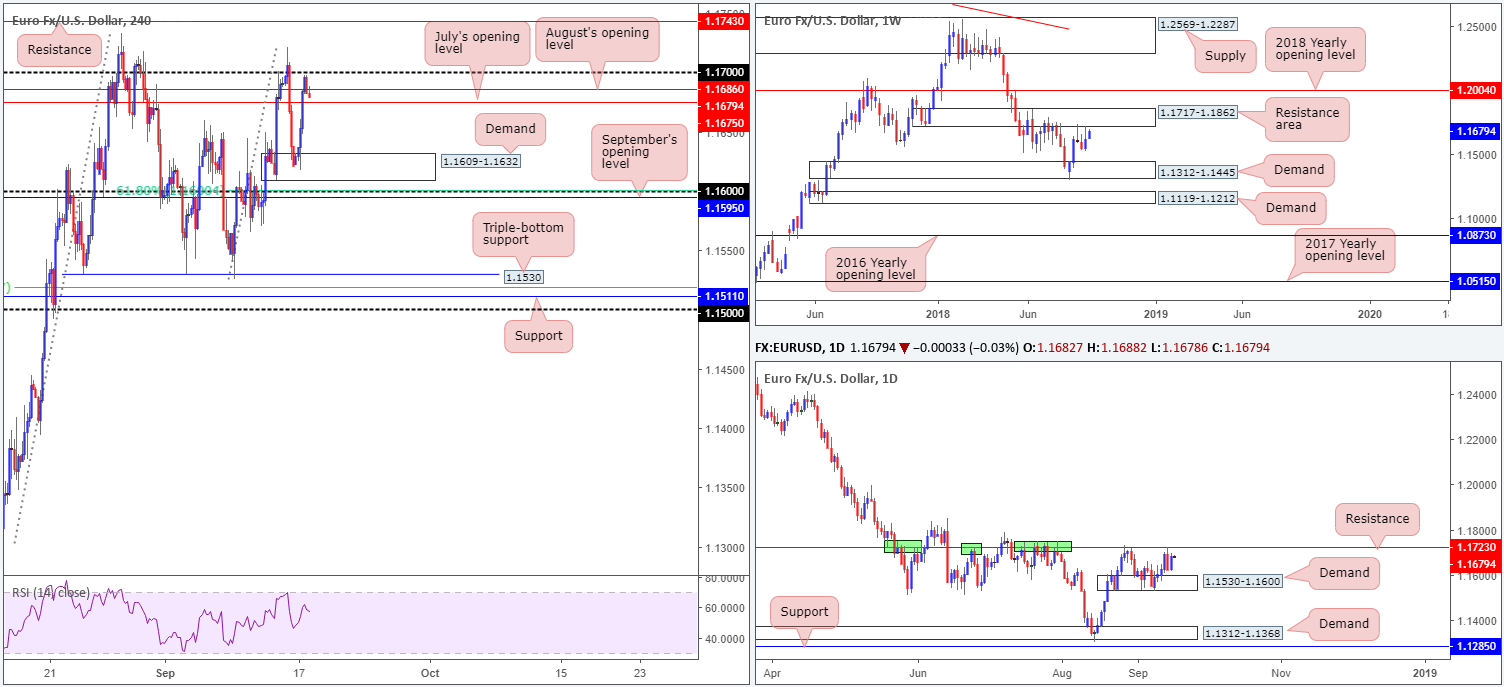
Uncertainty concerning US-China tariffs, along with a weaker-than-expected US empire state manufacturing index reading, provided fresh impetus for the single currency amid Monday’s trade. Unable to break H4 demand plotted at 1.1609-1.1632, the euro rose beyond both July and August’s opening levels at 1.1675/1.1686 and ended the day topping within touching distance of the 1.17 handle. A break of 1.17 today could see the unit head towards notable resistance coming in at 1.1743.
Although yesterday’s movement erased the majority of Friday’s losses, considerable obstacles lie in the way of further gains on the higher timeframes. First among these is the weekly resistance area seen at 1.1717-1.1862. Capping upside in the months of May, June and July of this year, this area certainly has potential! Positioned within the lower range of this weekly zone a hefty daily resistance is also visible at 1.1723.
Areas of consideration:
The higher-timeframe resistances, along with the 1.17 handle on the H4 timeframe, caution against an exuberantly bullish approach today/this week.
A H4 close beneath July’s opening level at 1.1675 from current price could trigger a bout of selling back towards the current H4 demand. A retest to the underside of 1.1675 following a close lower will likely draw in sellers, so do keep your eyes open for this possibility today.
However, should we break through 1.17, intraday traders will likely have their crosshairs fixed on the H4 resistance level mentioned above at 1.1743 for possible shorting opportunities. This level warrants particular attention. Not only because it’s a well-rounded resistance, but also due to where it is positioned on the higher timeframes!
Today’s data points: ECB President Draghi speaks.
GBP/USD:
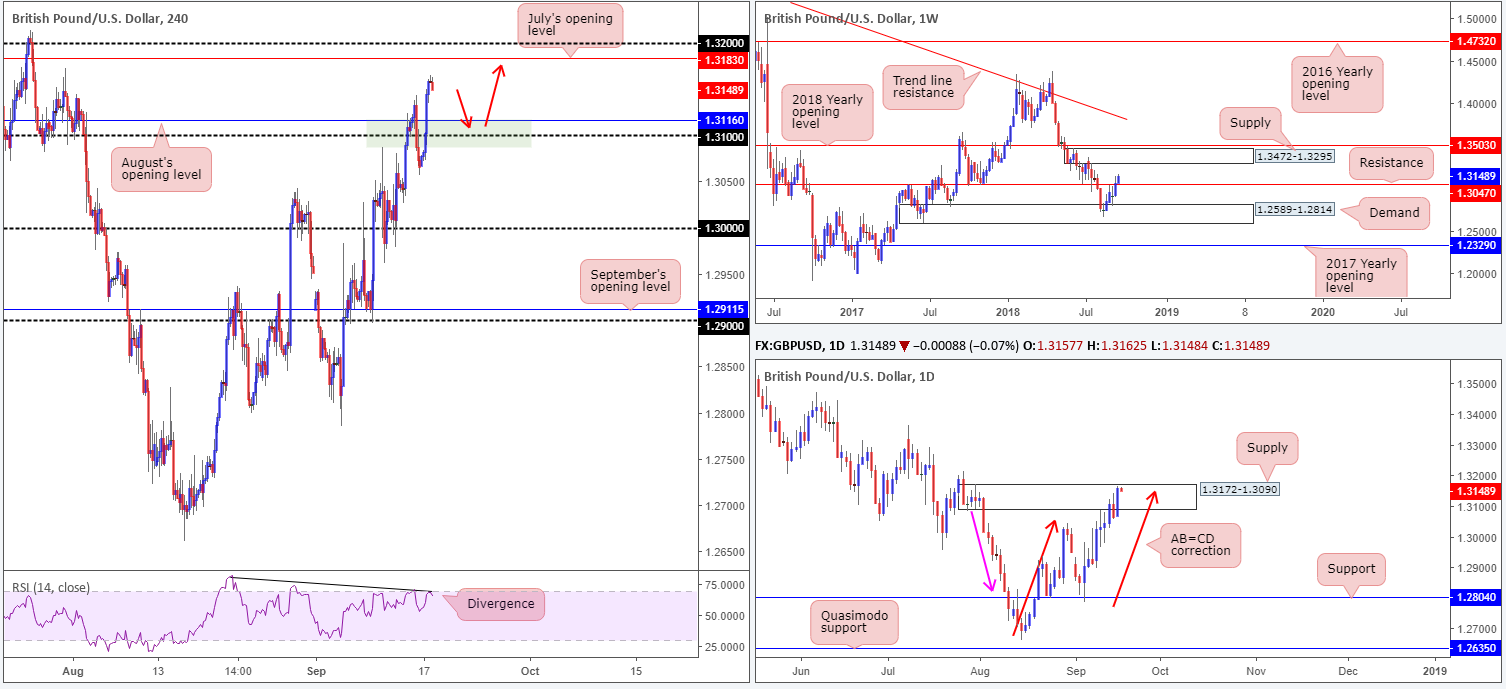
The British pound advanced to fresh 6-week highs vs. its US counterpart on Monday, placing the market firmly above the 1.31 handle on the H4 timeframe, as well as August’s opening level at 1.3116. Reports the EU is becoming more flexible with Brexit negotiations continues to support the GBP ahead of Brexit talks later this week, despite some recent tough comments from UK PM May regarding Brexit. The weaker USD also benefitted sterling on Monday, as the US dollar index printed a fresh downside test of 94.50.
On the H4 timeframe this morning, upside resistances fall in around the July 31 high at 1.3173, followed closely by July’s opening level at 1.3183 and then the 1.32 handle. Also worth noting on this scale is the RSI indicator continues to display divergence nearby its overbought value.
The story on the weekly timeframe, nonetheless, shows weekly price attacked higher ground in recent trade, firmly clearing resistance at 1.3047. Assuming further upside is observed this week, the next destination is likely to be a supply zone seen printed at 1.3472-1.3295. Contrary to weekly positioning, daily price is seen trading within the upper range of a supply zone priced in at 1.3172-1.3090. Besides this supply emphasizing a strong base (check out the downside momentum – pink arrow), the area fuses with an AB=CD correction (red arrows) point at 1.3150ish.
Areas of consideration:
Having seen the H4 candles conquer 1.31 yesterday, along with weekly price pointing to further buying, the current daily supply zone is considered an unreliable sell zone. Of course, this is not to say a sell from here will not work out, as the daily supply does emphasize a strong position. It’s just knowing both H4 and weekly structure indicate the bulls have the upper hand right now, a sell in this market is chancy.
On account of the above, traders may also be interested in a retest play off of 1.31 today (red arrows). Stop-loss orders, according to the technical picture, are best placed below the grey zone around the 1.3080 point, with an initial target objective set at around the July 31 high at 1.3173.
Today’s data points: Limited.
AUD/USD:
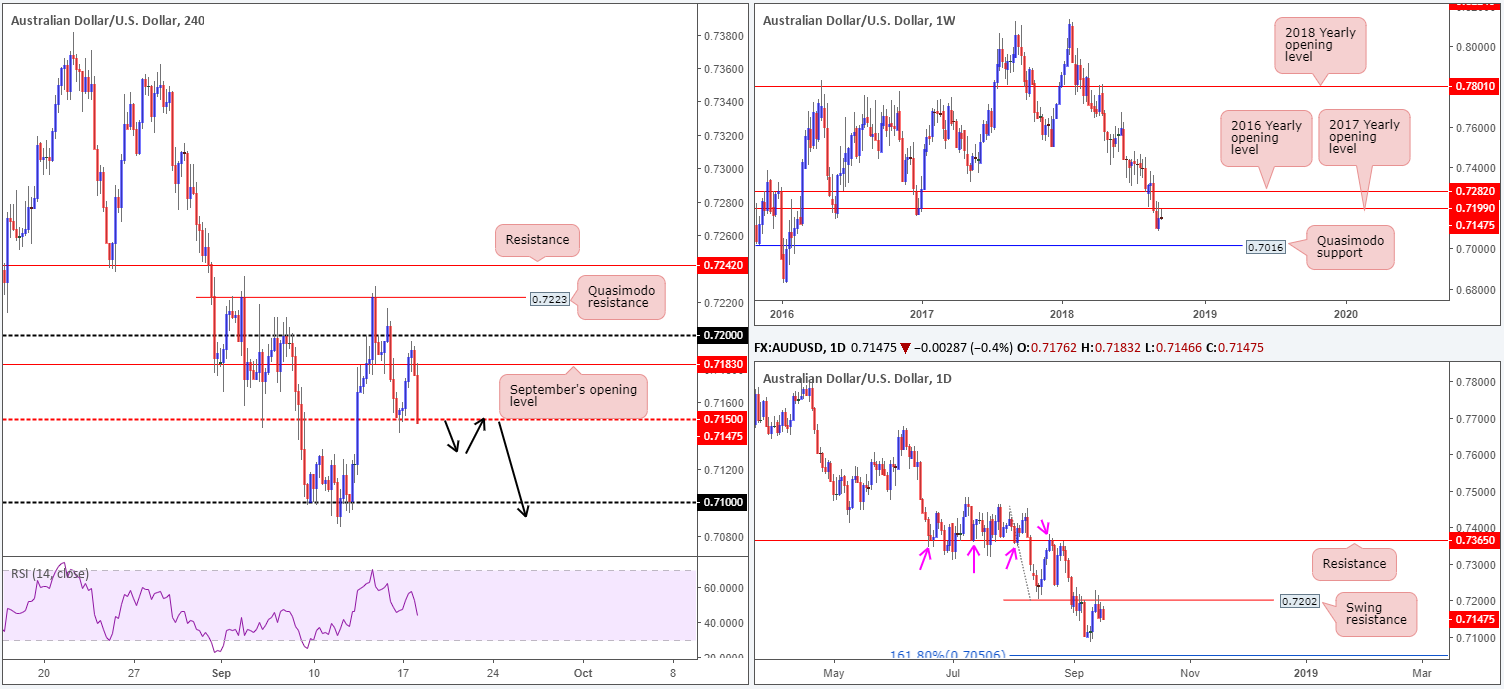
The commodity currency found broad support off the H4 mid-level barrier at 0.7150 on Monday. This – coupled with a waning greenback – spurred a round of buying to highs of 0.7196. Leaving the 0.72 handle unchallenged, however, the market is currently seen dialing back in anticipation of tariff announcements from US President Donald Trump in the latest round of the US-China trade war.
As of current price, the H4 candles are seen retesting 0.7150, currently notching up heavy losses in early Asia today. In terms of the higher timeframes, weekly flow is seen languishing beneath its 2017 yearly opening level at 0.7199. On that premise, further selling could be in store this week, targeting a Quasimodo support level seen at 0.7016. In conjunction with weekly structure, swing resistance on the daily timeframe at 0.7202 did a superb job in capping upside last week. The next downside target on this scale can be seen around the September 11 low at 0.7085, followed closely by a 161.8% Fib ext. point at 0.7050 (taken from the high 0.7453).
Areas of consideration:
Having seen limited support visible on the higher timeframes until reaching the 0.7085 point, entering long from 0.7150 on the H4 scale may not be the path to take. An alternative approach is to wait for H4 price to engulf 0.7150 and trade its retest (assuming one takes place). A retest in the shape of a bearish candlestick formation would, according to the overall picture presented here, be enough evidence to suggest we’re at least heading towards 0.7085.
Tuesday brings another round of the Reserve Bank of Australia’s (RBA) Meeting Minutes, though with the central bank adopting a wait-and-see stance for over two years, traders are not expecting much to be drawn here.
Today’s data points: AUD Monetary policy meeting minutes; AUD HPI q/q.
USD/JPY:
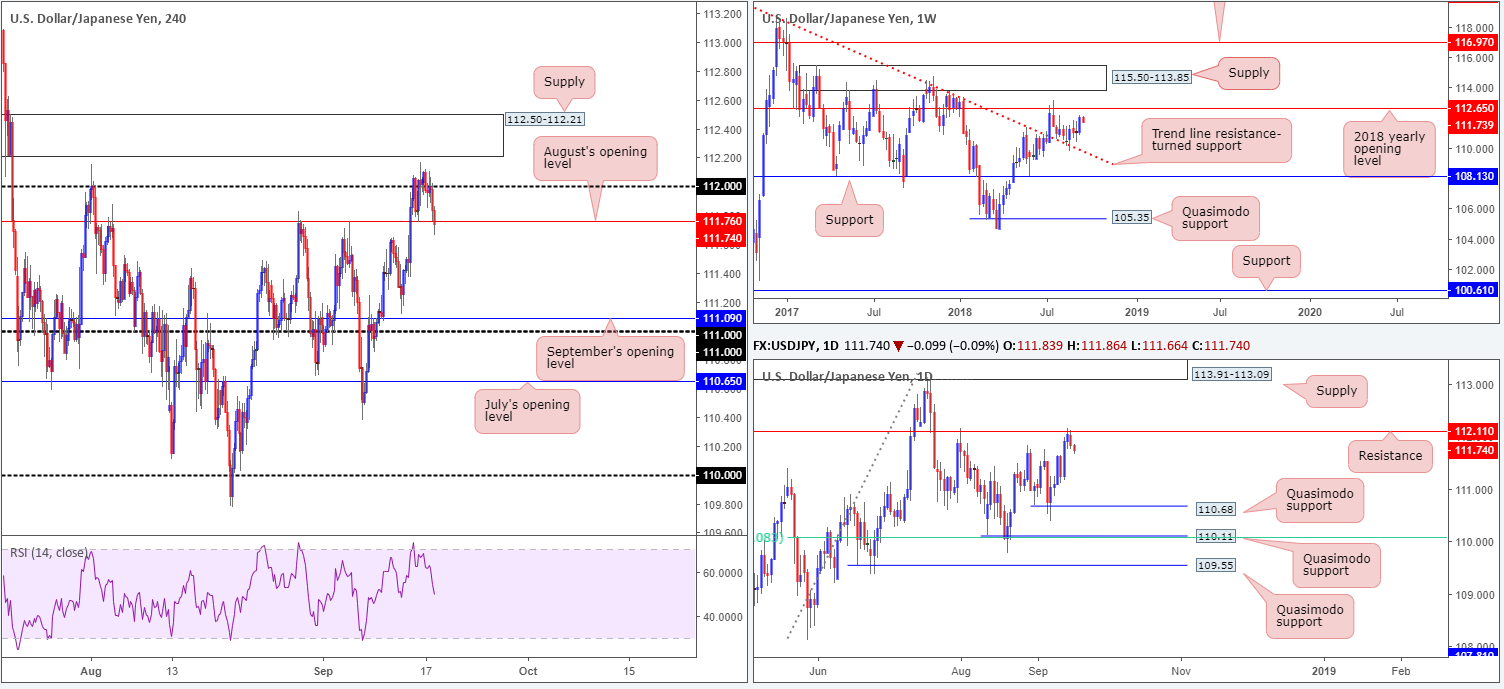
The USD/JPY surrendered all of Friday’s gains on Monday, as the unit failed to sustain an upside presence above its 112 handle. A holiday in Japan kept the pair ranging at the beginning of the day, though as we moved into US hours the market travelled to lower levels, influenced by a waning USD across the board.
Another theme likely driving the USD/JPY lower on Monday was the daily resistance at 112.11, which happens to boast a notable history dating back as far as February 2017. In the event sellers remain defensive beneath this point, a number of Quasimodo supports lie in wait. The closest barrier can be seen at 110.68. In terms of the weekly picture, a strong retest seen off a trend line resistance-turned support (taken from the high 123.57) was observed a few weeks back and has positioned the pair just ahead of the 2018 yearly opening level at 112.65. Traders should note this level already held price lower in July of this year.
Areas of consideration:
On one side of the coin we have weekly price still suggesting further buying may be on the cards, while on the other side, daily structure emphasizes caution to the upside. Irrespective of the direction one selects here, opposing structure is clearly seen. Therefore, neither a long nor short appears attractive on a medium-term level.
Intraday (H4), however, could witness a modest downside move towards September’s opening level at 111.09. Should the market observe a H4 close print beneath August’s opening level at 111.76 that’s followed up with a retest in the shape of a bearish candlestick formation, shorting this market could be an option today.
Today’s data points: Limited.
USD/CAD:
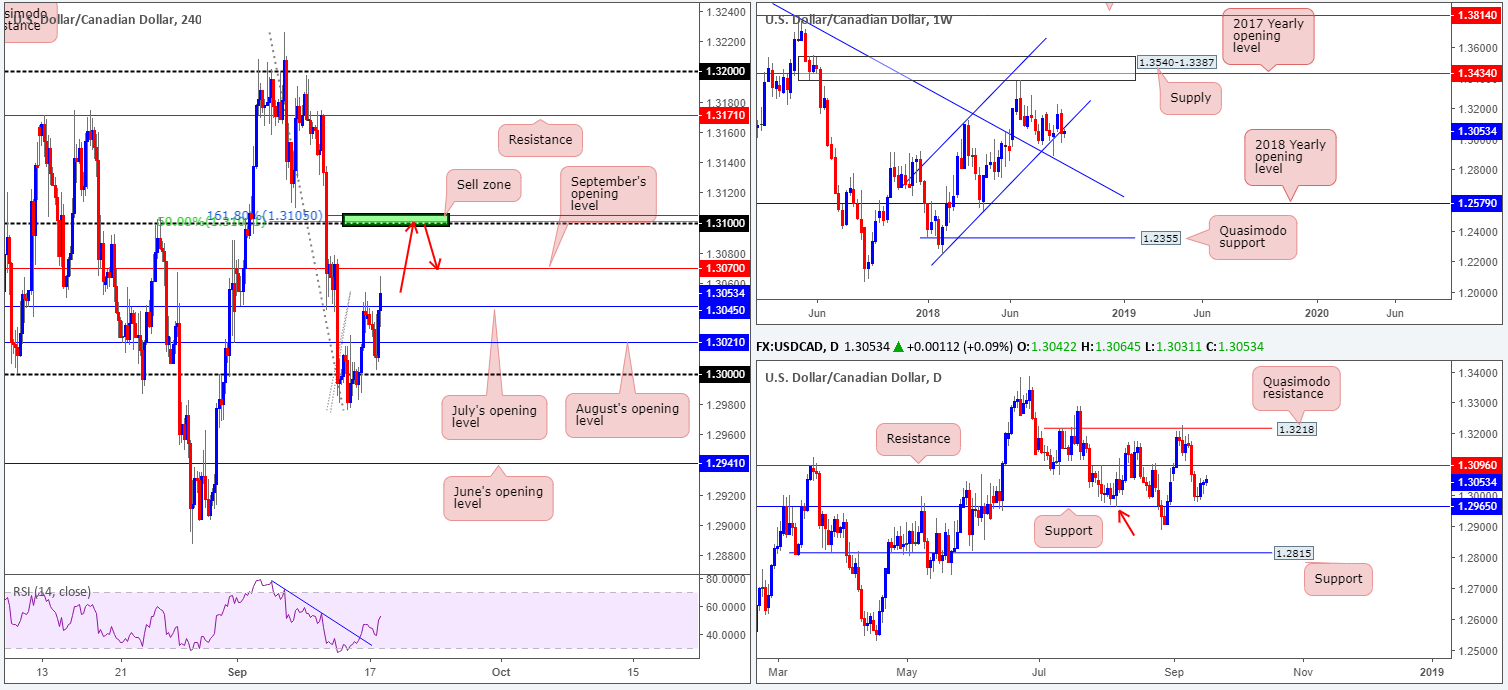
In recent sessions, the USD/CAD retreated to lows just north of the key figure 1.30 and advanced northbound, wrapping up the day in positive territory. To the upside on the H4 scale, we have September’s opening level on the radar at 1.3070, followed by the 1.31 handle. 1.31 remains a central focus in our analysis for potential shorts. The ingredients behind this number come down to the following points:
- Since the beginning of the year, the USD/CAD has been compressing within a weekly ascending channel formation (1.2247/1.3098). Of late, however, the market observed a mild bearish close around the lower edge of this channel, with price action currently poised to retest the underside of its base which fuses with the 1.31 neighborhood.
- Daily resistance is seen at 1.3096.
- 1.31 converges with a 161.8% H4 Fib ext. point at 1.3105 and a 50.0% H4 resistance value at 1.3101.
Areas of consideration:
Given psychological numbers are prone to fakeouts, waiting for a bearish candlestick formation to take shape is an option. Unfortunately, support is seen close by from 1.31 at September’s opening level drawn from 1.3070. For that reason, aggressive trade management may be necessary here.
Today’s data points: CAD Manufacturing sales m/m.
USD/CHF:
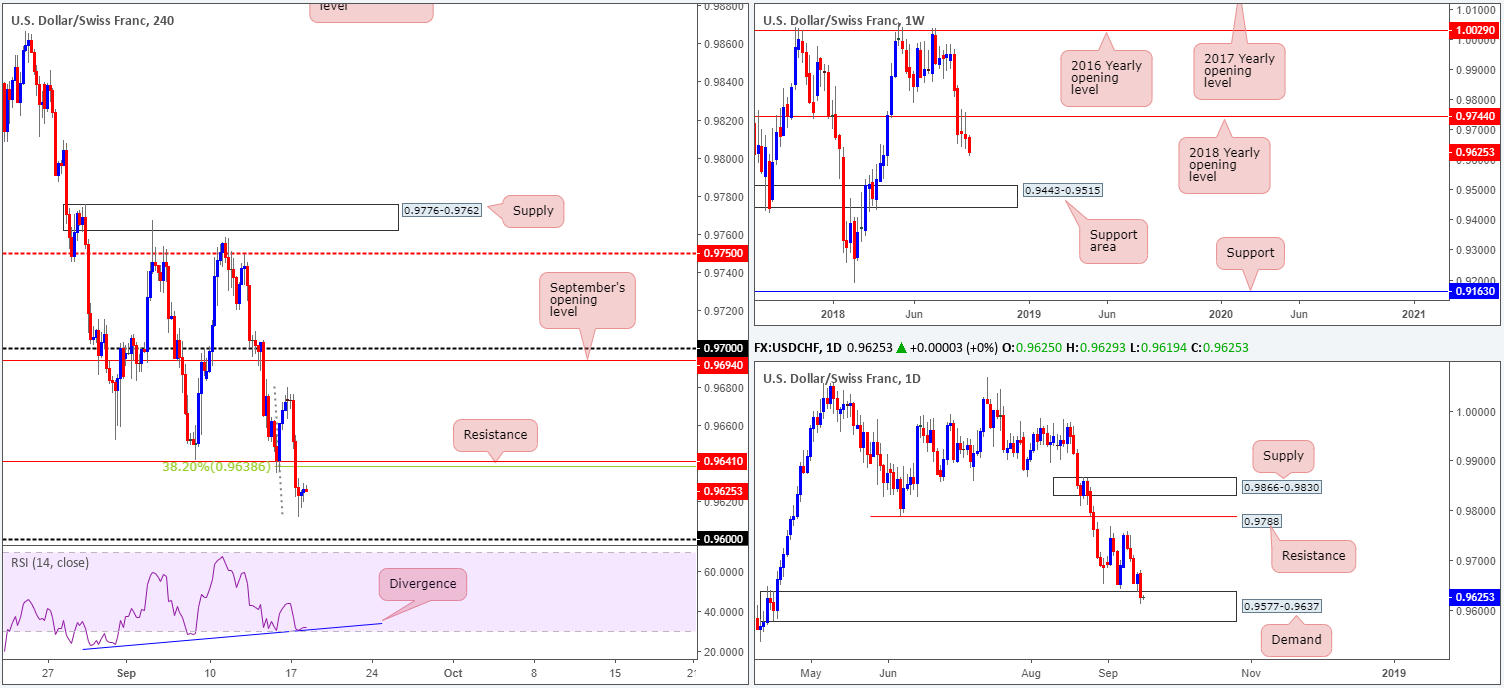
The USD/CHF rate fell below a key level of H4 support at 0.9641 (now acting resistance) on Monday, refreshing multi-month lows. Aggravated by a weaker-than-expected US empire state manufacturing index reading, as well as escalating US-China trade tensions triggering a fresh wave of global risk aversion, we can see daily price drove deeper into demand territory at 0.9577-0.9637 in the shape of a bearish candlestick formation. It might also be worth noting the H4 RSI indicator is seen displaying a divergence reading nearby its oversold value.
On the weekly timeframe, nevertheless, the market recently observed an additional retest to the underside of the 2018 yearly opening level at 0.9744. With limited support seen on this scale until reaching the 0.9443-0.9515 area, further downside could still be in store!
Areas of consideration:
In favour of shorts from H4 resistance at 0.9641, we have the following:
- A 38.2% H4 Fib resistance at 0.9638.
- Weekly direction showing limited support.
- With the immediate trend.
In favour of longs from the 0.96 handle, there’s the following to consider:
- Daily demand at 0.9577-0.9637.
- H4 RSI divergence.
Irrespective of which level one chooses, waiting for additional candlestick confirmation is recommended.
Today’s data points: Limited.
Dow Jones Industrial Average:
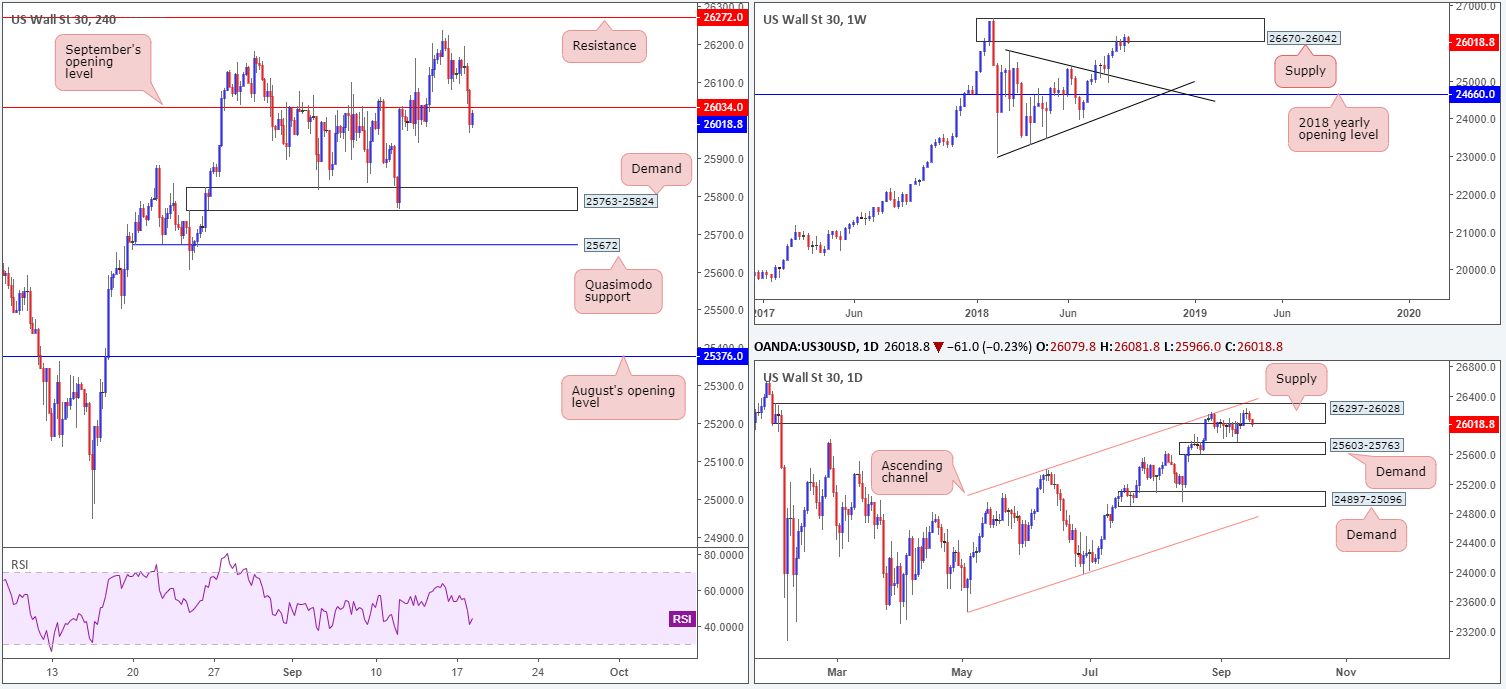
Rising concerns over US-China trade weighed on market sentiment during Monday’s sessions. H4 price, as you can see, ceded a key support level at 26034: September’s opening level, after topping out at highs of 26195. On this timeframe, the ducks are being lined up for a possible approach towards a demand base coming in at 25763-25824.
Supporting the current bearish tone is both weekly and daily structure. The index remains toying with the lower range of a weekly supply seen at 26670-26042, following a strong retest off a trend line resistance-turned support (etched from the high 25807) a few weeks back.
In terms of the daily timeframe, strong supply at 26297-26028 also remains in the fold. What gives this area credibility comes down to the following:
- Downside momentum drawn from the base is incredibly strong.
- The zone intersects with a nearby daily channel resistance (taken from the high 25399).
- Glued to the underside of the aforesaid weekly supply area.
Areas of consideration:
On account of where we’re positioned on the higher timeframes right now, a retest play around the underside of September’s opening level mentioned above at 26034 could be seen today. A H4 bearish candlestick formation printed from 26034 is, therefore, considered a high-probability short setup.
Today’s data points: Limited.
XAU/USD (Gold):
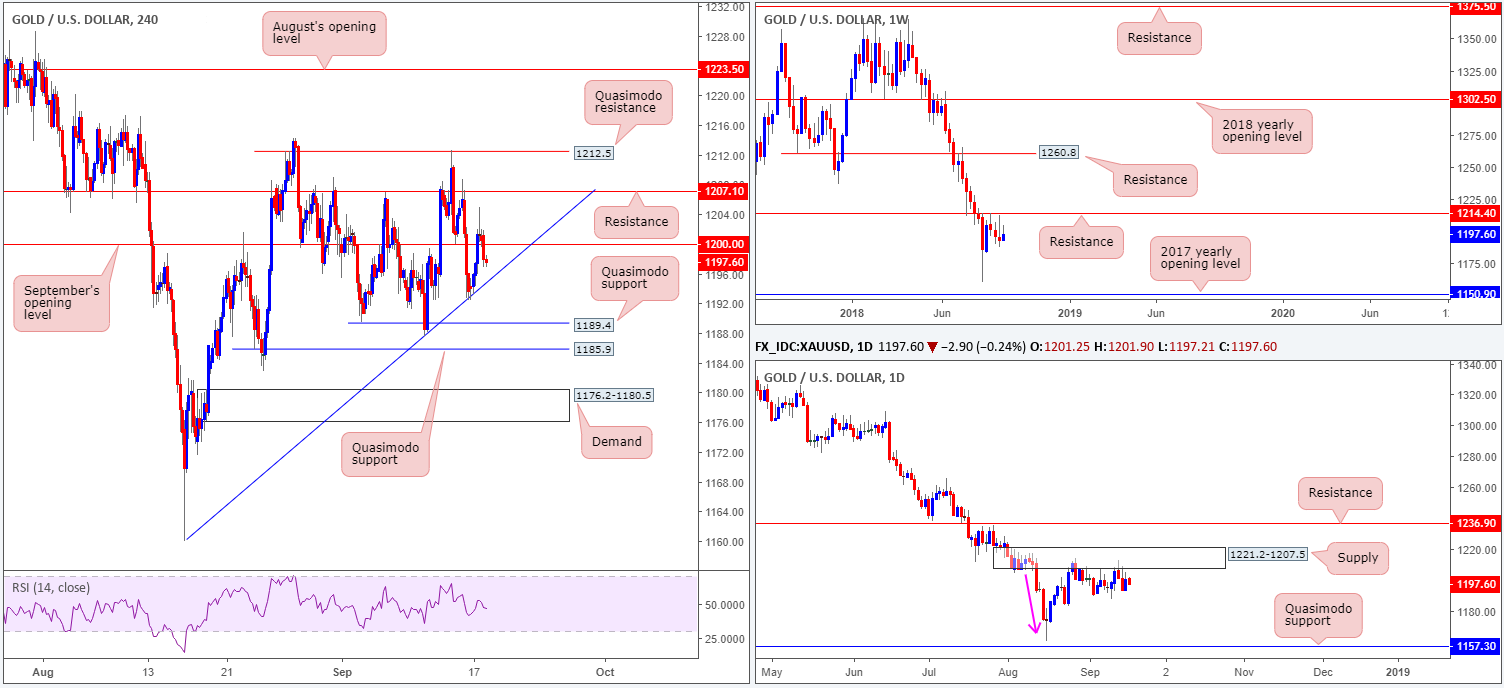
The yellow metal continued to respect its H4 trend line support (extended from the low 1160.0) on Monday, advancing beyond September’s opening level at 1200.0 to a session high of 1204.9. As the US dollar index bottomed around lows of 94.46, however, the price of gold turned lower and, in recent hours, reclaimed September’s open level to the downside.
The question is, how long will this trend line support bolster this market? Not only do we have weekly price languishing beneath resistance marked at 1214.4, daily movement is seen checking in with a nice-looking supply zone at 1221.2-1207.5. Aside from this zone displaying attractive downside momentum from its base (see pink arrow), it could also be considered the ‘decision point’ to print 2018 yearly lows of 1160.3. Couple this with the fact we are also coming off weekly resistance, we still potentially have ourselves some strong sellers in the mix.
Areas of consideration:
Longer term, the daily Quasimodo support at 1157.3 is a logical downside target, followed closely by the 2017 yearly opening level at 1150.9 on the weekly timeframe.
Intraday (H4), on the other hand, displays a number of supportive structures in view right now, though are these areas worthy of long positions knowing where we are coming from on the bigger picture? Probably not. Beyond the current H4 trend line support, there are two Quasimodo supports in sight at 11895.9/1189.4.
The most we expect from the noted H4 supports is a bounce at best.
Unfortunately, at current price we do not see much to hang our hat on in terms of possible selling opportunities. Yes, one could look to play the break/retest of the current H4 trend line support, though with the nearby Quasimodos positioned nearby, this offers unacceptable risk/reward.
On account of the above, neither a long nor short is attractive right now.
The use of the site is agreement that the site is for informational and educational purposes only and does not constitute advice in any form in the furtherance of any trade or trading decisions.
The accuracy, completeness and timeliness of the information contained on this site cannot be guaranteed. IC Markets does not warranty, guarantee or make any representations, or assume any liability with regard to financial results based on the use of the information in the site.
News, views, opinions, recommendations and other information obtained from sources outside of www.icmarkets.com.au, used in this site are believed to be reliable, but we cannot guarantee their accuracy or completeness. All such information is subject to change at any time without notice. IC Markets assumes no responsibility for the content of any linked site. The fact that such links may exist does not indicate approval or endorsement of any material contained on any linked site.
IC Markets is not liable for any harm caused by the transmission, through accessing the services or information on this site, of a computer virus, or other computer code or programming device that might be used to access, delete, damage, disable, disrupt or otherwise impede in any manner, the operation of the site or of any user’s software, hardware, data or property.


