
A note on lower timeframe confirming price action…
Waiting for lower timeframe confirmation is our main tool to confirm strength within higher timeframe zones, andhas really been the key to our trading success. It takes a little time to understand the subtle nuances, however, as each trade is never the same, but once you master the rhythm so to speak, you will be saved from countless unnecessary losing trades. The following is a list of what we look for:
- A break/retest of supply or demand dependent on which way you’re trading.
- A trendline break/retest.
- Buying/selling tails – essentially we look for a cluster of very obvious spikes off of lower timeframe support and resistance levels within the higher timeframe zone.
- Candlestick patterns. We tend to only stick with pin bars and engulfing bars as these have proven to be the most effective.
EUR/USD:
During the course of yesterday’s sessions, we can see that the EUR currency spent most of the day bounded by 1.1119 and the 4hr swap (support) barrier at 1.1072. Risk/reward considerations would argue (at least from our perspective) against attempting to trade this temporary 4hr range amid today’s sessions, especially since the 1.1100 handle is lodged in between.
A push above offers at 1.1119 on the other hand, could suggest further upside towards the 4hr supply zone coming in at 1.1187-1.1158 – a profit objective of nearly forty pips. If 1.1072 is taken out,however, the 4hr demand area at 1.1009-1.1039 would likely be the next objective to reach – a distance of around thirty pips. In our opinion, price is more likely to break south, since room to continue loweris being seen on the daily chart from the recent bounce off of the daily swap (resistance) level at 1.1148.
For us personally, the small space available for price movement today makes it extremely difficult to trade. As such, remaining flat until more conducive price action presents itself is the route we’ve chosen to take.

Levels to watch/live orders:
- Buys:Flat (Stop loss: N/A).
- Sells:Flat (Stop loss: N/A).
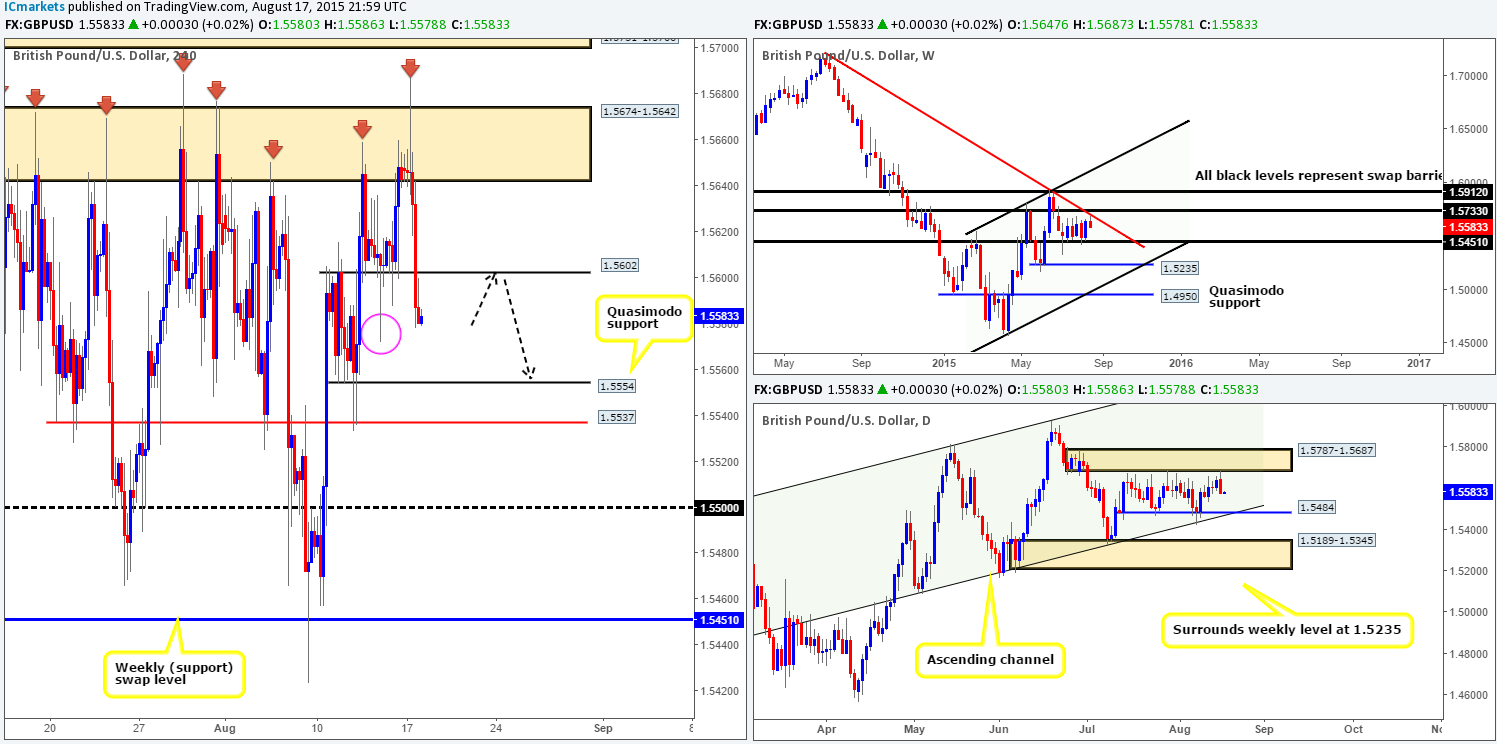
GBP/USD:
Going into the early hours of yesterday’s European session, price aggressively faked abovethe 4hr resistance base at1.5674-1.5642 before falling sharply. This selling continued throughout both the London and U.S. sessions, consequently taking out 1.5602/1.5600and retesting as resistance into the close 1.5580.
The fakeout above the aforementioned 4hr resistance not only came close to connecting with a weekly trendline resistance (1.7166), but also hit and respected a daily resistance area coming in at 1.5787-1.5687. This – coupled with the path south on the 4hr timeframe now likely clear down to 1.5554 opens up the possibility to apotential shorting opportunity today. In addition to this, there is a very prominent 4hr demand consumption tail seen marked with a pink circle at 1.5571. This, at least to us, suggests demand is very likely weak in and around this region, as a huge amount of bids was likely consumed due to this spike.
As we just mentioned, price has effectively already retested 1.5600, so we may have potentially missed the boat to sell this market so to speak. Nonetheless, in the event that price retests 1.5602/1.5600 (black arrows) once more before hitting 1.5554 (our first take-profit level), we would still consider a short assuming that we have lower timeframe confirmation.
Levels to watch/ live orders:
- Buys: Flat (Stop loss: N/A).
- Sells: 1.5600 [Tentative – confirmation required] (Stop loss: dependent on where one confirms this level).
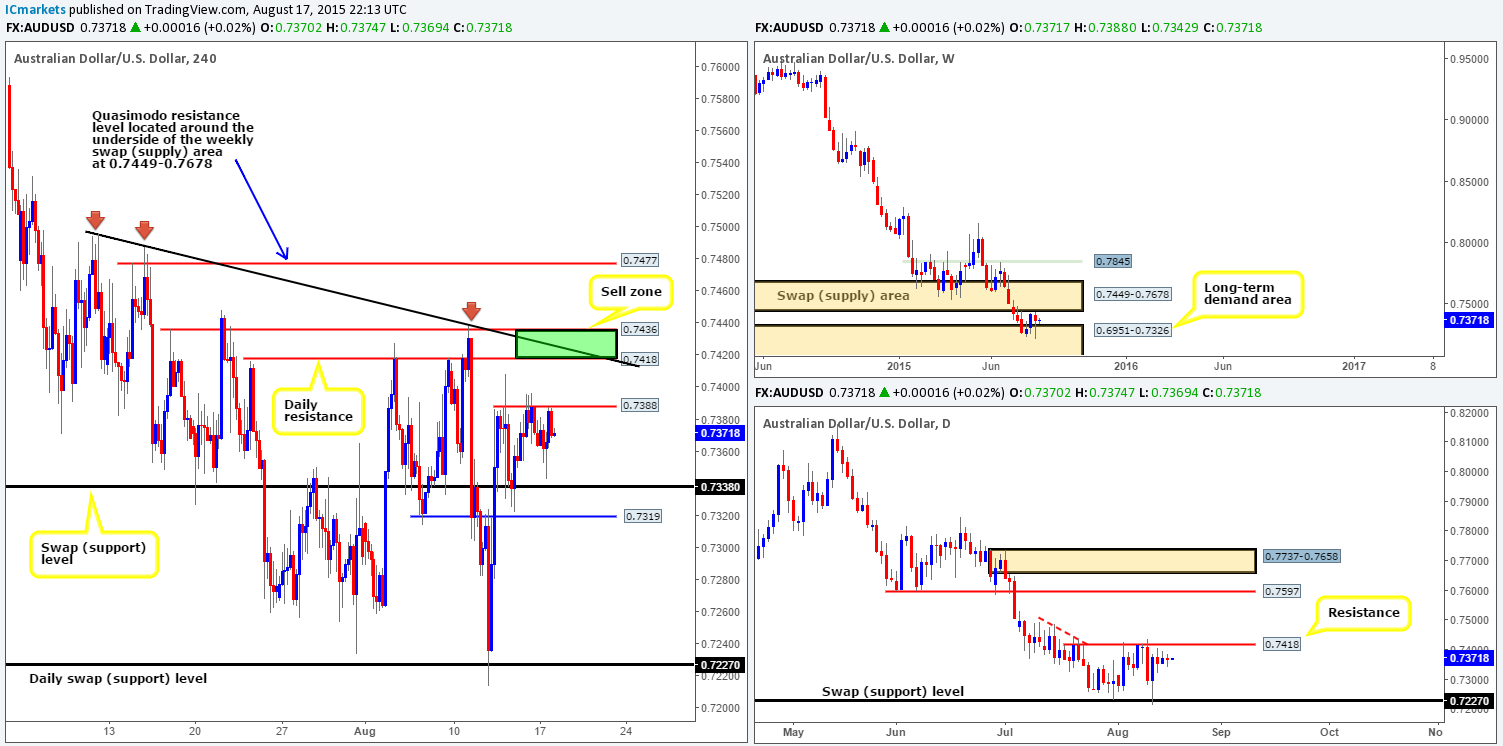
AUD/USD:
Yesterday’s action saw the Aussie dollar continue to sell-off from Friday’s rebound off of 4hr resistance at 0.7388. This move, as you can see, brought price down to session lows of 0.7342, before rebounding back up to 0.7388 into the close 0.7370. Considering that the market is now trading around yesterday’s opening price, much of the following analysis will remain similar to the previous…
With 0.7388 currently holding the Aussie lower right now, this could pull prices down to test the 4hr swap (support) level at 0.7338 sometime today. However, this is not really what we’re interested in.
Check out both the weekly and daily timeframes. Price has yet to connect with either daily resistance at 0.7418, or the weekly swap (supply) area at 0.7449-0.7678. As such, there is, as far as we can see, still room to appreciate further this week. Assuming that this does occur, we’ll be looking for 0.7388 to be consumed (hence the lack of interest at this level) and for price to join hands with 0.7418/0.7436 – our sell zone. The only grumble we have in selling here is that price could fake higher to cross swords with 0.7447 – essentially the lower edge of the aforementioned weekly swap (supply) zone. Therefore, we’d recommend waiting for some sort of lower timeframe selling signal here before risking capital on this idea.
Levels to watch/ live orders:
- Buys: Flat (Stop loss: N/A).
- Sells: 0.7418/0.7436 [Tentative – confirmation required] (Stop loss: dependent on where one finds confirmation within this area).
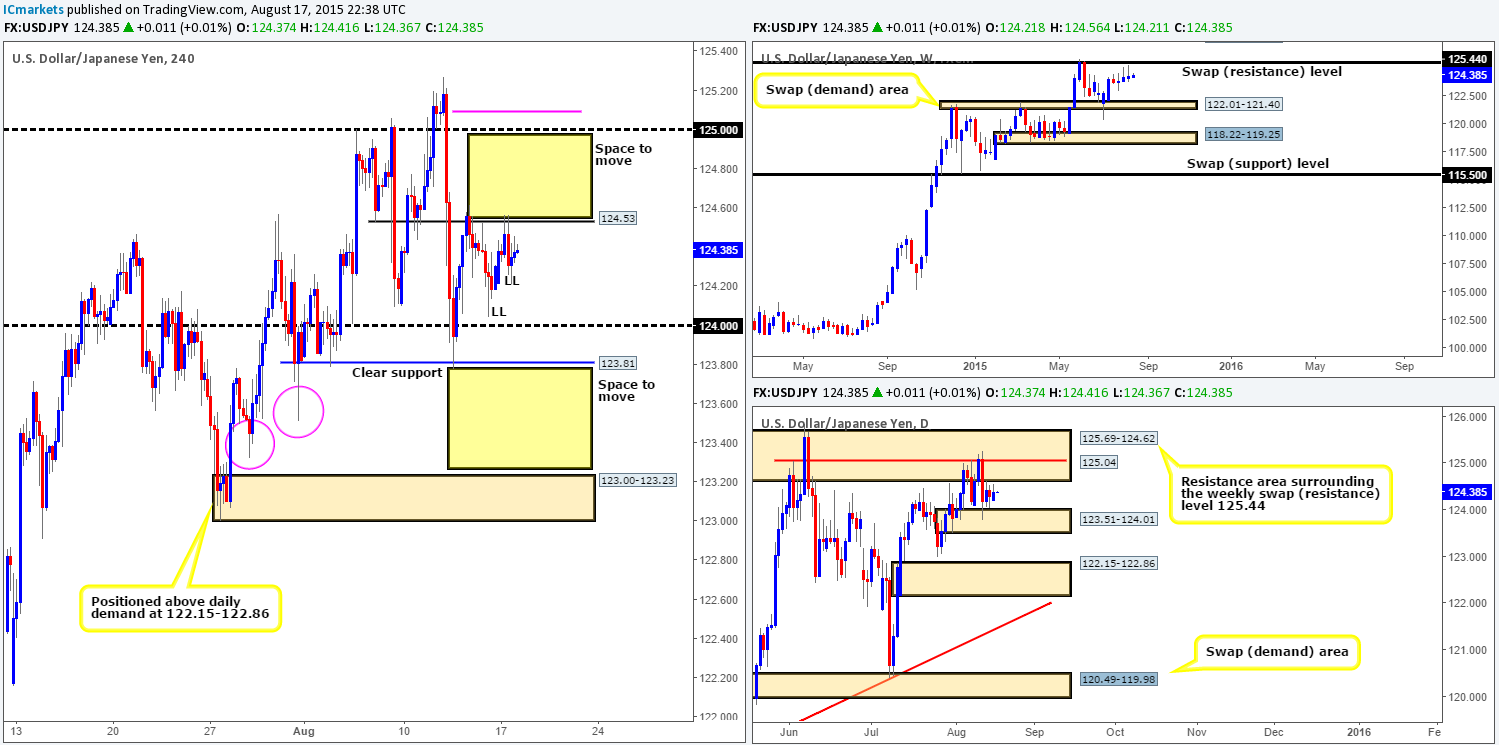
USD/JPY: (Slightly revised from yesterday’s report)
Following Sunday’s open 124.21, a conservative wave of bids entered the market yesterday; pushing prices up to a 4hr swap (resistance) level at 124.53. This, as you can see, held the market lower for the rest of the trading day stretching to a session low of 124.21. 124.53, in our opinion, appears weak at the moment. The first rebound (13/08/15) moved price around fifty pips lower, whereas the second retest only moved (at the time of writing) the market thirty or so pips – offers drying up maybe?
So, if price cuts through 124.53 today, we should look to buy the retest, right? According to the 4hr timeframe structure, this would be a valid trade since there is space seen for price to move between 124.53 and 125.00. However, when taking into consideration that yet another weekly bearish pin-bar candle formed twenty or so pips below the weekly swap (resistance) level at 125.44 last week, we remain hesitant. On top of that, let’s not forget that price is currently sandwiched between a daily resistance area at 125.69-124.62, and a daily demand zone at 123.51-124.01.
On that account, what if price sells off today? In the event that this does occur and price takes out both 124.00 and 123.81, we may then see prices decline all the way down to 4hr demand coming in at 123.00-123.23. Here’s why…
- Space for price to move lower between 123.81 and the aforementioned 4hr demand zone.
- As just mentioned, selling tails printed just below the weekly swap (resistance) level at 125.44. In addition to this, there is also space for price to move lower down to the weekly swap (demand) area at 122.01-121.40.
- The 4hr demand consumption tails painted (pink circles) at 123.51/123.32 suggests that below 124.00, the path south is clear of major bids until the aforementioned 4hr demand area.
So, to sum up, if price breaks above 124.53, be very careful in trading the break since this could end up being a fakeout. Supposing that both 124.00/123.81 is consumed, we’d then likely look to enter short on any confirmed retest of this area, targeting 4hr demand at 123.00-123.23.
Levels to watch/ live orders:
- Buys: Flat (Stop loss: N/A).
- Sells: Watch for 124.00/123.81 to be consumed and then look to enter on a retest at this area (confirmation required).
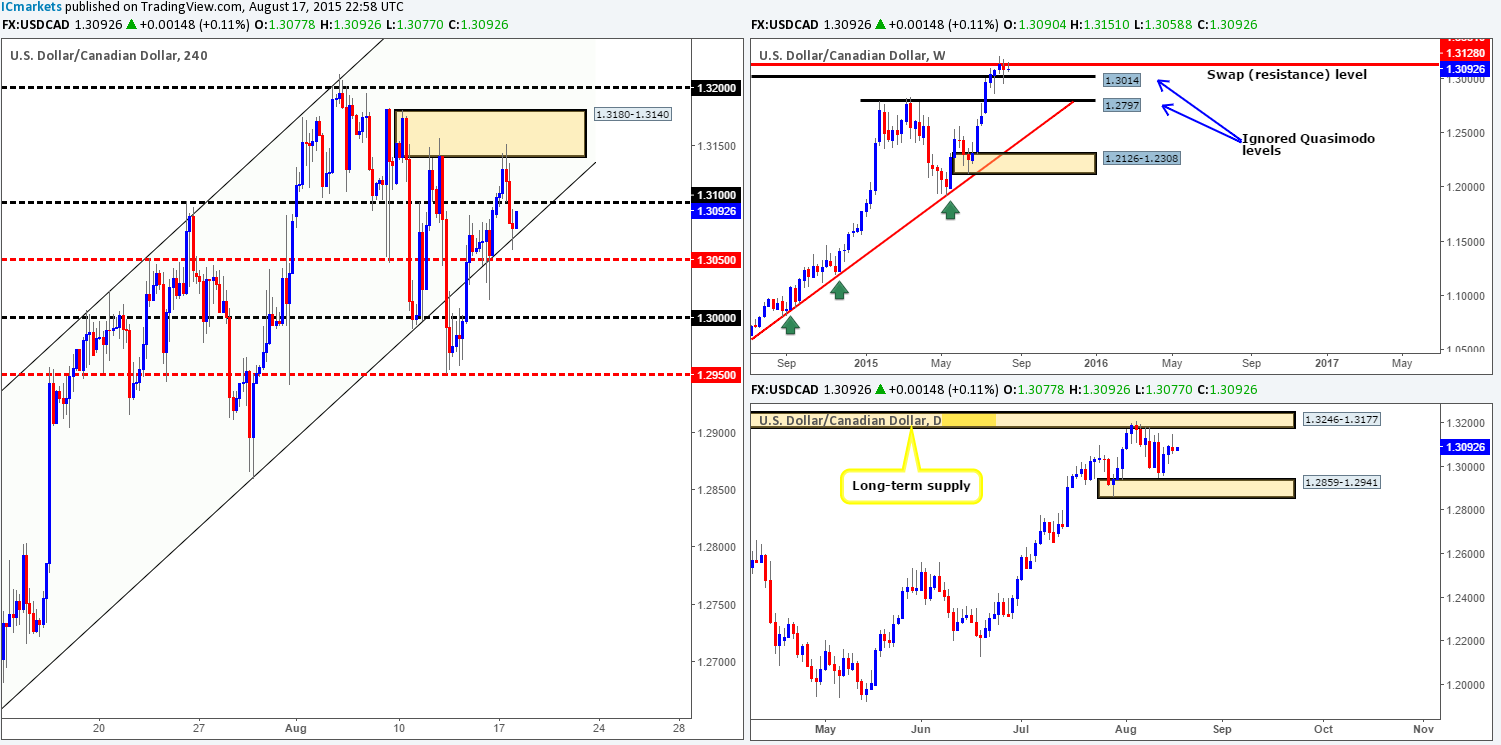
USD/CAD:
In the midst of yesterday’s trade, price broke above 1.3100 (as reported may happen) and crossed swords with a near-term 4hr supply zone coming in at 1.3180-1.3140. From here, we can see that price aggressively sold off, once again surpassing 1.3100 and driving into the lower limit of the 4hr ascending channel (1.2652/1.3023) support.
Even though we have seen price (to a degree) ignore 1.3100, entering long just below this number is a risky trade in our book. What is more, price is not only seen holding beneath the weekly swap (resistance) level at 1.3128 at the moment, but has also printed a selling tail just below a daily supply at 1.3246-1.3177.
Therefore, given the room we have to play with on this pair at the moment, opting to stand on the sidelines here may be the best path to take.
Levels to watch/ live orders:
- Buys: Flat (Stop loss: N/A).
- Sells:Flat (Stop loss: N/A).
USD/CHF:
Early on into yesterday’s sessions, price spiked/faked above the 4hr swap (supply) zone at 0.9766-0.9785, and just missed connecting with the 0.9800 handle before selling off. The market managed to reach as low as 0.9741 on the day before pushing back up to the aforementioned 4hr swap (supply) zone.
Given that price sold off just below 0.9800 suggests to us that there is strong supply within this region. This – coupled with the fact that price is lurking just below a weekly swap (resistance) level at 0.9796 at the moment makes this an attractive price level to sell at. For this reason, we’re still very interested in trading this number if the lower timeframe price action is agreeable. However, please do remain conscious to the fact that price has just bounced off of a daily swap (support) level at 0.9712, hence the need for confirmation here.
Supposing that 0.9800 is taken out today, however, this may open the gates for prices to challenge 4hr supply at 0.9903-0.9871. To trade this potential 70-100 pip move, we’d require a retest of 0.9800 as support along with corresponding lower timeframe confirmation. This in turn would also push prices back up to just below the weekly Harmonic Bat completion zone at 1.0015-0.9926, which if hit, would be a superb location to short from.
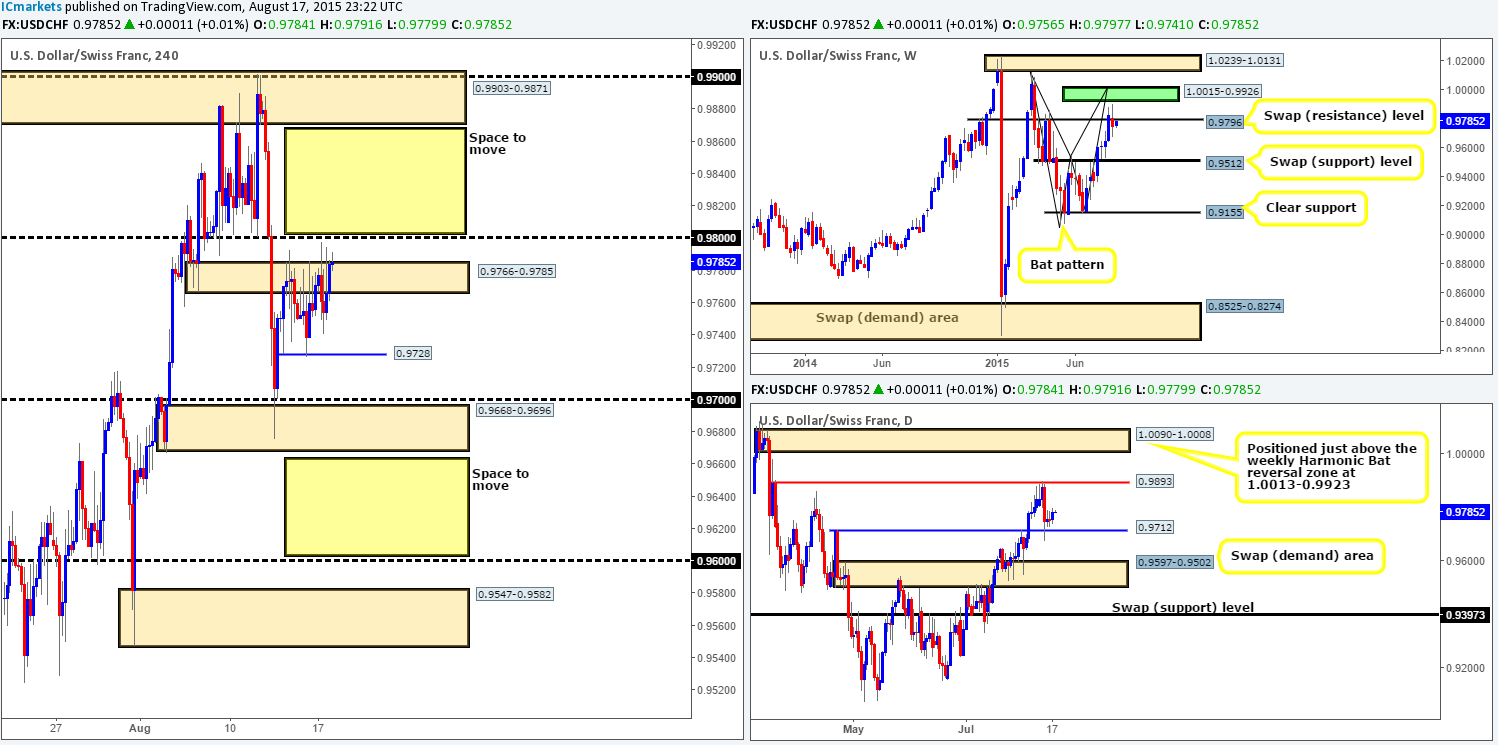
Levels to watch/ live orders:
- Buys: Watch for 0.9800 to be consumed and then look to enter on a retest of this number (confirmation required).
- Sells: 0.9800 [Tentative – confirmation required] (Stop loss: dependent on where one confirms this level).
DOW 30:
Mid-way through yesterday’s London morning session the DOW saw a relatively heavy stream of offers come into the market, thereupon pulling price down to retest a 4hr swap (support) level at 17373. This support, as you can see, held steady going into the U.S. session, and as a result, aggressively advanced up to highs of 17552 on the day.
Given that price is now trading just below a 4hr Quasimodo resistance level at 17566, would we consider this a suitable number to short from today? Absolutely! Here’s why:
- Converges with a deep 88.6% Fibonacci level at 17575.
- Intersects with a 4hr downtrend line extended from the high 17659.
- Weekly action shows price is currently trading at the underside of the weekly range low 17547 and its converging weekly ascending channel support taken from the low 10402.
The only grumble with regards toshorting this market at 17556 is the fact that price is currently trading from daily demand coming in at 17033-17355. Therefore, we would advise waiting for some sort of lower timeframe selling confirmation before risking capital on the above said idea.
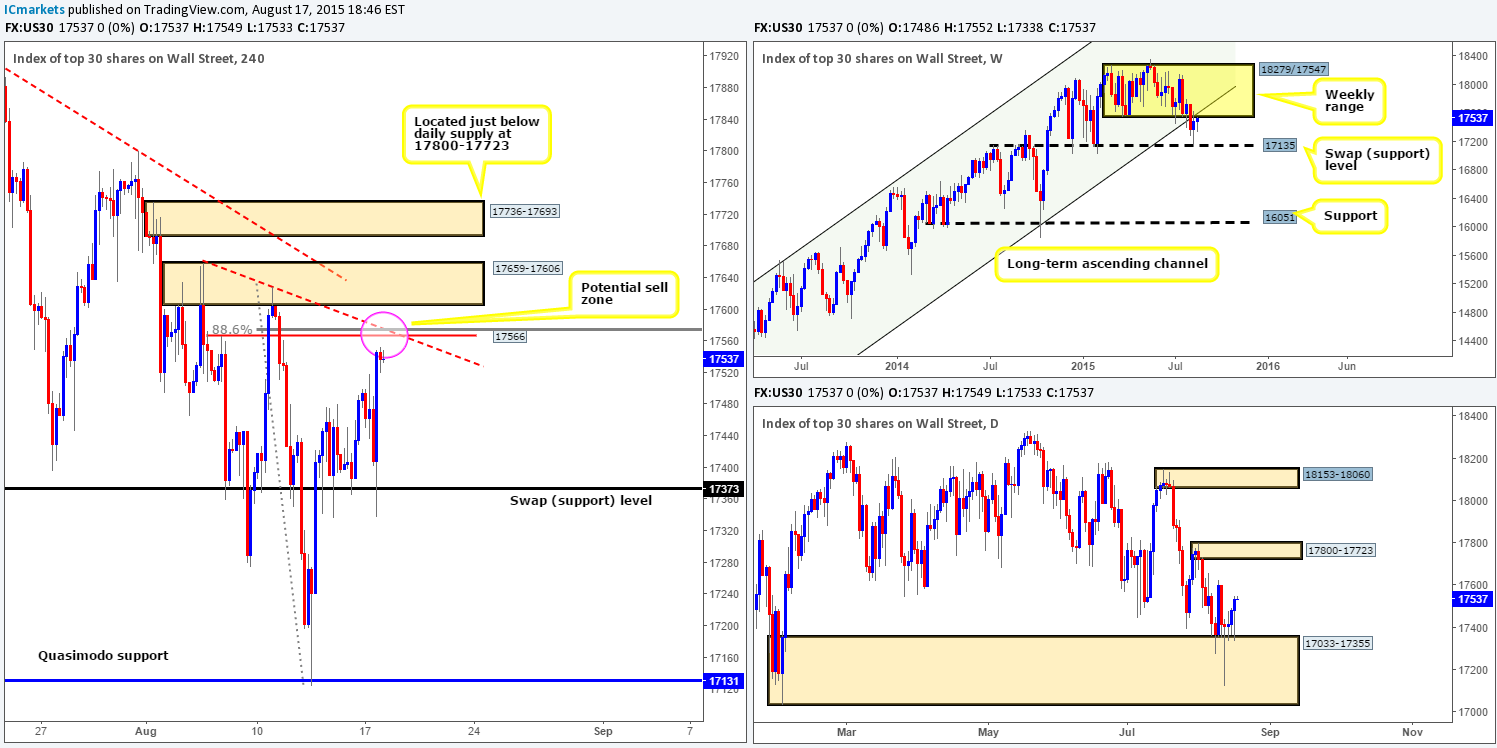
Levels to watch/ live orders:
- Buys: Flat (Stop loss: N/A).
- Sells: 17566 [Tentative – confirmation required] (Stop loss: dependent on where one confirms this level).
XAU/USD: (Gold)
In the thick of yesterday’s sessions, we can see that the 4hr swap (support) level at 1112.7 was well-bid. Price rallied from here and likely took out the majority of offers sitting around Friday’s high 1121.0, potentially clearing the pathway north up to Thursday’s high 1126.6. As we can all see though, Gold is now back on the decline and we feel this will continue today until it reaches 1112.7 again.
With offers at 1121.0 possibly weak now, price will likely either use 1112.7, or fakeout below to connect up with bids sitting around 4hr demand at 1101.7-1109.0 (as per the black arrows) to push prices higher.Assuming the market holds at either of these levels, we’ll likely see a rally to shake hands with 1126.6. This will serve nicely as a fakeout line into our take-profit target zone – a 4hr supply area at 1134.5-1128.9, which is positioned around a key weekly swap (resistance) level coming in at 1130.1. One can only imagine the buy stops positioned above 1126.6 – great liquidity to sell into from this 4hr supply zone wouldn’t you say?!
So to sum up, our team has set an alert at 1113.5, which if triggered; we’ll begin watching for lower timeframe confirmation to enter long. Ultimately, our target for any buys taken from either of the above said 4hr levels will be just below the aforementioned 4hr supply zone at 1127.9. Of course, it is trader dependent on how one approaches these levels. We are still choosing to play on the side of caution here, and intend to wait for lower timeframe buying confirmation before considering a trade, as either 4hr level could potentially see a reaction.
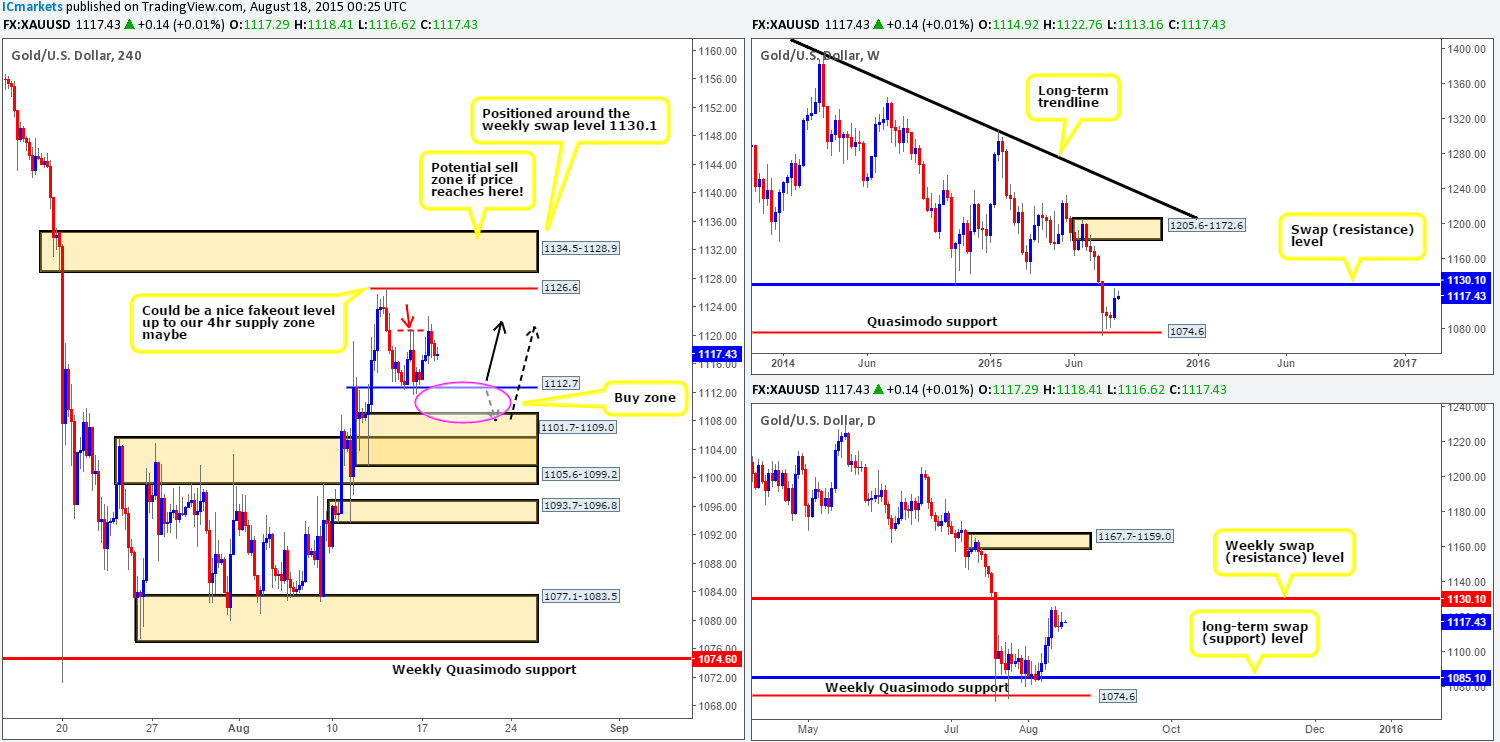
Levels to watch/ live orders:
- Buys: 1112.7 [Tentative – confirmation required] (Stop loss: dependent on where one confirms this level) 1101.7-1109.0 [Tentative – confirmation required] (Stop loss: 1100.8).
- Sells: 1134.5-1128.9 [Tentative – confirmation required] (Stop loss: dependent on where one finds confirmation in this area).


