
EUR/USD:
Over the course of Monday’s segment the US dollar lost ground against all G10 rivals, with the DXY slipping back beneath 89.50 as a result. It appears weekend developments in Syria sparked a selloff in USD-related assets.
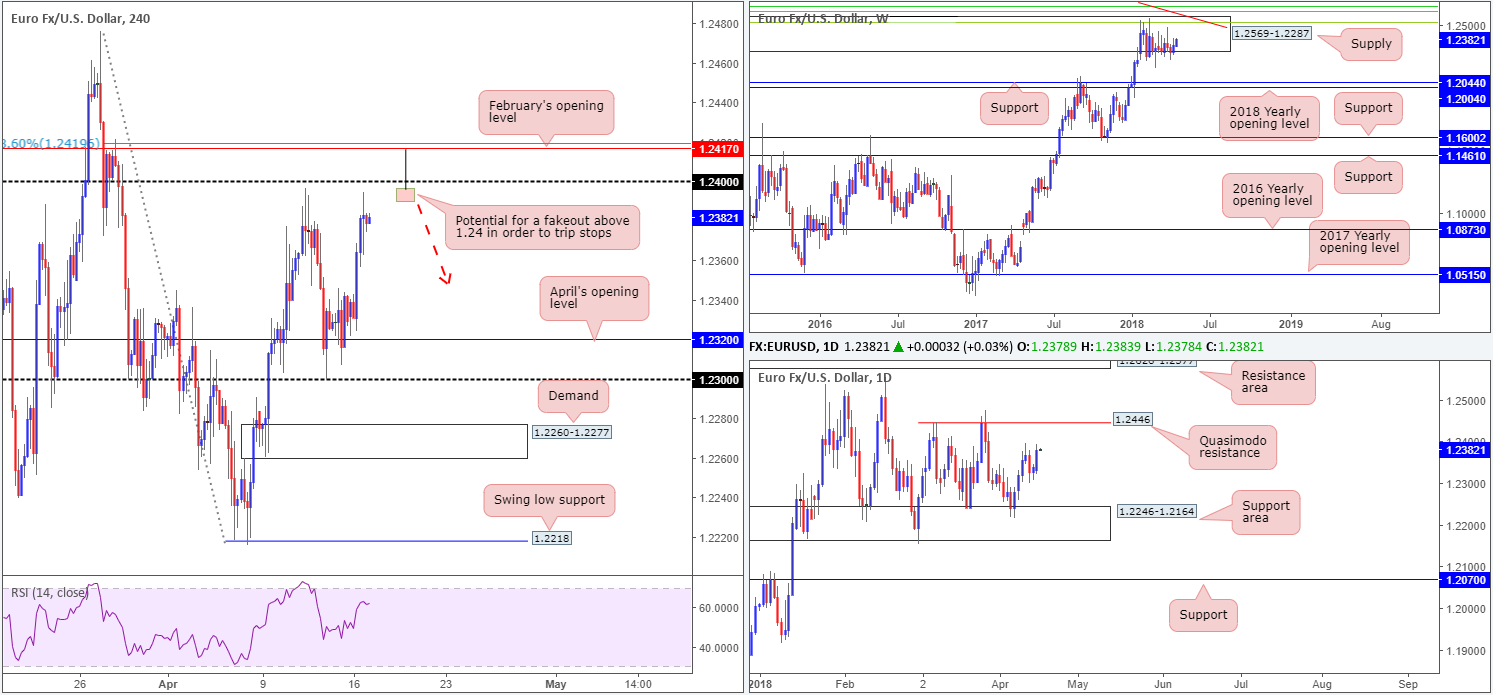
Thanks to yesterday’s advance, the single currency is currently lurking just south of the 1.24 handle on the H4 timeframe, which is shadowed closely by February’s opening level at 1.2417 and a 78.6% H4 Fibonacci resistance at 1.2419. As is shown on the weekly timeframe, the buyers and sellers remain battling for position within the walls of a weekly supply zone seen at 1.2569-1.2287 that has managed to cap upside activity since late January. Navigating price action on the daily timeframe, however, we can see that price remains stationed between a daily Quasimodo resistance at 1.2446 and a rather interesting daily support area at 1.2246-1.2164. This support zone will clearly need to be engulfed before weekly price can pursue lower levels.
Potential trading zones:
Similar to Monday’s outlook, higher-timeframe structure shows that the euro’s uptrend, which began early 2017 (see weekly chart), is currently restrained by the noted weekly supply. As a result, buying this market medium/long term is a challenge. Daily price could, nevertheless, still potentially jolt either way this week targeting noted levels (in bold) mentioned above.
Intraday sellers, on the other hand, are likely honing in on the 1.24 handle today. However, knowing that February’s opening level is positioned directly above it at 1.2417, a fakeout above 1.24 could be on the cards. A H4 bearish pin-bar formation, as drawn on the H4 chart, would therefore be considered a reasonably strong sell signal, with an initial downside target objective set at 1.2350ish.
Data points to consider today: German ZEW economic sentiment; US housing data (building permits and housing starts); US industrial production and capacity utilization rates; FOMC members Williams, Quarles and Bostic also speak.
GBP/USD:
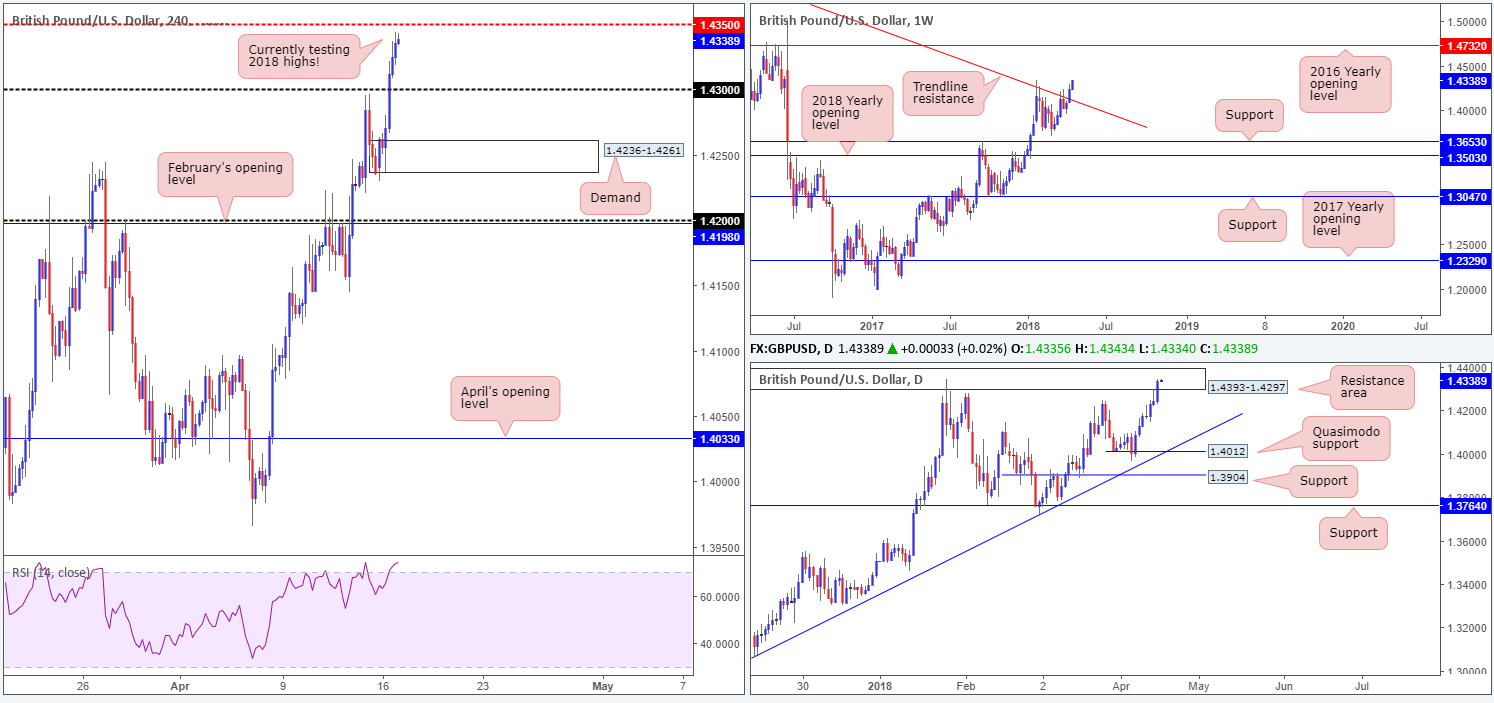
Another wave of buying was seen on Monday, largely influenced by USD selling across the board. Following a decisive H4 close above the 1.43 neighborhood, the pair went on to challenge the 2018 high at 1.4345, plotted just ahead of a H4 mid-level resistance at 1.4350.
According to weekly structure, further buying could be in store. Last week’s firm close above a long-term weekly trend line resistance taken from the high 1.5930 was the first since late 2015! Should the bulls remain defensive, the next upside target can be seen at 1.4732: the 2016 yearly opening level. A closer look at price action on the daily timeframe, nonetheless, highlights a daily resistance area at 1.4393-1.4297. Though, we are yet to see any meaningful bearish intent printed from here after the recently failed daily bearish pin-bar formation.
Potential trading zones:
While further upside is likely as per the weekly timeframe, waiting for the current daily resistance area to be consumed before entering into any medium-term buy positions is recommended. Also, GBP strength may experience resistance this week, in the form of employment data today and inflation figures on Wednesday.
Intraday, traders are likely looking to fade 2018 highs today. Aggressive stop-loss placement above 1.4350 is an option, whereas conservative traders may be looking above the aforementioned daily resistance area. Downside targets from this point can be seen at 1.43, followed then by a H4 demand base coming in at 1.4236-1.4261. Also worth noting is H4 RSI is strongly trading in overbought territory right now!
Data points to consider today: UK job’s data; US housing data (building permits and housing starts); US industrial production and capacity utilization rates; FOMC members Williams, Quarles and Bostic also speak.
AUD/USD:
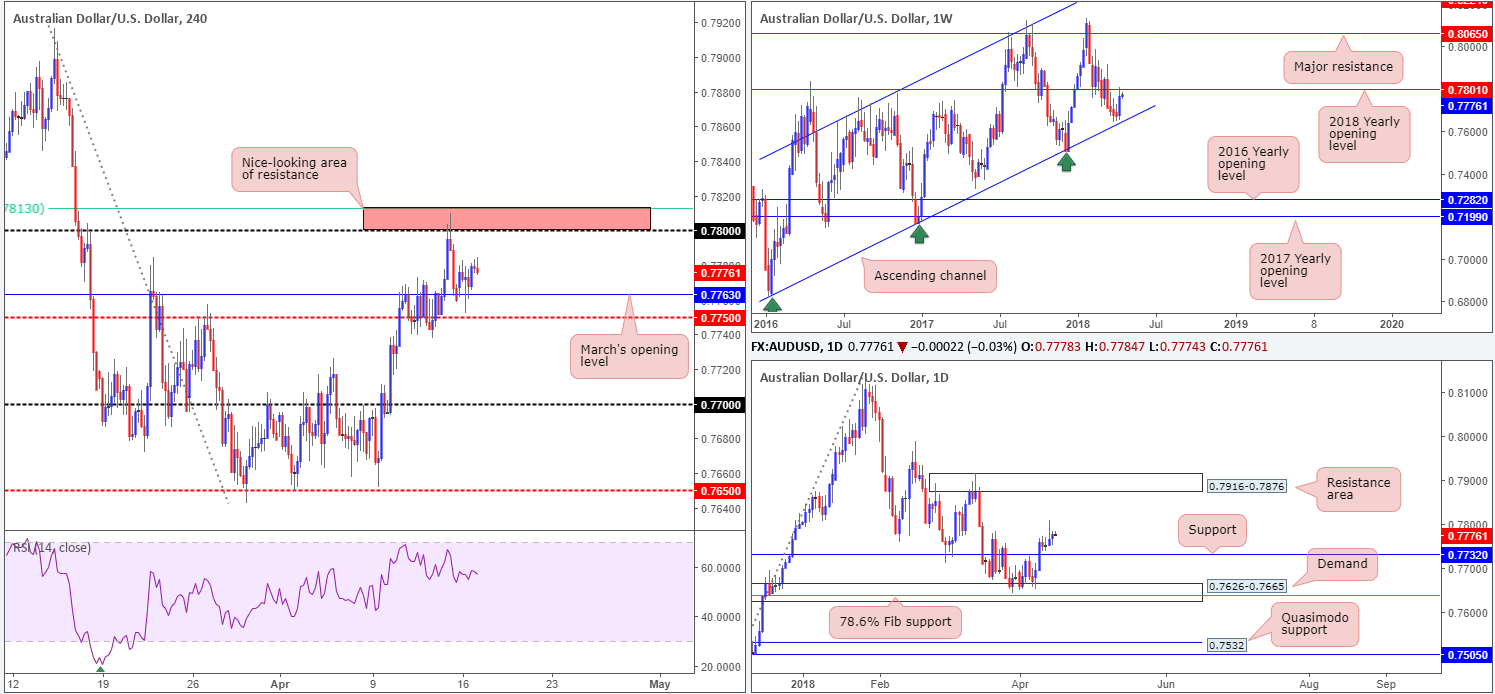
Coming in from the top this morning, weekly price recently shook hands with the 2018 yearly opening level at 0.7801, after recovering just ahead of a long-term weekly channel support taken from the low 0.6827. Although the current level supports a potential downside move, daily action shows room to press higher. Following a break of daily resistance at 0.7732 (now acting support), there’s very little resistance seen overhead until we connect with a daily resistance area marked at 0.7916-0.7876.
Branching across to the H4 candles, we can see that the 0.7813/0.78 (61.8% H4 Fib resistance/round number) region held beautifully amid Friday’s trade, forcing the action back down to March’s opening level at 0.7763. Despite a brief move to lows of 0.7752 on Monday, this level remains in play as support.
Potential trading zones:
The current 2018 yearly opening level seen on the weekly timeframe will likely be a hard number to overcome, without any meaningful fundamental driver. While a firm H4 close beneath the H4 mid-level support at 0.7750 would, in our technical book, be a strong bearish cue, traders ought to exercise caution since 18 pips lower sits the daily support level mentioned above at 0.7732! That does not leave a lot of wiggle room.
On account of the above, and given that we have Australian policy meeting minutes along with a number of Chinese data points just around the corner, opting to remain on the sidelines may be the better path to take for now.
Data points to consider today: Australian policy meeting minutes; Chinese growth data, industrial production, fixed asset investment and NBS press conference; US housing data (building permits and housing starts); US industrial production and capacity utilization rates; FOMC members Williams, Quarles and Bostic also speak.
USD/JPY:
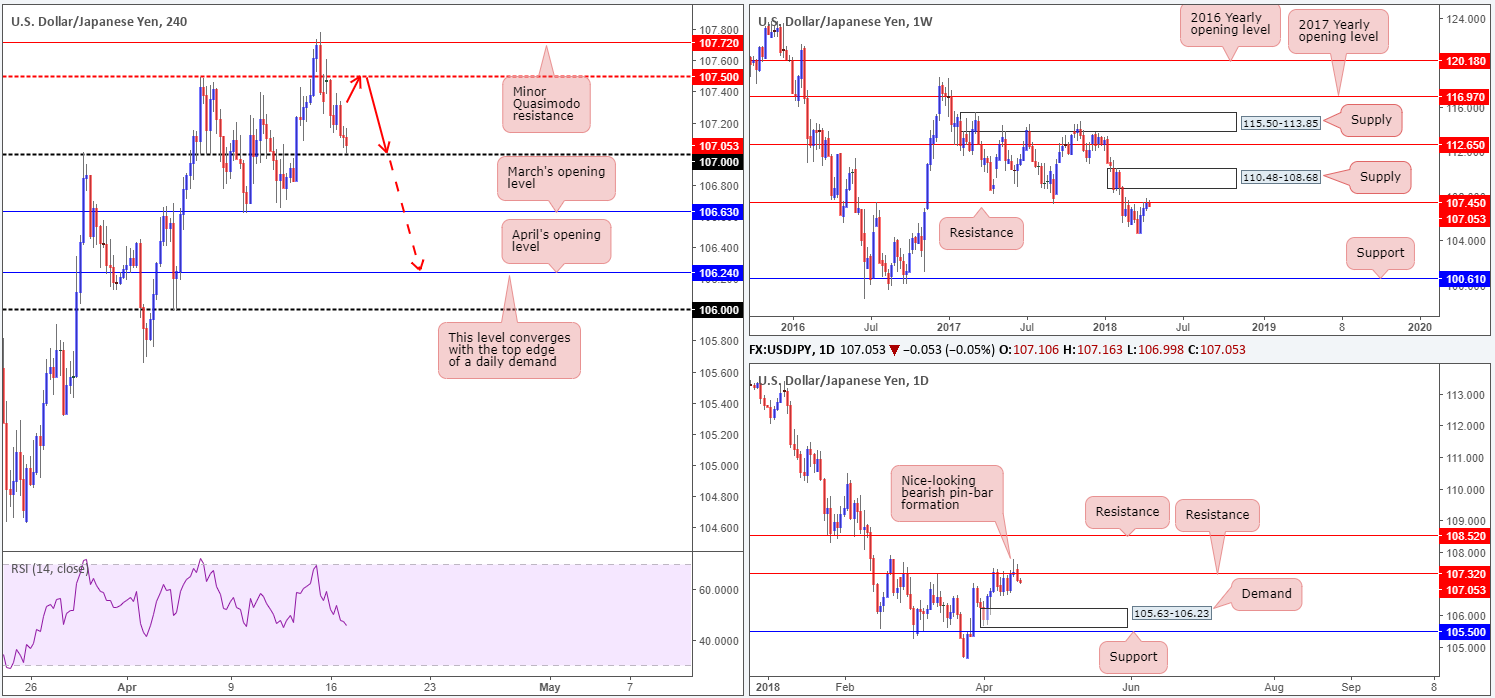
For those who read Monday’s report you may recall the team highlighting a possible retest play at the underside of a H4 mid-level resistance drawn from 107.50. The reason behind our liking of this level largely came down to where the unit was trading on the bigger picture. Weekly price is currently seen interacting with a weekly resistance level plotted at 107.45. This level, as you can see, boasts a reasonably robust history and therefore could eventually force price action lower. What also attracted us to this H4 barrier was the fact that Friday’s daily movement printed a nice-looking daily bearish pin-bar formation that closed marginally above a daily resistance level at 107.32. Continued selling from this point could lead to a test of a daily demand area seen at 105.63-106.23.
Potential trading zones:
The ultimate downside target from 107.50 can be seen at April’s opening level at 106.24 on the H4 timeframe. Why this level? Well, look over to the daily timeframe. The next downside target on this scale is a daily demand based around 105.63-106.23! With that in mind, we’re currently watching for H4 price to take out 107, as this could, if retested as resistance, permit additional shorts today.
Data points to consider today: US housing data (building permits and housing starts); US industrial production and capacity utilization rates; FOMC members Williams, Quarles and Bostic also speak.
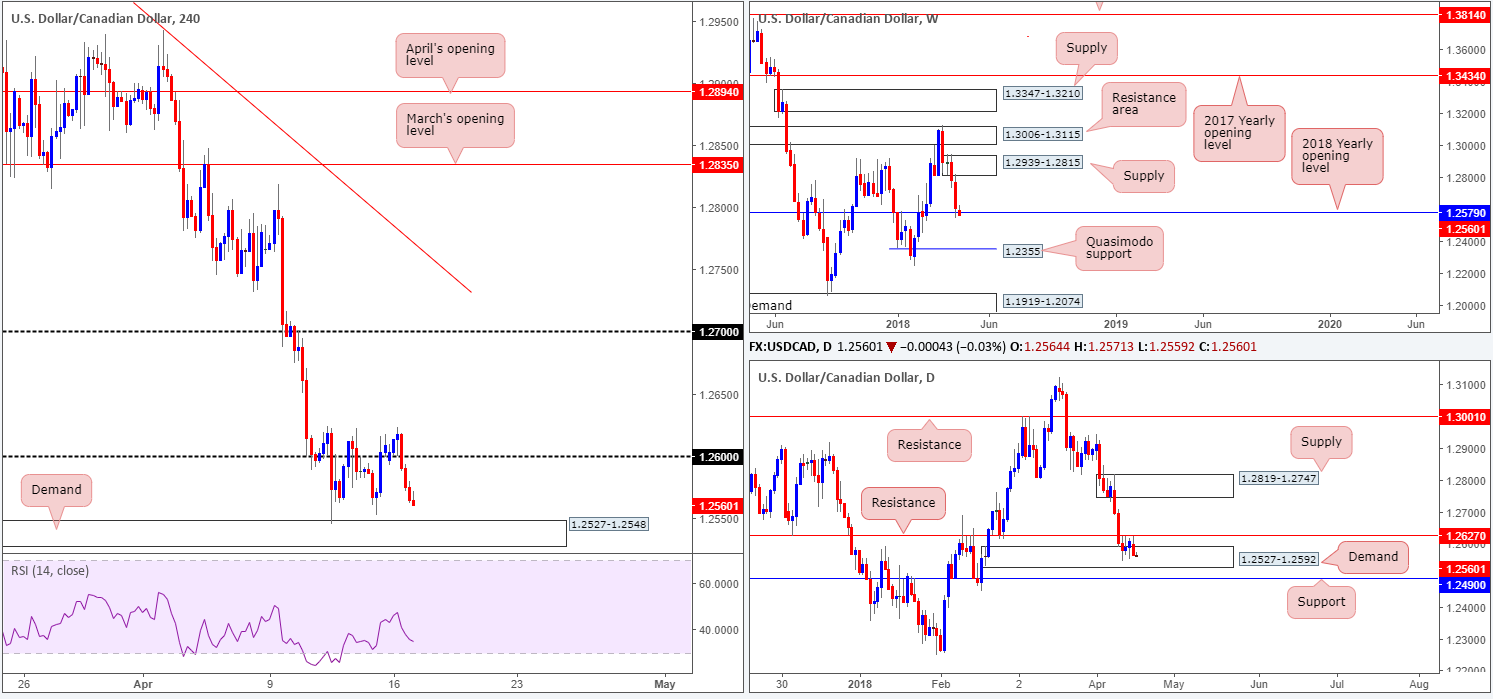
USD/CAD:
Once again, the USD/CAD failed to sustain gains beyond the 1.26 handle, despite a downside turn in crude oil prices. As we headed into US trade on Monday, 1.26 was brutally engulfed (check out the H1 chart), which has likely reignited interest at a H4 demand base drawn from 1.2527-1.2548. Apart from a USD selloff across the board, the daily resistance level at 1.2627 has likely deterred buyers from getting involved. This is quite disappointing for bulls in this market since weekly price recently connected with a rather interesting base of support at 1.2579 (the 2018 yearly opening level), along with daily price seen interacting with a daily demand at 1.2527-1.2592.
Potential trading zones:
Although we still believe weekly price exhibits potential to drive higher, this is a chancy market to buy right now. To confirm upside, a DAILY close beyond the daily resistance level mentioned above at 1.2627 needs to take place. At that point, the next upside target on the H4 timeframe would sit at 1.27, followed then by the underside of a daily supply area at 1.2819-1.2747.
To the downside, however, selling is just as challenging. A break of the current H4 demand will also clear the lower edge of its partner daily demand at 1.2527-1.2592, but immediately open up the path south to daily support pegged at 1.2490! Therefore, until 1.2490 is consumed, downside is also restricted, in our opinion.
Data points to consider today: US housing data (building permits and housing starts); US industrial production and capacity utilization rates; FOMC members Williams, Quarles and Bostic also speak; CAD foreign securities purchases and manufacturing sales m/m.
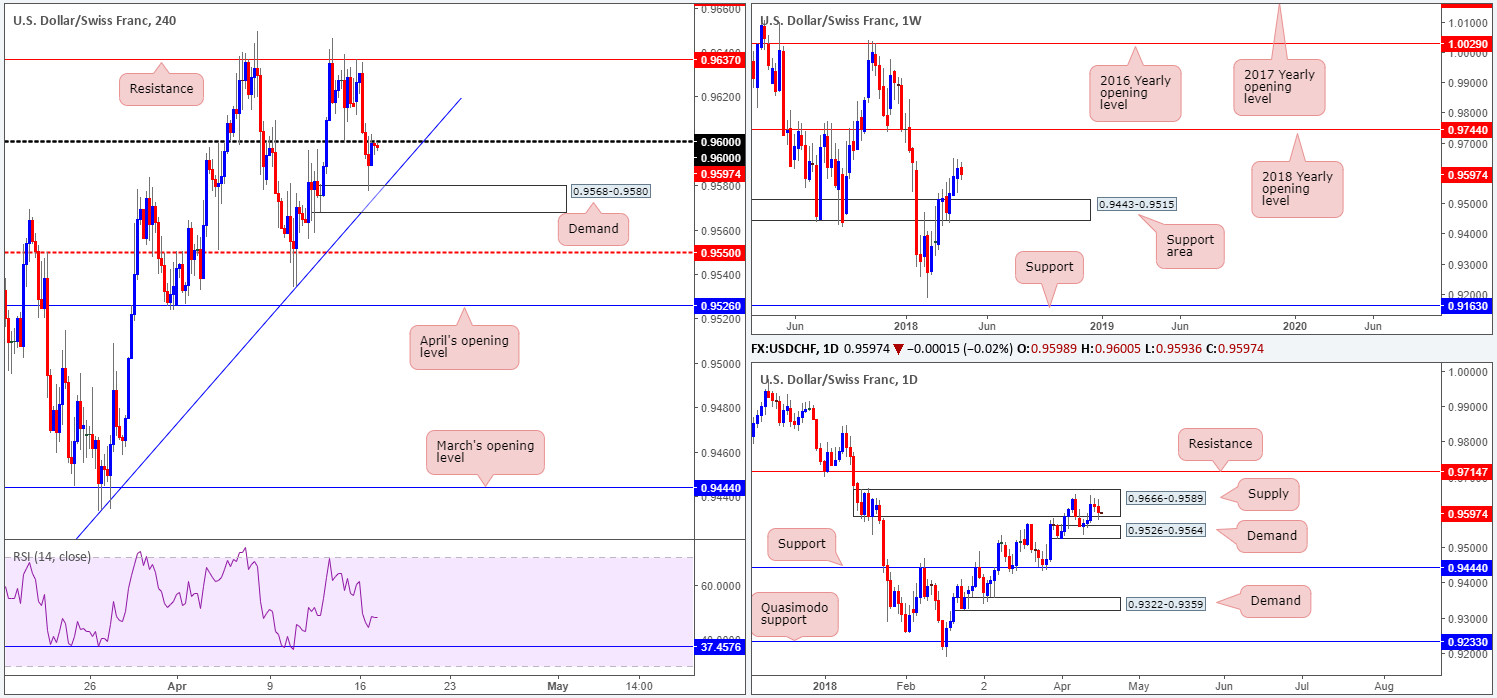
USD/CHF:
Unable to break key H4 resistance plotted at 0.9637, the pair fell sharply lower on Monday. The 0.96 handle was obliterated, which led to a test of nearby H4 demand at 0.9568-0.9580 (intersects with H4 trend line support taken from the low 0.9187) and eventual retest of 0.96 as resistance. A break back above 0.96 could reignite interest at the noted H4 resistance level, whereas a move below the current H4 demand has the H4 mid-level support at 0.9550 to target.
On the other side of the field, weekly price continues to reflect a relatively strong bullish position. According to weekly structure, further buying is entirely possible this week since there’s room for the unit to punch as high as the 2018 yearly opening level at 0.9744. Upside on the daily timeframe, nevertheless, is limited due to a daily supply zone seen at 0.9666-0.9589, followed by a nearby daily resistance level at 0.9714. As is evident from the chart, the daily supply managed to cap upside nicely during the later stages of the prior week, but was somewhat restricted by a nearby daily demand base coming in at 0.9526-0.9564.
Potential trading zones:
Intraday, this market is limited. Irrespective of the direction one selects, you’ll face nearby structure that could potentially hinder a trade and force one into drawdown.
Medium term is not much different, unfortunately. Buying based on weekly positioning places one in a difficult position on the daily timeframe as you’d effectively be entering long into a base of supply! Selling from the current daily supply, on the other hand, would not only place you against potential weekly flow, but also against daily demand mentioned above at 0.9526-0.9564.
Data points to consider today: US housing data (building permits and housing starts); US industrial production and capacity utilization rates; FOMC members Williams, Quarles and Bostic also speak.
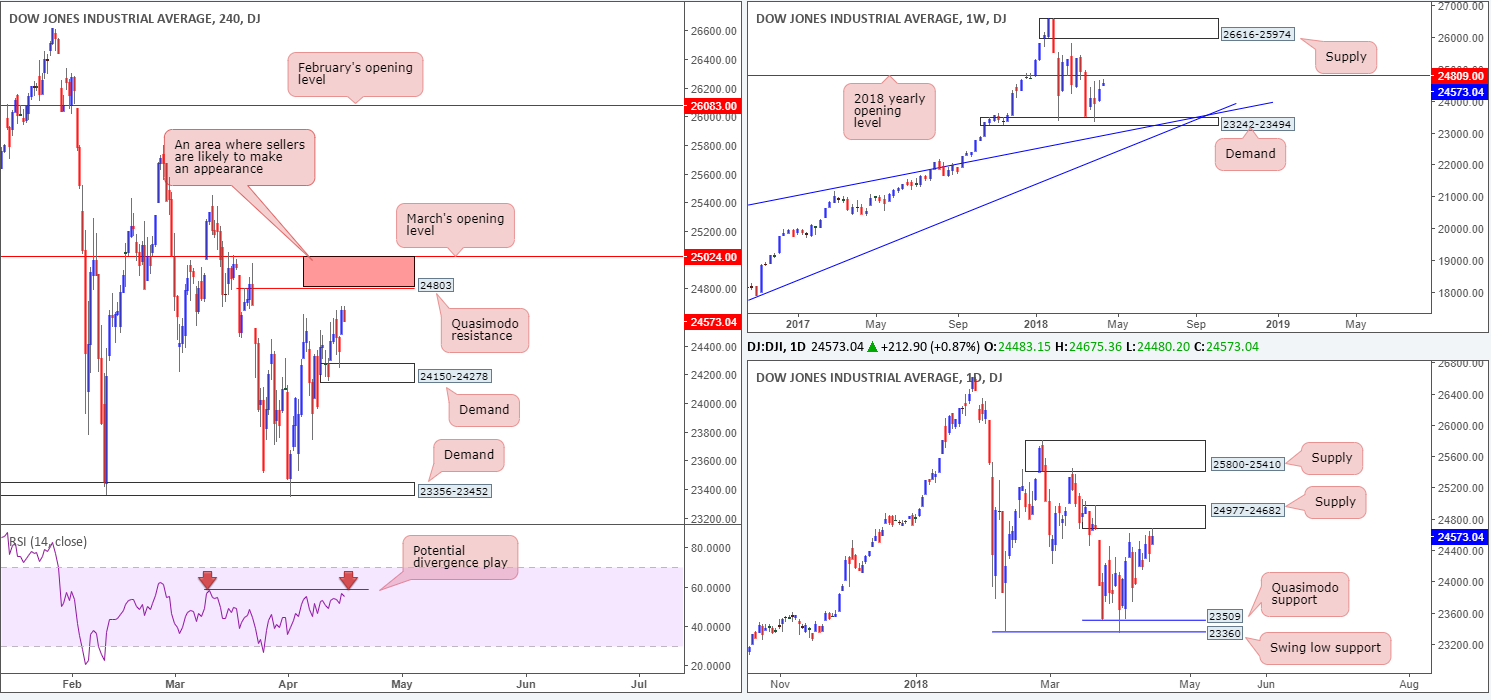
DOW 30:
Despite geopolitical tensions in Syria, US equity indexes wrapped up Monday’s session in positive territory. Corporate earnings are currently the main market driver, with the Bank of America reporting stellar earnings on Monday.
From a technical standpoint, however, we can see H4 demand at 24150-24278 held ground. The DJIA opened the week strongly, gapping north from here and touching highs of 24480. By way of H4 flows, this has placed the 25024/24803 H4 resistance area back in view (marked in red). Comprised of March’s opening level and a H4 Quasimodo resistance, this area is worthy of attention. Not only because of stated H4 levels, but also due to the 2018 yearly opening level at 24809 seen within on the weekly timeframe and also the nearby daily supply zone seen at 24977-24682. In addition to this, the H4 RSI indicator is currently displaying potential divergence.
Potential trading zones:
The area between March’s opening level at 25024 and the H4 Quasimodo resistance at 24803 remains of interest. The initial downside target from this zone fall in at the current H4 demand base logged in at 24150-24278.
Data points to consider today: US housing data (building permits and housing starts); US industrial production and capacity utilization rates; FOMC members Williams, Quarles and Bostic also speak
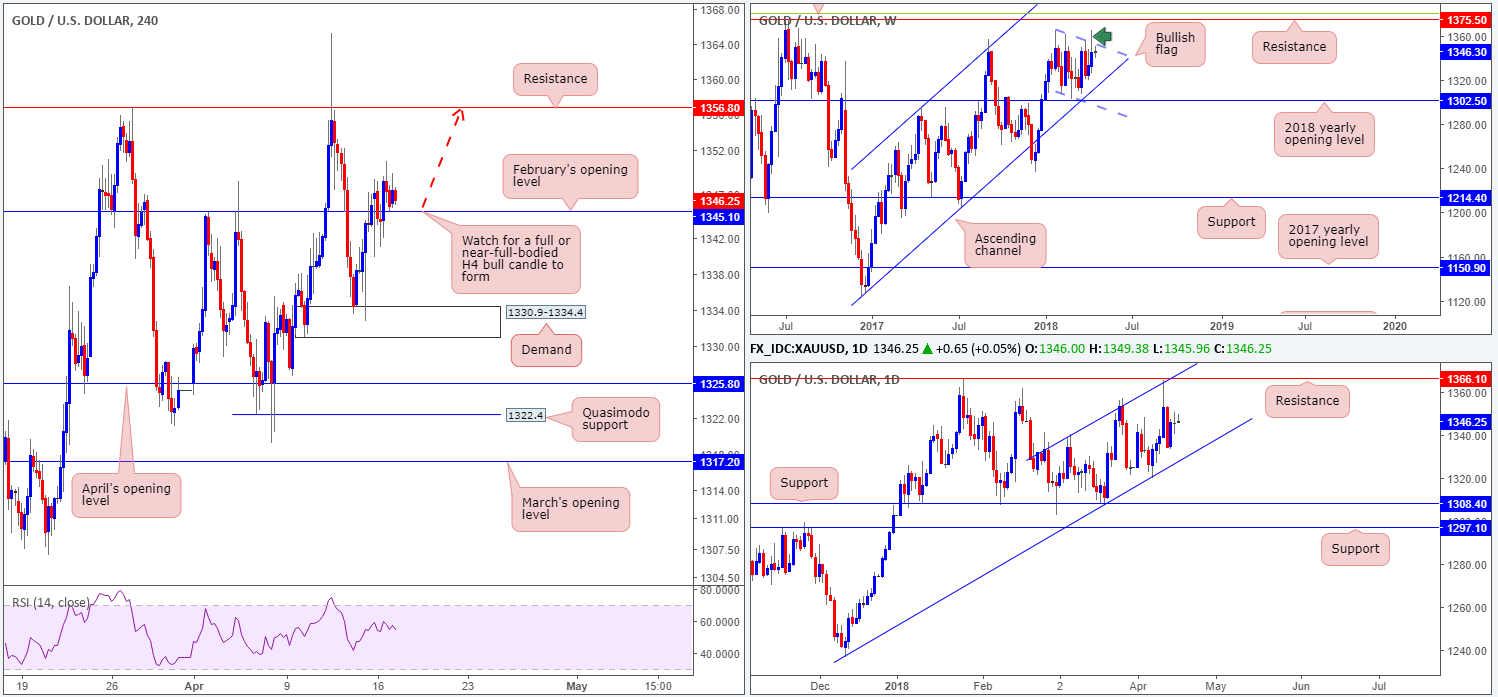
GOLD:
Gold prices are effectively unchanged this morning. H4 movement spent the day oscillating around February’s opening level at 1345.1. With buyers remaining defensive of this line at the moment, though, the team has noted to keep a watchful eye on H4 resistance seen overhead at 1356.8.
While upside appears the favored direction on the H4 scale, let’s move over to the bigger picture to see how the market fares across the board. Weekly price, as highlighted in Monday’s report, continues to compress within a bullish flag formation (1366.0/1307.2), positioned just ahead of the 2018 yearly opening level at 1302.5 (fuses closely with a long-term weekly channel support etched from the low 1122.8). A bullish breakout of this formation has the weekly resistance level at 1375.5 to target. Turning over a page to the daily timeframe, it’s clear to see that the yellow metal has spent over a month compressing within an ascending channel. The channel support is taken from the low 1236.6, while the channel resistance is extended from the high 1340.5. On the whole, though, we see room to advance until we bump heads with daily resistance priced in at 1366.1.
Potential trading zones:
Overall, our bias in this market remains in a northerly direction. The recent breach/fakeout of the weekly bullish flag formation (see green arrow) has likely cleared a truckload of sellers out of the market, possibly paving the way north for a visit of weekly resistance at 1375.5. This – coupled with room seen for daily price to push higher within its ascending channel, along with H4 price also showing room to press higher, we feel further upside is favored.
Keeping it simple, the team has noted to wait for a full or near-full-bodied H4 bull candle to form off of February’s open level before pulling the trigger. This would, in our view, be enough evidence to suggest bullion wants at least the H4 resistance highlighted above at 1356.8.
This site has been designed for informational and educational purposes only and does not constitute an offer to sell nor a solicitation of an offer to buy any products which may be referenced upon the site. The services and information provided through this site are for personal, non-commercial, educational use and display. IC Markets does not provide personal trading advice through this site and does not represent that the products or services discussed are suitable for any trader. Traders are advised not to rely on any information contained in the site in the process of making a fully informed decision.
This site may include market analysis. All ideas, opinions, and/or forecasts, expressed or implied herein, information, charts or examples contained in the lessons, are for informational and educational purposes only and should not be construed as a recommendation to invest, trade, and/or speculate in the markets. Any trades, and/or speculations made in light of the ideas, opinions, and/or forecasts, expressed or implied herein, are committed at your own risk, financial or otherwise.
The use of the site is agreement that the site is for informational and educational purposes only and does not constitute advice in any form in the furtherance of any trade or trading decisions.
The accuracy, completeness and timeliness of the information contained on this site cannot be guaranteed. IC Markets does not warranty, guarantee or make any representations, or assume any liability with regard to financial results based on the use of the information in the site.
News, views, opinions, recommendations and other information obtained from sources outside of www.icmarkets.com.au, used in this site are believed to be reliable, but we cannot guarantee their accuracy or completeness. All such information is subject to change at any time without notice. IC Markets assumes no responsibility for the content of any linked site. The fact that such links may exist does not indicate approval or endorsement of any material contained on any linked site.
IC Markets is not liable for any harm caused by the transmission, through accessing the services or information on this site, of a computer virus, or other computer code or programming device that might be used to access, delete, damage, disable, disrupt or otherwise impede in any manner, the operation of the site or of any user’s software, hardware, data or property.


