
EUR/USD:
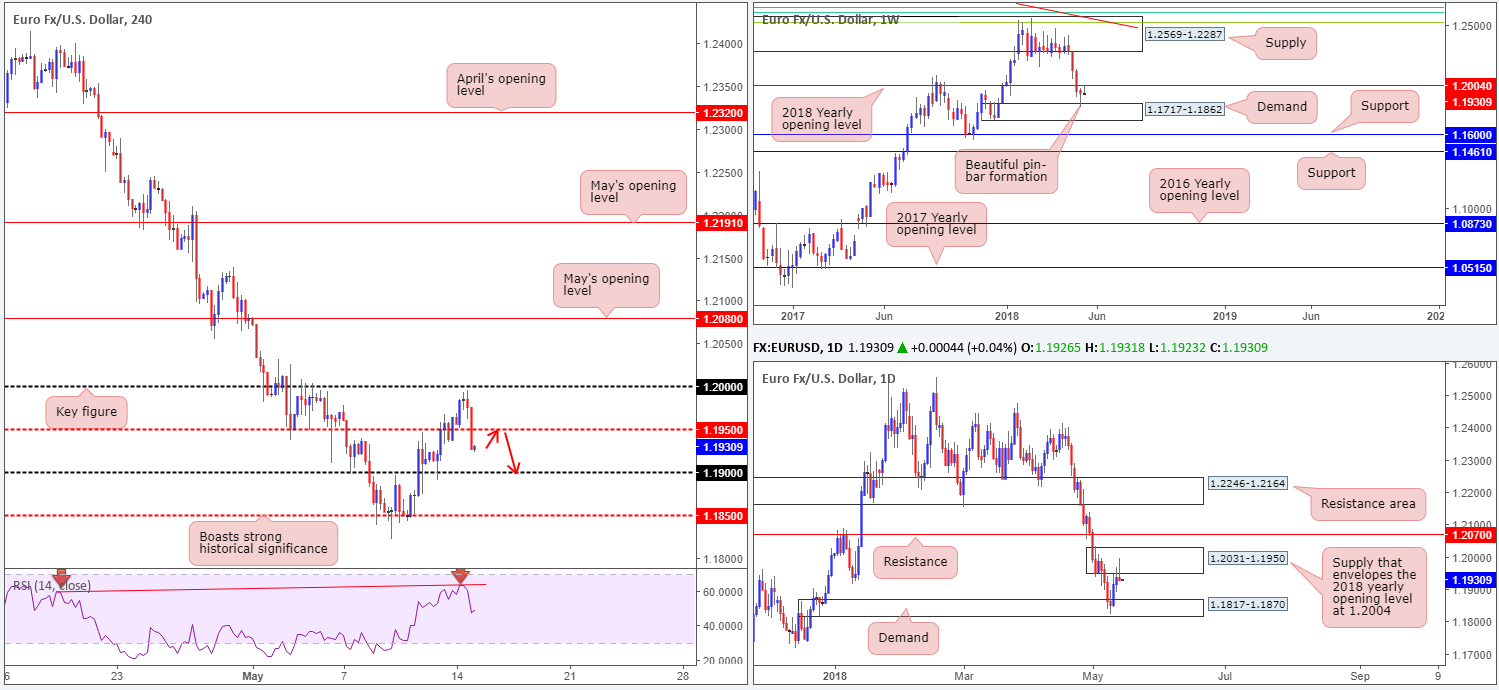
The euro, as you can see, began Monday’s session on a relatively strong footing, breaking above the H4 mid-level resistance 1.1950. Further buying came about as we headed into Europe on the back of some upbeat/hawkish ECB commentary (Villeroy initially and then Lautenschlaeger), though the pair fell victim to USD strength four pips south of the key figure 1.20. As is evident from the H4 timeframe, price continued to pullback amid US trade and concluded the day reclaiming 1.1950 in the shape of a full-bodied H4 bearish candle.
The story on the daily timeframe shows that price chalked up a nice-looking bearish pin-bar formation yesterday from within the walls of a daily supply area at 1.2031-1.1950! Note that this zone also envelopes the 2018 yearly opening level at 1.2004 seen on the weekly timeframe.
Potential trading zones:
1.20 was a noted level to watch for shorts in Monday’s weekly report, given its surrounding confluence on the higher timeframes (daily supply, 2018 yearly opening level on the weekly timeframe and the overall trend direction at present). Well done to any of our readers who still managed to catch this train!
Going forward, the team anticipates further downside to materialize. The next port of call on the H4 scale is seen at the 1.19 handle. In addition to this, the weekly chart shows room to press as far south as the weekly demand based at 1.1717-1.1862, while daily action has demand at 1.1817-1.1870 to target (glued to the top edge of the noted weekly demand). Therefore, intraday shorts could be an option on any retest seen at the underside of 1.1950 today, targeting 1.19, followed closely by 1.1870.
Data points to consider today: German prelim GDP q/q; Euro flash GDP q/q; German ZEW economic sentiment; US core retail sales m/m; Empire state manufacturing index; FOMC member Williams speaks.
GBP/USD:
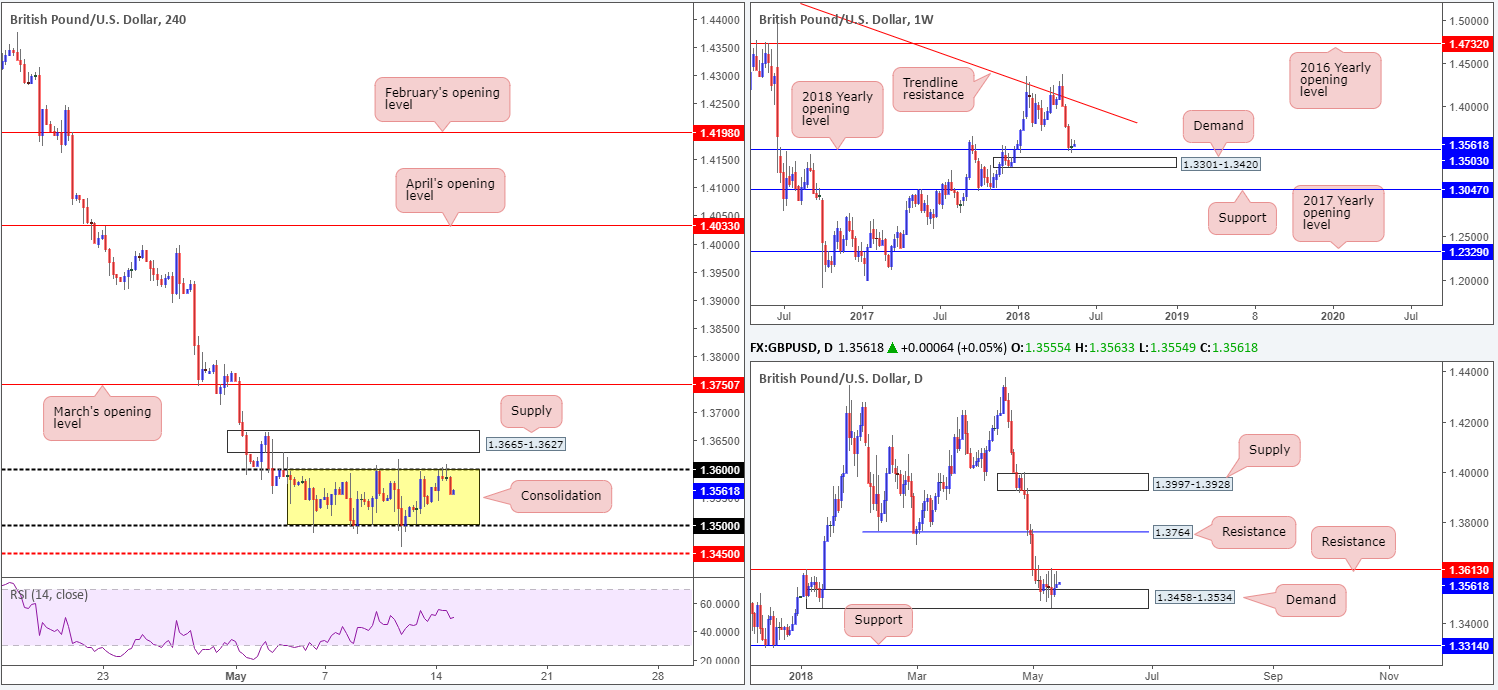
As can be seen on the H4 timeframe, the GBP/USD continues to demonstrate a clear consolidative process between 1.36/1.35 (yellow area). Directly above the zone, we can see H4 supply at 1.3665-1.3627, whereas below there’s the H4 mid-level support at 1.3450 in view. What’s also interesting from a technical perspective is that the current H4 range is surrounded by daily structure: daily demand at 1.3458-1.3534 and daily resistance coming in at 1.3613. On the weekly timeframe, however, the 2018 yearly opening level seen at 1.3583, as you can see, has so far held ground. Both this level and the weekly demand zone seen directly below it at 1.3301-1.3420 communicate strength.
Potential trading zones:
This is a tricky market right now. On the one hand, further buying could materialize off the 2018 yearly opening barrier at 1.3503, which not only represents the lower edge of the current H4 range, it is also placed within daily demand at 1.3458-1.3534. On the other hand, however, we have the daily candles bringing out weakness off the current daily resistance level (see the clear daily selling wicks), and a clear downtrend present that could be too much for the buyers to take on!
Despite current structure, this could still be an opportunity for range traders to take advantage of the noted H4 consolidation (1.36/1.35). We would strongly advise placing stop-loss orders beyond the surrounding daily zones, though, as this will help avoid any nasty surprises in the form of a fakeout which are all too common around psychological numbers!
Traders are reminded that the UK releases its job’s data amid early London hours today, so technicals may take a back seat during this time.
Data points to consider today: UK job’s figures; US core retail sales m/m; Empire state manufacturing index; FOMC member Williams speaks.
AUD/USD:
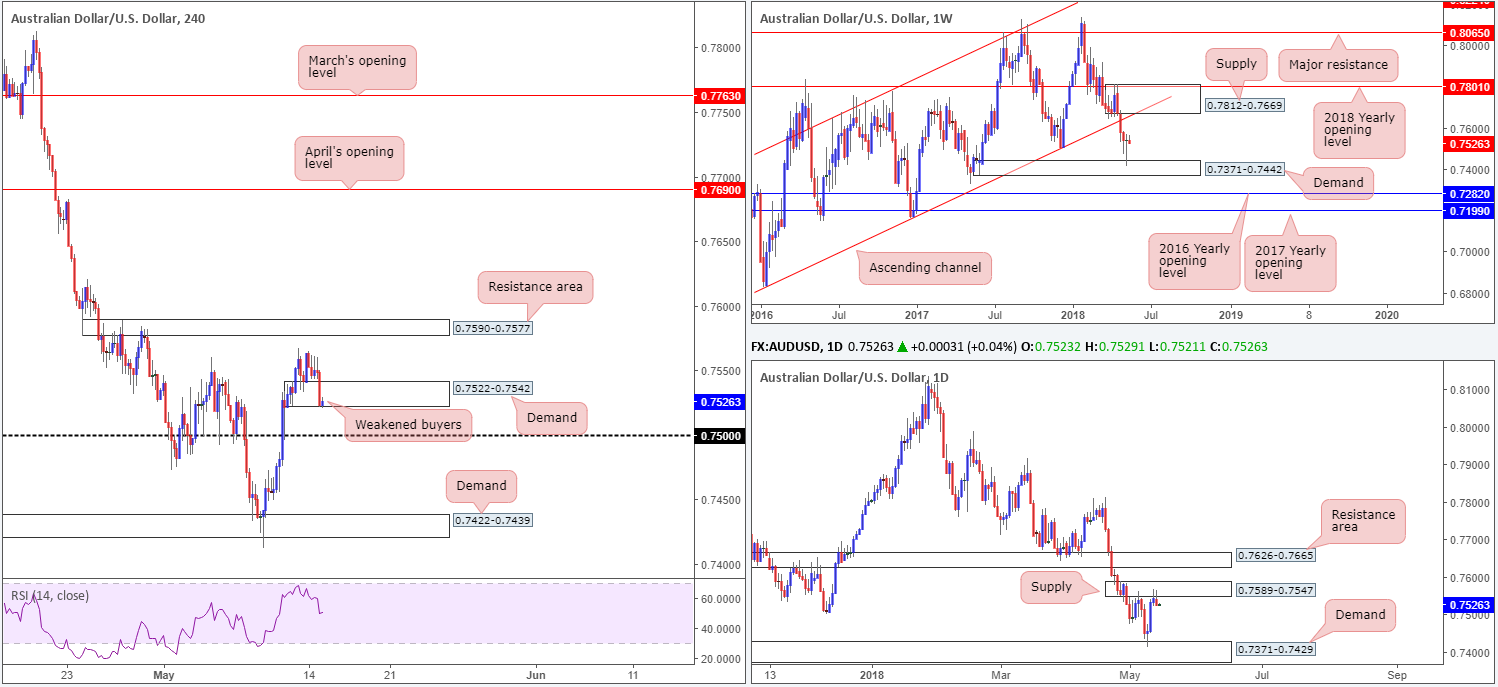
During the course of yesterday’s sessions, the commodity currency was reasonably stagnant for the majority of the day, hovering between 0.7556/0.7545. It wasn’t until the US afternoon segment kicked in did we see Aussie bears regain consciousness and drive price deep into H4 demand at 0.7522-0.7542. The move lower was bolstered by a robust USD and daily supply seen on the AUD/USD at 0.7589-0.7547.
This move has likely alarmed prospective buyers from the noted H4 demand and potentially set the stage for a continuation move lower to shake hands with the 0.75 handle. At the same time, though, one has to remain cognizant of what the weekly timeframe is telling us. Following a three-week slide, weekly price penciled in a strong-looking weekly bullish pin-bar formation last week off the top edge of weekly demand at 0.7371-0.7442. Assuming that the buyers remain authoritative, further buying could materialize and ultimately connect price with weekly supply at 0.7812-0.7669 that intersects with a weekly channel resistance (taken from the low 0.6827).
Potential trading zones:
According to the technicals at this time, the pendulum appears to be swinging toward more of a bearish approach: weak H4 demand and strong daily supply. Unfortunately, though, unless you’re able to pin down a setup on the break of the current H4 demand that allows enough room for reasonable risk/reward to 0.75, you’ll have to wait for a H4 close beneath 0.75 (and preferably a retest) before looking for shorting opportunities.
Sub 0.75 has room to press as far south as the top edge of the weekly demand area mentioned above at 0.7371-0.7442, which essentially represents the H4 demand base seen at 0.7422-0.7439.
Data points to consider today: AU. Monetary policy meeting minutes; RBA Assist Gov. Debelle speaks; Chinese fixed investment ytd/y; Chinese industrial production y/y: US core retail sales m/m; Empire state manufacturing index; FOMC member Williams speaks.
USD/JPY:
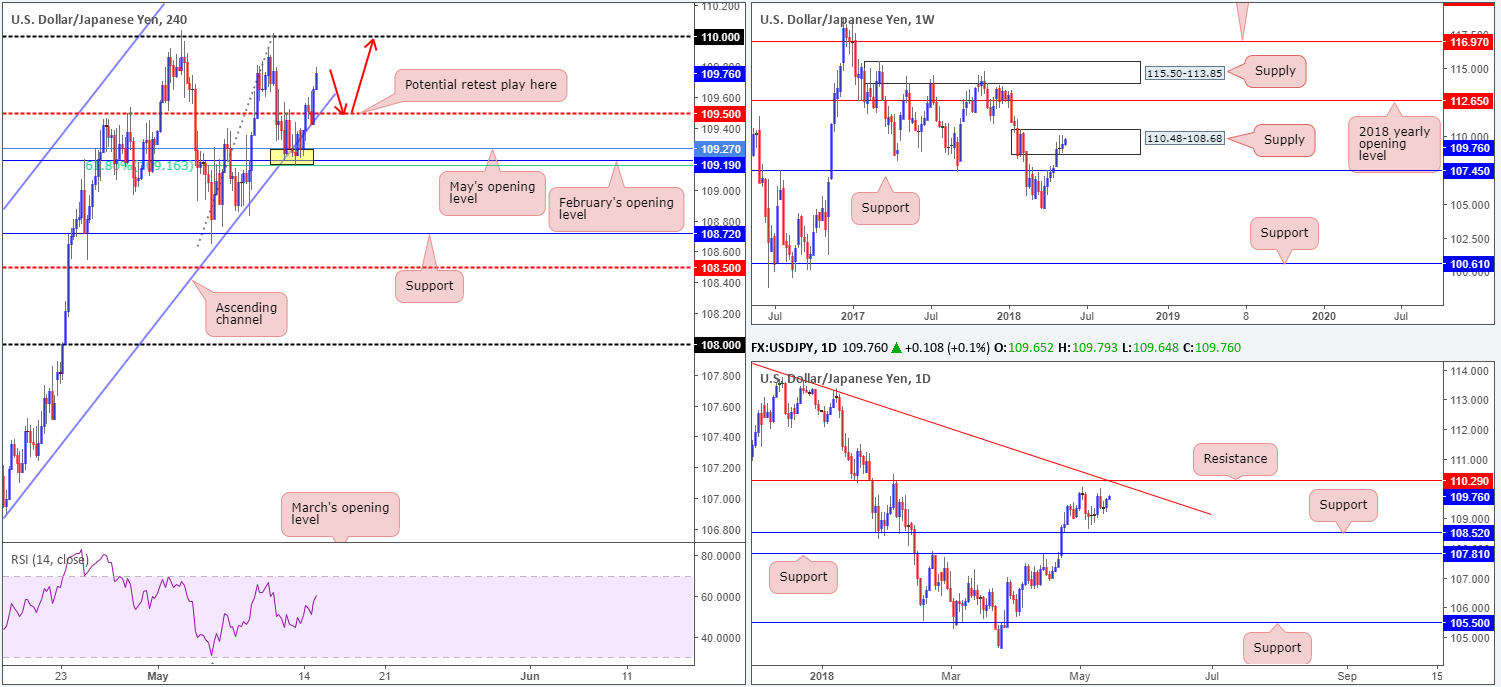
The US dollar outperformed against its Japanese counterpart on Monday from 109.16/109.27 (yellow zone) seen on the H4 timeframe. You may recall the team highlighting this area as a potential buy zone. Here’s why:
- 109.19/109.27: February and May’s opening levels.
- H4 channel support extended from the low 104.62.
- 61.8% H4 Fib support value at 109.16.
Well done to any of our readers who took advantage of this move. As you can see, H4 price recently conquered a nearby H4 mid-level resistance at 109.50 and pushed to a high of 109.74. Having seen the USD strength above 109.50, the 110 handle is likely the next resistance on the hit list.
While daily movement also shows room to possibly continue climbing north until reaching daily resistance at 110.29, which happens to converge beautifully with a daily trend line resistance taken from the high 114.73, weekly price remains within the confines of a weekly supply zone at 110.48-108.68.
Potential trading zones:
Should you engage in buying this market, you are, despite room being seen on the daily and H4 structures to appreciate, effectively buying against potential weekly flow from supply. To be on the safe side, traders may want to consider waiting and seeing if H4 price can retest 109.50 as support and print a H4 full or near-full-bodied bull candle. This, in our view, would be enough evidence to justify a long, targeting the noted upside objectives (110/110.29).
Data points to consider today: US core retail sales m/m; Empire state manufacturing index; FOMC member Williams speaks.
USD/CAD:
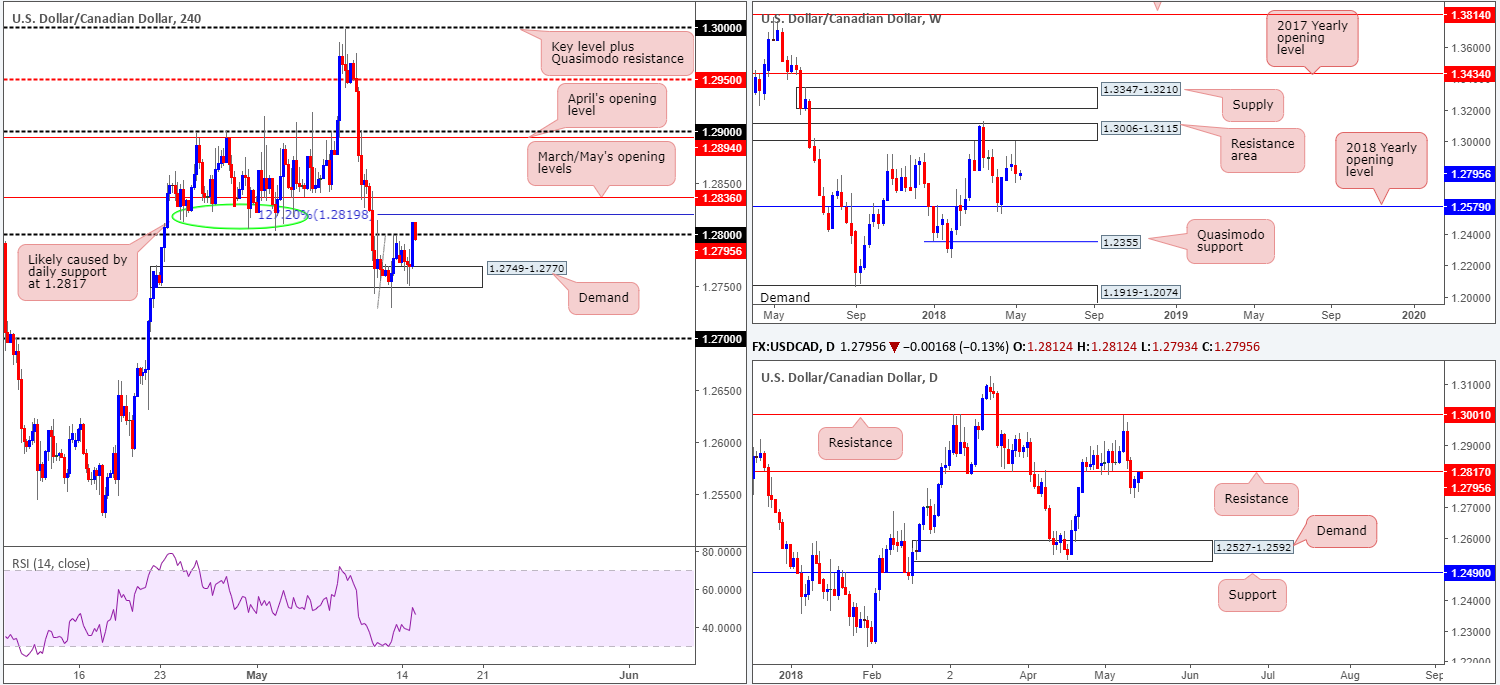
In recent trade, the USD/CAD managed to end the day in positive territory, closing 12 pips above the 1.28 handle on the H4 timeframe. In spite of this, it is not all sunshine and roses for the bulls from here on! Directly overhead on this scale we see a 127.2% H4 Fib ext. point at 1.2819, shadowed closely by March/May’s opening levels at 1.2836.
On the bigger picture, weekly price continues to reflect a bearish position. Apart from a mild end-of-week correction last week, continued selling from this point is certainly plausible due to the fact that the weekly timeframe shows limited supportive structure in view until reaching the 2018 yearly opening level at 1.2579. In conjunction with weekly flow, daily price is seen trading within striking distance of a resistance level priced in at 1.2817.
Potential trading zones:
With buyers likely heavily weakened around the current H4 demand (thanks to a push to lows of 1.2728 on Friday), along with both weekly and daily structure suggesting further downside may be in store, a close back beneath 1.28 (preferably near its lows) could be a strong cue to sell. The next downside target from this point can be seen at 1.27 as the initial take-profit zone. Stop-loss orders are best placed above March/May’s opening levels at 1.2836. This will allow the trade room to breathe.
Data points to consider today: US core retail sales m/m; Empire state manufacturing index; FOMC member Williams speaks.
USD/CHF:
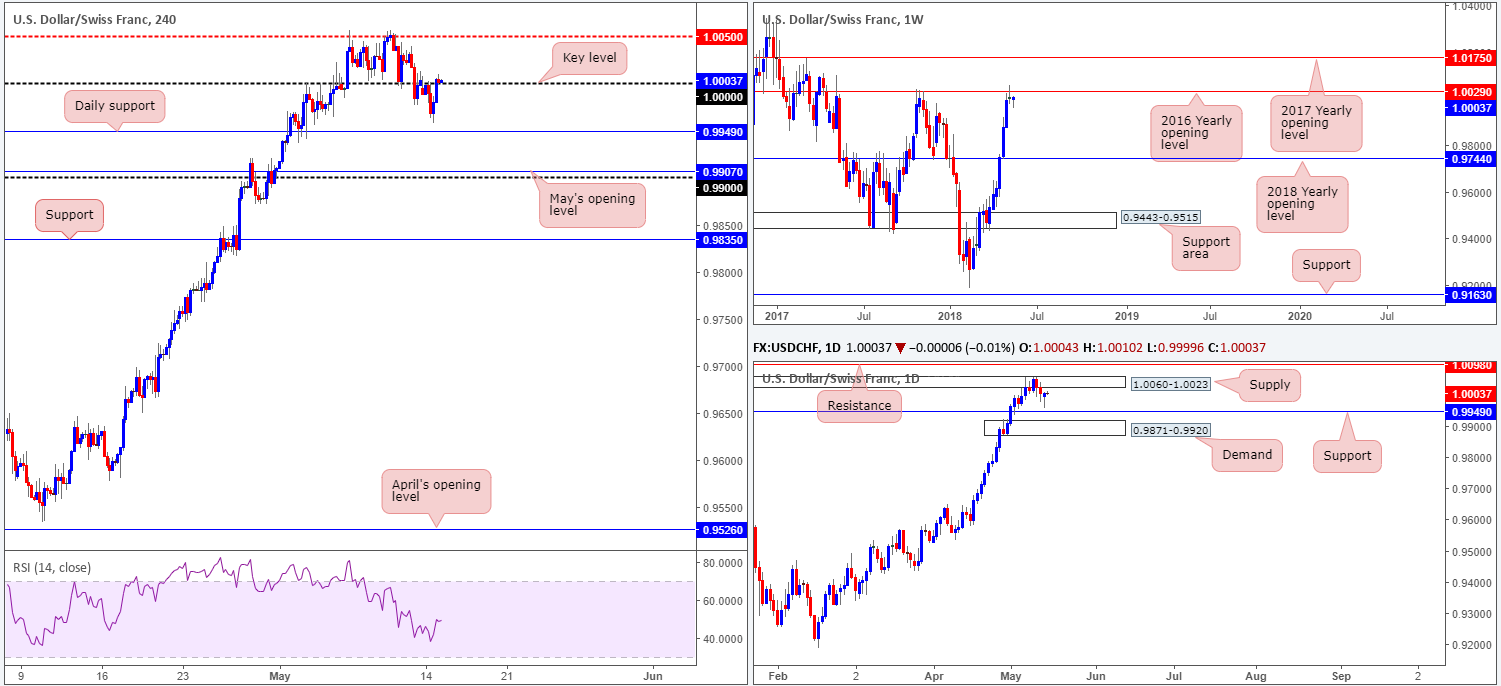
In early hours of trade on Monday, the USD/CHF held the lower edge of parity (1.0000) beautifully and eventually pushed south amid London morning trade. On hitting lows of 0.9957 (just ahead of daily support plotted at 0.9949) going into the US open, the pair recovered in strong fashion and ended the day closing a few pips above 1.0000.
While a H4 close above 1.0000 is considered bullish, the bigger picture’s canvas is unfortunately not as promising. Apart from the clear northerly trend present in this market and a daily bullish pin-bar formation printed yesterday, we have upside barriers seen in the shape of a daily supply zone printed at 1.0060-1.0023, and a 2016 yearly opening level resistance at 1.0029 seen on the weekly timeframe.
Potential trading zones:
Knowing weekly and daily structure display potentially troublesome resistance ahead, entering long on the basis of H4 price crossing above 1.0000 is not really a trade we would label high probability. With that being the case, the team has noted to keep an eye out for another H4 close beneath 1.0000. Should this be followed up with a retest as resistance it’d likely be enough to validate intraday shorting opportunities, targeting daily support mentioned above at 1.0049 as an initial take-profit zone.
Data points to consider today: US core retail sales m/m; Empire state manufacturing index; FOMC member Williams speaks; CHF PPI m/m.
Dow Jones Industrial Average:
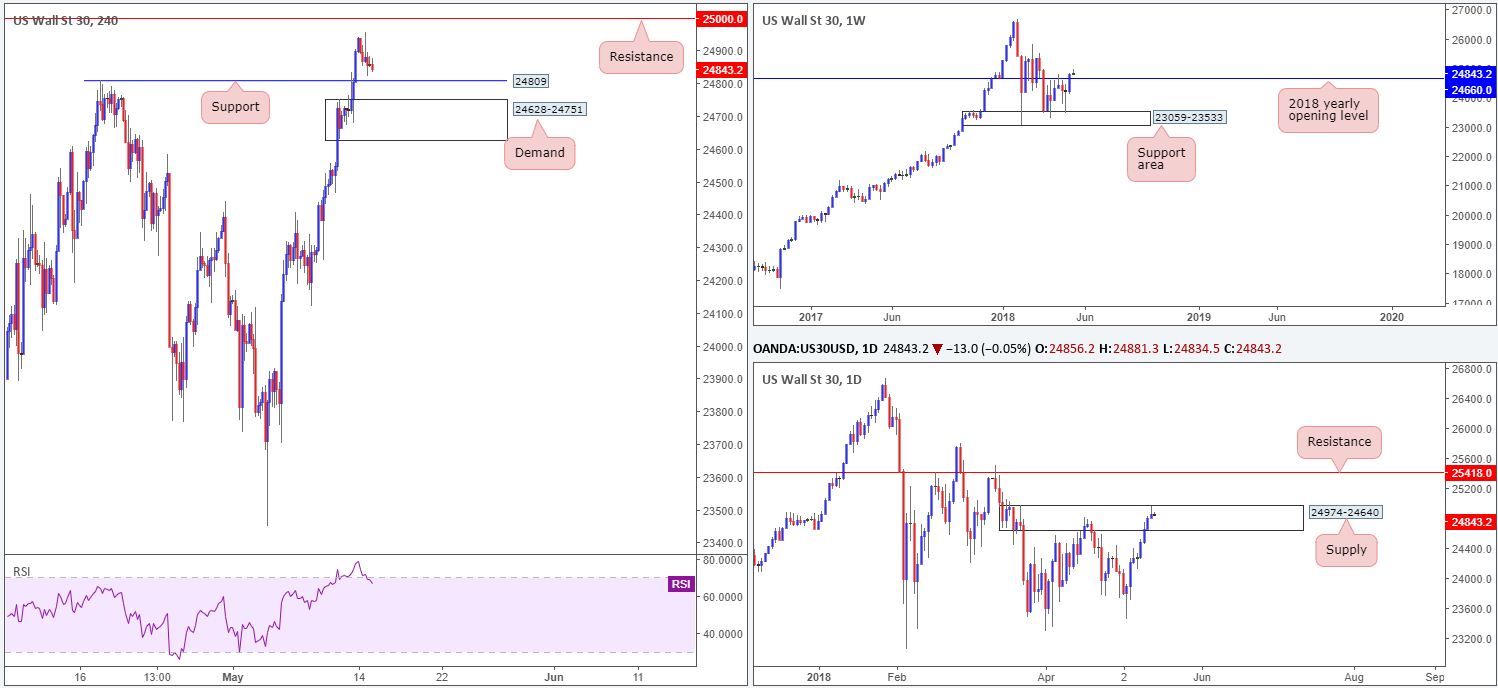
Registering its eighth consecutive daily gain on Monday, the DJIA managed to clock a fresh high of 24957. Driving the markets higher, as far as we can see, are hopes that trade tensions between China and the US might ease.
Looking at this market from a technical standpoint, nevertheless, we can see that H4 price is currently sandwiched between support (taken from the high 24809 [17/04]) and a strong resistance planted at 25000. A violation of the current support will likely see H4 demand at 24628-24751 brought into view.
The story on the bigger picture shows weekly price recently breached the 2018 yearly opening level at 24660, while daily movement remains trading within the walls of supply coming in at 24974-24640. A violation of this area shines the spotlight on daily resistance at 25418.
Potential trading zones:
The H4 demand mentioned above at 24628-24751 is interesting since this area is formed on top of the 2018 yearly opening level highlighted above. The only grumble in taking a long position from this area, though, is, of course, the fact that we are trading within daily supply. Therefore, in order to get around this, we would strongly recommend waiting and seeing if H4 price can print a full or near-full-bodied bull candle from the demand. Should it close back above 24809, all the better! This, in our opinion, would be a strong indication that daily sellers are fading and the bulls are gaining strength. Therefore a long, in this instance, would be favorable, targeting H4 resistance mentioned above at 25000 as the initial take-profit target.
Data points to consider today: US core retail sales m/m; Empire state manufacturing index; FOMC member Williams speaks.
GOLD:
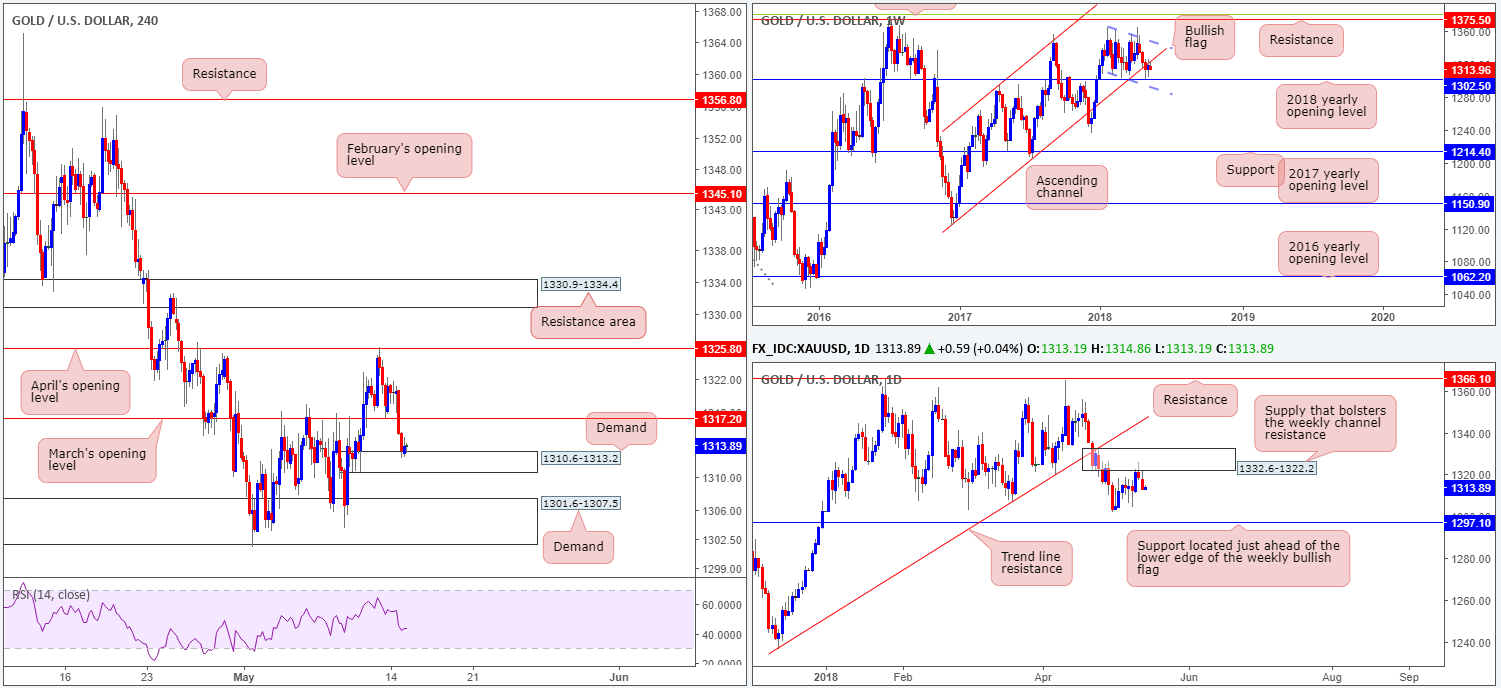
As noted in Monday’s weekly report, we felt there was little evidence to suggest a long from March’s opening level at 1317.2 on the H4 timeframe. The reasons behind this were simply due to a daily supply zone seen in play at 1326.4-1316.7, which happens to bolster a weekly channel resistance taken from the low 1122.8.
As you can see, in this instance we were correct in our approach and H4 price is now seen touching gloves with demand at 1310.6-1313.2.
The closest support structure on the higher timeframes right now falls in around the 2018 yearly opening level seen on the weekly timeframe at 1302.5, which is positioned beautifully ahead of daily support at 1297.1.
Potential trading zones:
Although further downside is likely, according to the higher timeframes, H4 price is somewhat cramped. Entering short into the current H4 demand is not something we would recommend! Nor would we advise looking for shorts beneath this area due to H4 demand sited directly below it at 1301.6-1307.5.
As is evident from the current structure neither a long nor short is attractive at the moment.
This site has been designed for informational and educational purposes only and does not constitute an offer to sell nor a solicitation of an offer to buy any products which may be referenced upon the site. The services and information provided through this site are for personal, non-commercial, educational use and display. IC Markets does not provide personal trading advice through this site and does not represent that the products or services discussed are suitable for any trader. Traders are advised not to rely on any information contained in the site in the process of making a fully informed decision.
This site may include market analysis. All ideas, opinions, and/or forecasts, expressed or implied herein, information, charts or examples contained in the lessons, are for informational and educational purposes only and should not be construed as a recommendation to invest, trade, and/or speculate in the markets. Any trades, and/or speculations made in light of the ideas, opinions, and/or forecasts, expressed or implied herein, are committed at your own risk, financial or otherwise.
The use of the site is agreement that the site is for informational and educational purposes only and does not constitute advice in any form in the furtherance of any trade or trading decisions.
The accuracy, completeness and timeliness of the information contained on this site cannot be guaranteed. IC Markets does not warranty, guarantee or make any representations, or assume any liability with regard to financial results based on the use of the information in the site.
News, views, opinions, recommendations and other information obtained from sources outside of www.icmarkets.com.au, used in this site are believed to be reliable, but we cannot guarantee their accuracy or completeness. All such information is subject to change at any time without notice. IC Markets assumes no responsibility for the content of any linked site. The fact that such links may exist does not indicate approval or endorsement of any material contained on any linked site.
IC Markets is not liable for any harm caused by the transmission, through accessing the services or information on this site, of a computer virus, or other computer code or programming device that might be used to access, delete, damage, disable, disrupt or otherwise impede in any manner, the operation of the site or of any user’s software, hardware, data or property.


