
Tuesday 14th November: Technical outlook and review.
Waiting for lower timeframe confirmation is our main tool to confirm strength within higher timeframe zones, and has really been the key to our trading success. It takes a little time to understand the subtle nuances, however, as each trade is never the same, but once you master the rhythm so to speak, you will be saved from countless unnecessary losing trades. The following is a list of what we look for:
- A break/retest of supply or demand dependent on which way you’re trading.
- A trendline break/retest.
- Buying/selling tails/wicks – essentially we look for a cluster of very obvious spikes off of lower timeframe support and resistance levels within the higher timeframe zone.
We typically search for lower-timeframe confirmation between the M15 and H1 timeframes, since most of our higher-timeframe areas begin with the H4. Stops are usually placed 1-3 pips beyond confirming structures.
EUR/USD:
The euro is effectively unchanged this morning, due to Monday’s somewhat bare economic calendar. Because of this, much of the following report will echo views put forward in yesterday’s analysis.
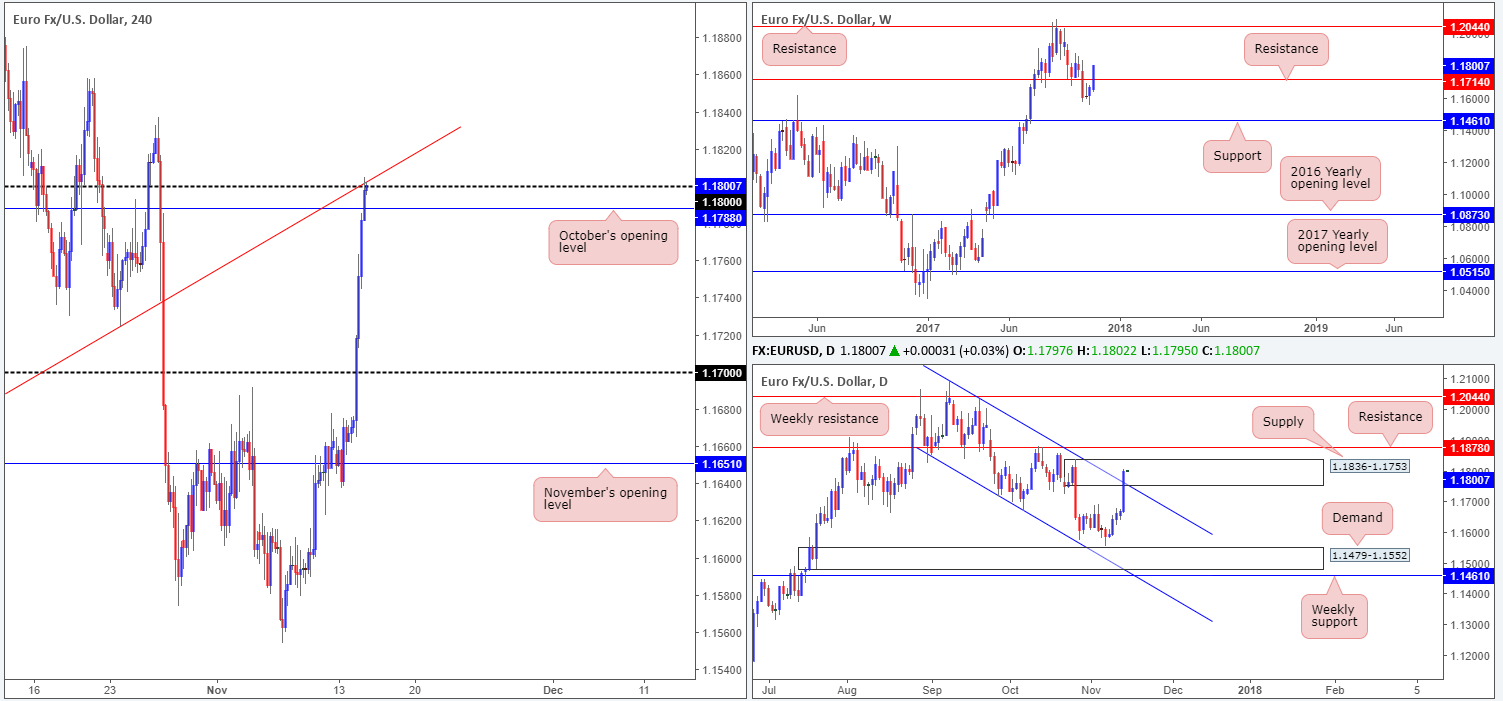
For those who follow our reports on a regular basis you may recall that in last week’s weekly report the desk underscored a prospective buy trade from a H4 demand area penciled in at 1.1541-1.1570. Our buy order was filled at 1.1567 amid the early hours of last Tuesday’s segment, and the stop-loss order was positioned a few pips below the aforesaid H4 demand area at 1.1540. As 1.16 was touched on Wednesday, our first take-profit target, the team decided to reduce risk to breakeven here and bank some profits. Thursday’s advance, however, brought the unit up to our second take-profit zone: November’s opening level at 1.1651. Further profits were banked at this point and the stop-loss order moved up to 1.1595.
Suggestions: We intend on holding our current long trade as the H4 candles seem to have conquered November’s opening level. We have also moved the stop-loss order up to 1.1621, just beneath the H4 tail seen at 1.1622.
The 1.17 handle, situated a few pips underneath weekly resistance at 1.1714, is the final take-profit zone for this trade. With it being a nice-looking zone to sell it makes for a strong final target. Well done to any of our readers who have managed to ride this trade alongside us!
Data points to consider: German prelim GDP q/q at 7am; EUR flash GDP q/q, German ZEW economic sentiment and ECB President Draghi speech at 10am; FOMC member Evans speaks at 8.05am; Fed Chair Yellen speaks at 10am; US PPI m/m at 1.30pm GMT.
Levels to watch/live orders:
- Buys: 1.1567 ([live] stop loss: 1.1621).
- Sells: Flat (stop loss: N/A).
GBP/USD:
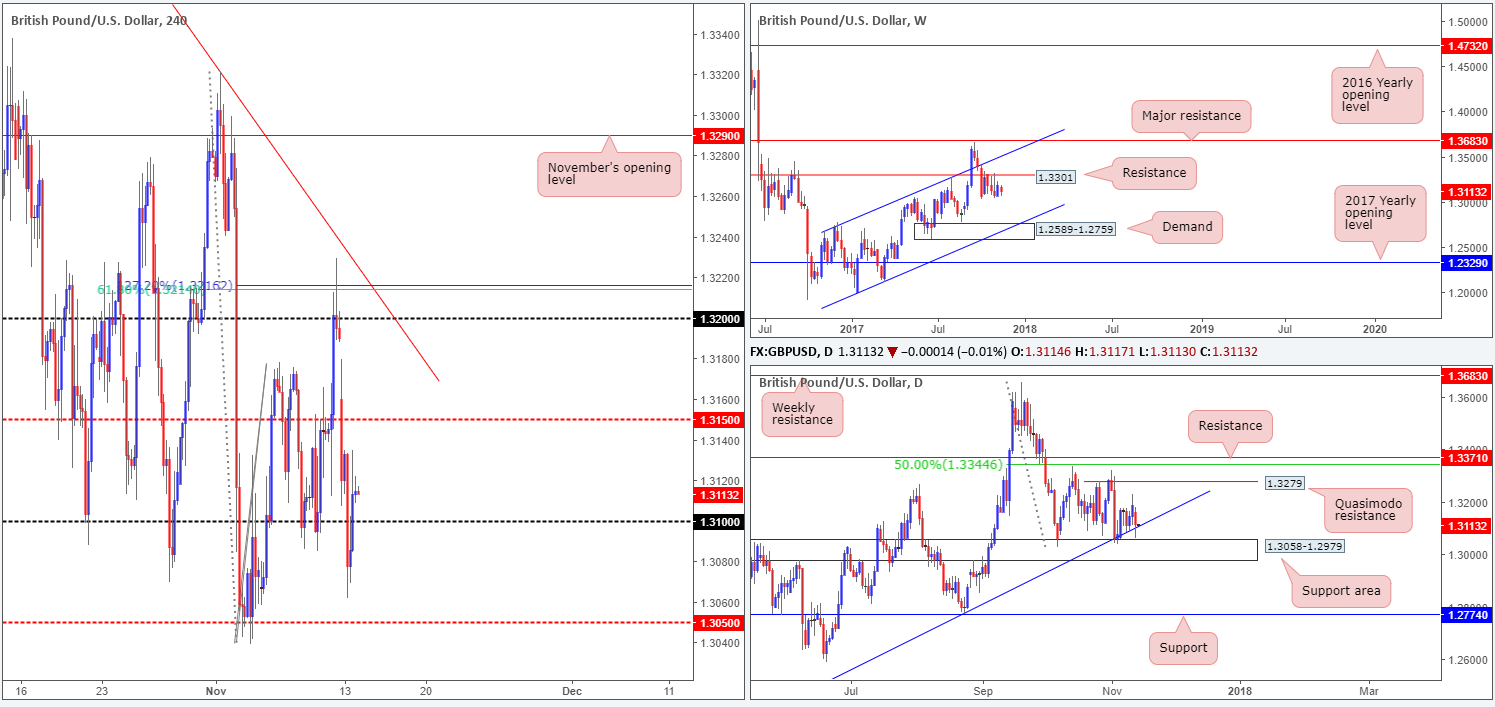
UK political uncertainty sparked a selloff in GBP-related markets on Monday. In early Asian trading, the H4 mid-level support 1.3150 was seized. This opened the path south for price to challenge the 1.31 handle, and challenge it did! The H4 candles aggressively broke through this number, likely ripping through a truckload of stop orders in the process, and tapped a session low of 1.3061.
1.3061, as can be seen on the daily timeframe, is seen just a few pips ahead of the support area at 1.3058-1.2979, which happens to intersect closely with a daily trendline support etched from the low 1.2108. The pair mildly pared losses into the close, as price rose back above the 1.31 hurdle and clocked a high of 1.3134.
Suggestions: Regardless of the fact that there are daily supports in play right now, one must not forget that weekly price recently shook hands with a weekly resistance level drawn from 1.3301. Adding to this, we do not see much technical confluence on the H4 timeframe to hang our hat on right now. Keeping this in mind, we still feel that opting to stand on the sidelines here may very well be the best path to take for the time being.
Data points to consider: UK inflation figures at 9.30am; BoE Gov. Carney speaks at 10am; MPC member Cunliffe speaks at 5.30pm; FOMC member Evans speaks at 8.05am; Fed Chair Yellen speaks at 10am; US PPI m/m at 1.30pm GMT.
Levels to watch/live orders:
- Buys: Flat (stop loss: N/A).
- Sells: Flat (stop loss: N/A).
AUD/USD:
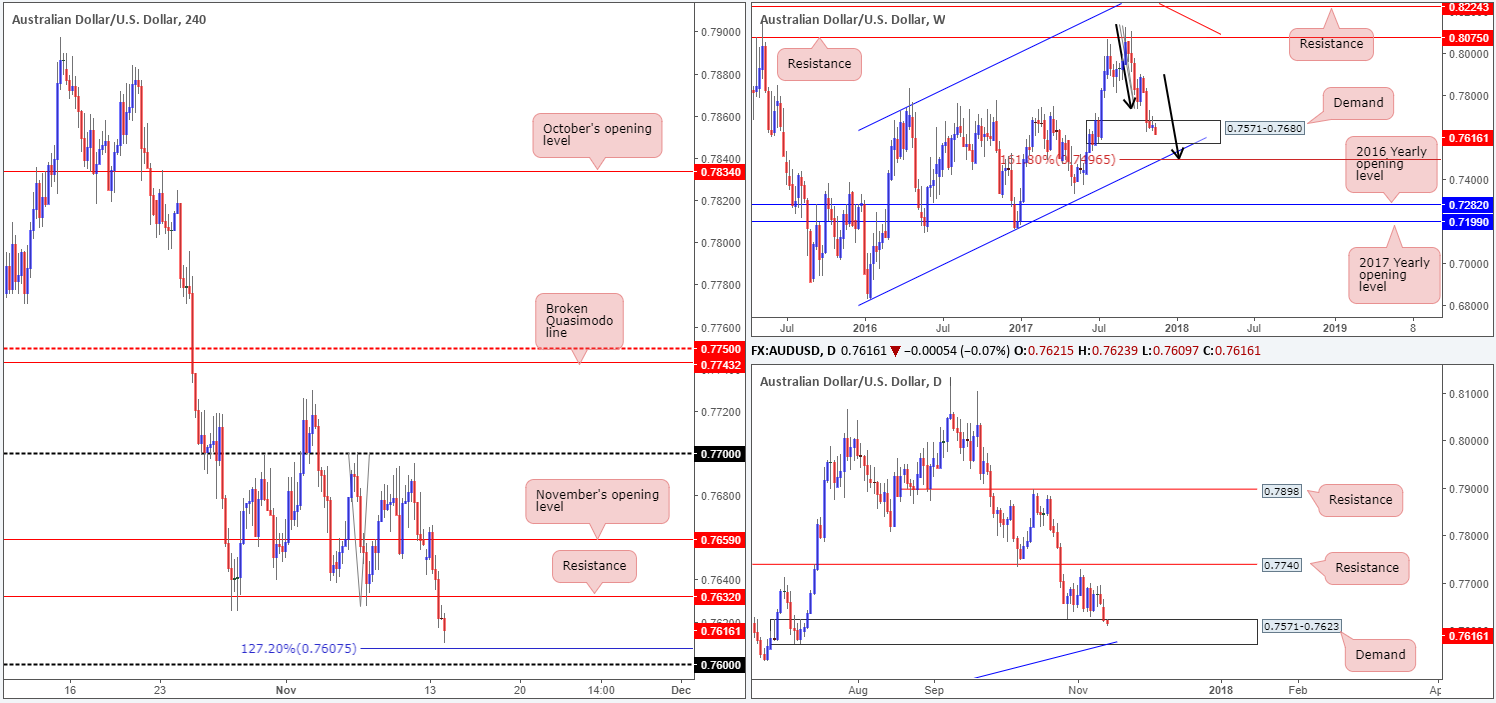
Failing to sustain gains above November’s opening line at 0.7659 in early Asia led to a rather dominant selloff throughout the day on Monday, which ended with the H4 candles cracking below support at 0.7632 (now acting resistance). What this latest move also accomplished, however, was opening up downside to the 0.76 handle. This psychological band is attractive, not only because it is positioned just beneath a 127.2% H4 Fib ext. point at 0.7607 (taken from the high 0.7700), but also due to it being located within the walls of a weekly demand area at 0.7571-0.7680 and its partner demand seen on the daily timeframe at 0.7571-0.7623.
Suggestions: While there remains downside risk in this market considering the strength of the bears since topping at 0.8125, the 0.76 hurdle looks appealing for a long. This is largely due to having the option of placing stops BELOW weekly demand mentioned above at 0.7571-0.7680.
As our current euro trade is in good profits and well protected, we would consider buying from here today should 0.76 come into the fray. The first take-profit line, at least for us, would be the nearby the H4 resistance at 0.7632.
Data points to consider: Chinese industrial production y/y at 2am; FOMC member Evans speaks at 8.05am; Fed Chair Yellen speaks at 10am; US PPI m/m at 1.30pm GMT.
Levels to watch/live orders:
- Buys: 0.76 region (stop loss: 0.7569).
- Sells: Flat (stop loss: N/A).
USD/JPY:
The USD/JPY ended the day marginally in the green on Monday, despite selling off from November’s opening level at 113.65. You may recall that this line was a noted sell zone in yesterday’s report, and since H4 price responded with a near-full-bodied bearish candle, it was a high-probability short. We did not take the trade, however, due to still being long the EUR/USD. Nevertheless, should we have done, this would have likely been a breakeven trade since price moved to a low of 113.24 before rotating back to the upside.
Seeing as how H4 price is attempting to climb back above 113.65, would we deem this break tradable up to 114? Personally, we would not since besides having a weekly supply at 115.50-113.85 in the picture, there is also room for daily price to punch as far south as demand pegged at 112.29-112.92.
Suggestions: As we are already long the EUR/USD and considering an additional long on the AUD/USD, a short from 113.65 is out of the question for us.
For those looking to sell this market though, we would advise waiting for H4 price to show bearish intent from 113.65 before pulling the trigger. What we mean by ‘bearish intent’ is simply waiting a full or near-full-bodied H4 bearish candle to form. This will help confirm if there are still active sellers residing here, since sell orders may have already been filled during yesterday’s move.
Data points to consider: FOMC member Evans speaks at 8.05am; Fed Chair Yellen speaks at 10am; US PPI m/m at 1.30pm; BoJ Gov. Kuroda speaks at 10am; JPY prelim GDP q/q at 11.50pm GMT.

Levels to watch/live orders:
- Buys: Flat (stop loss: N/A).
- Sells: 113.65 region ([waiting for a reasonably sized H4 bearish candle to form – preferably a full or near-full-bodied candle – is advised] stop loss: ideally beyond the candle’s wick).
USD/CAD:
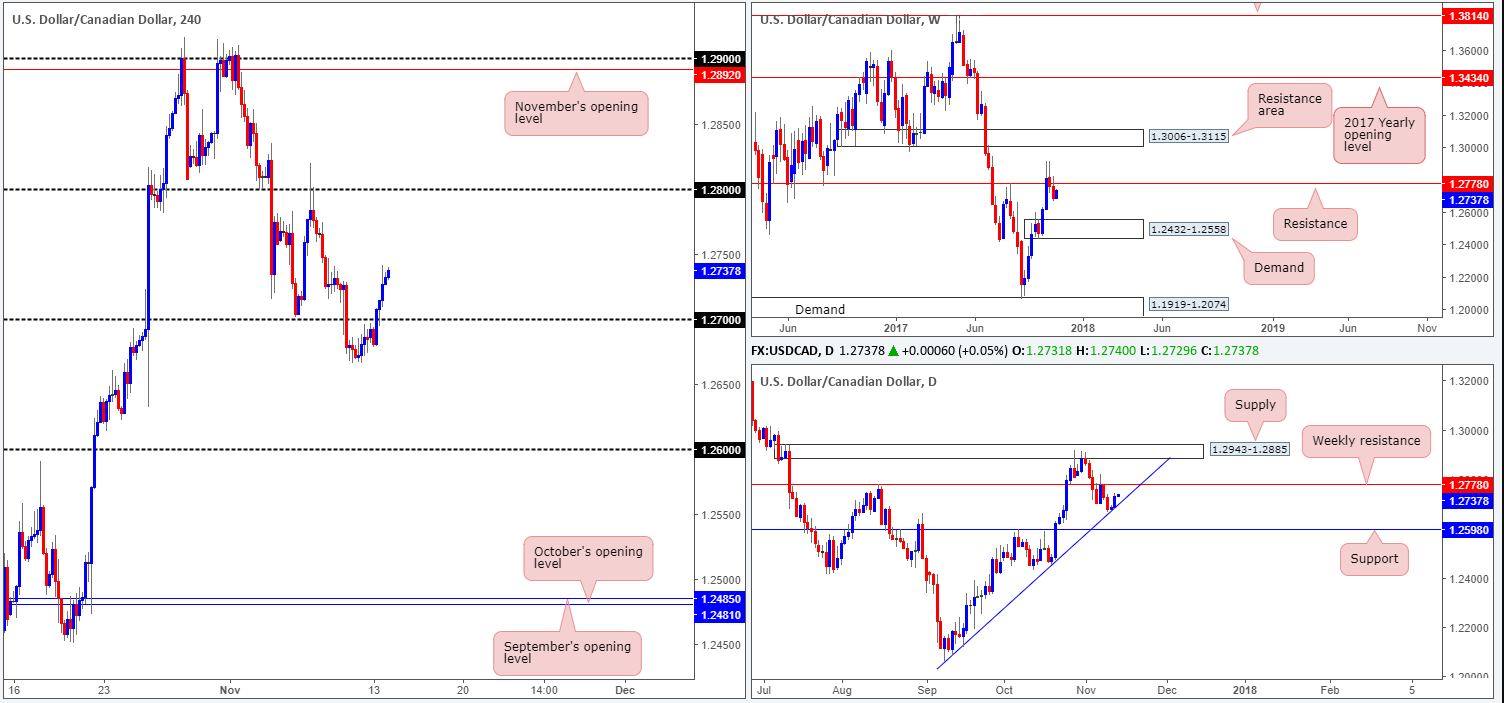
During the course of Monday’s segment, the buyers managed to find their feet early on in the day. Bolstered by a daily trendline extended from the low 1.2061, the unit was able to conquer the 1.27 handle seen marked on the H4 timeframe. What this recent move also did was bring the weekly resistance level at 1.2778 back onto the radar, as this is the next upside target on both the weekly and daily timeframes.
So, where do we go from here? Well, we see absolutely no reason to be looking for shorts at this time, at least until we reach the noted weekly resistance level. Buying, on the other hand, could be an option should the USD/CAD dip lower and retest 1.27. This trade could realize a sizeable gain since the upside target at that point would be the said weekly resistance barrier.
Suggestions: As we write, we feel there’s equal opportunity to trade this market both long and short today. A long is possible on a retest of 1.27, as mentioned above. However, before pulling the trigger, we would highly recommend waiting for a full or near-full-bodied H4 bullish candle to take shape. This will help avoid any fakeout below 1.27. In regard to a sell, the area seen between weekly resistance at 1.2778 and the 1.28 handle is high probability for a short. Again though, to avoid being whipsawed out of the position, waiting for a full or near-full-bodied bearish H4 candle to form is advised.
Data points to consider: FOMC member Evans speaks at 8.05am; Fed Chair Yellen speaks at 10am; US PPI m/m at 1.30pm GMT.
Levels to watch/live orders:
- Buys: 1.27 region ([waiting for a reasonably sized H4 bullish candle to form – preferably a full or near-full-bodied candle – is advised] stop loss: ideally beyond the candle’s tail).
- Sells: 1.28/1.2778 ([waiting for a reasonably sized H4 bearish candle to form – preferably a full or near-full-bodied candle – is advised] stop loss: ideally beyond the candle’s wick).
USD/CHF:
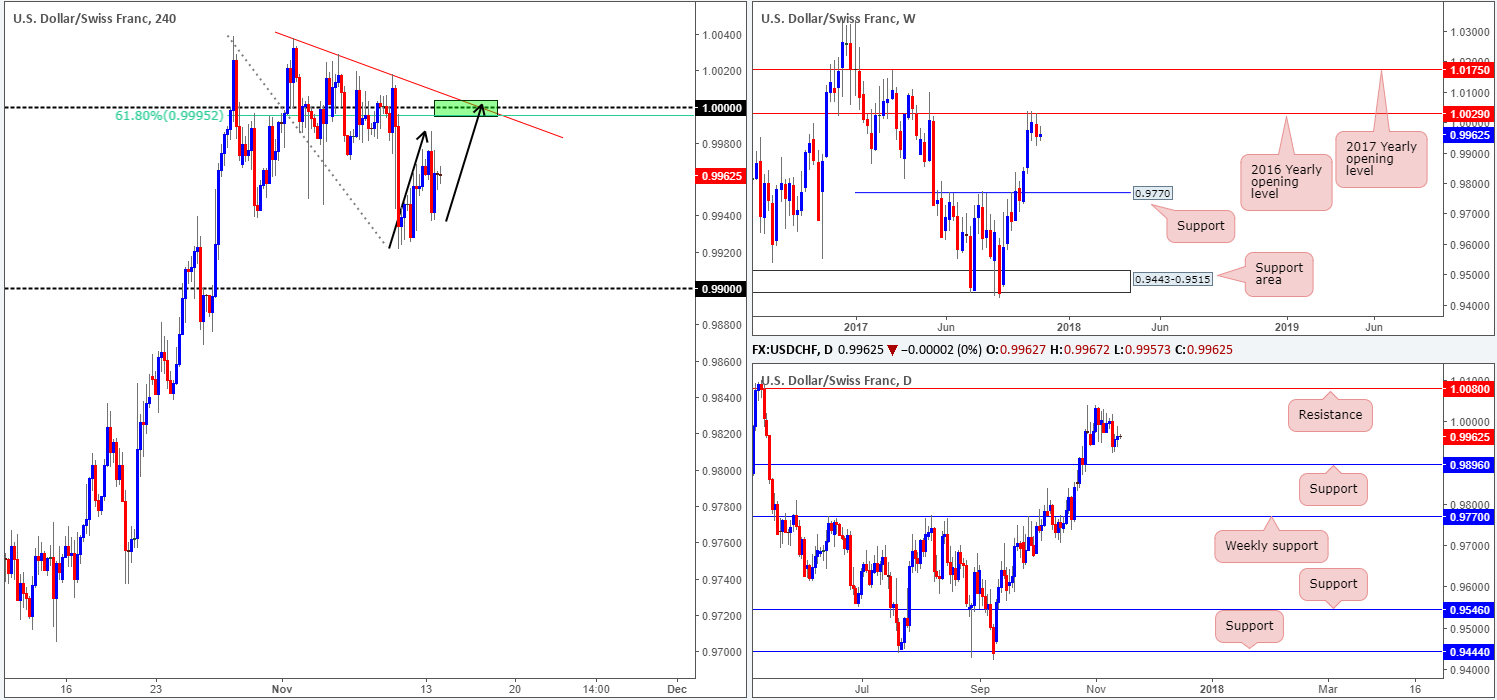
Despite the USD/CHF topping at highs of 0.9986 on Monday, there was little change recorded. Our outlook for this market, therefore, remains unchanged.
After crossing swords with the 2016 yearly opening level seen on the weekly chart at 1.0029 three weeks ago, the sellers finally made an entrance last week. Wiping out all of the prior week’s gains, the downside move could extend as far south as weekly support at 0.9770 in the coming weeks. Bouncing down to the daily candles, we can noticeably see that since the 27th October price has been trading within a consolidation in between a daily resistance level at 1.0080 and a daily support logged in at 0.9896. Given the push south from the noted 2016 yearly opening level, however, the aforesaid daily support is likely going to enter the fray sometime this week.
Switching over to the H4 timeframe, the Swissie is seen trading 35 pips below parity (1.0000), which boasts attractive confluence for a sell. Besides the H4 trendline resistance taken from the high 1.0037 and a 61.8% Fib resistance at 0.9993, there’s also a possible AB=CD bearish forming on approach (see black arrows). Be that as it may, we will only consider a sell valid from here if, and only if, a H4 full or near-full-bodied bearish candle forms. This would be enough evidence to warrant a short, targeting 0.99/daily support at 0.9896. The reason behind needing the additional candle confirmation is simply to avoid a potential fakeout above 1.0000 to the aforementioned 2016 yearly opening level.
Data points to consider: FOMC member Evans speaks at 8.05am; Fed Chair Yellen speaks at 10am; US PPI m/m at 1.30pm; CHF PPI m/m at 8.15am GMT.
Levels to watch/live orders:
- Buys: Flat (stop loss: N/A).
- Sells: 1.0000 region ([waiting for a reasonably sized H4 bearish candle to form – preferably a full or near-full-bodied candle – is advised] stop loss: ideally beyond the candle’s wick).
DOW 30:
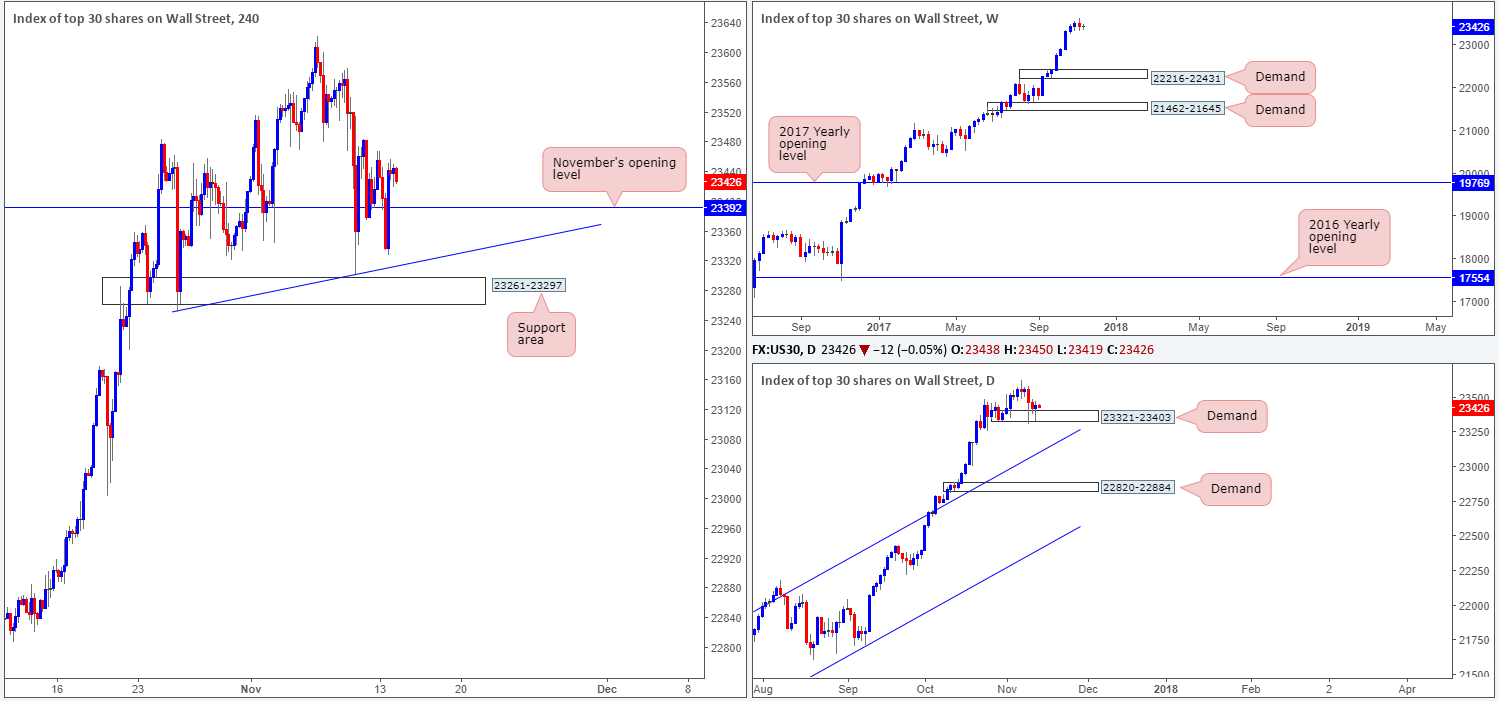
Although the DJIA whipsawed through November’s opening level at 23392 on Monday, the index is little changed this morning. Bolstered by the daily demand base registered at 23321-23403, H4 price was able to remain above 23392 into the closing bell. Also something worth remembering is that weekly price chalked up a rather nice-looking bearish engulfing formation last week, after eight consecutive weeks of gains.
For the weekly bearish engulfing candle to work, not only do H4 sellers need to overcome 23392, they also need to crack through a H4 trendline support taken from the low 23250 as well as a H4 support area at 23261-23297 (positioned beneath the aforementioned daily demand).
Suggestions: Buying this market after a weekly bearish engulfing candle is not something the team would stamp high probability. Likewise, we would not consider becoming sellers on the basis of this weekly candlestick formation until the noted H4 support area is taken out. To that end, we’ll likely be sidelined during today’s segment.
Data points to consider: FOMC member Evans speaks at 8.05am; Fed Chair Yellen speaks at 10am; US PPI m/m at 1.30pm GMT.
Levels to watch/live orders:
- Buys: Flat (stop loss: N/A).
- Sells: Flat (stop loss: N/A).
GOLD:
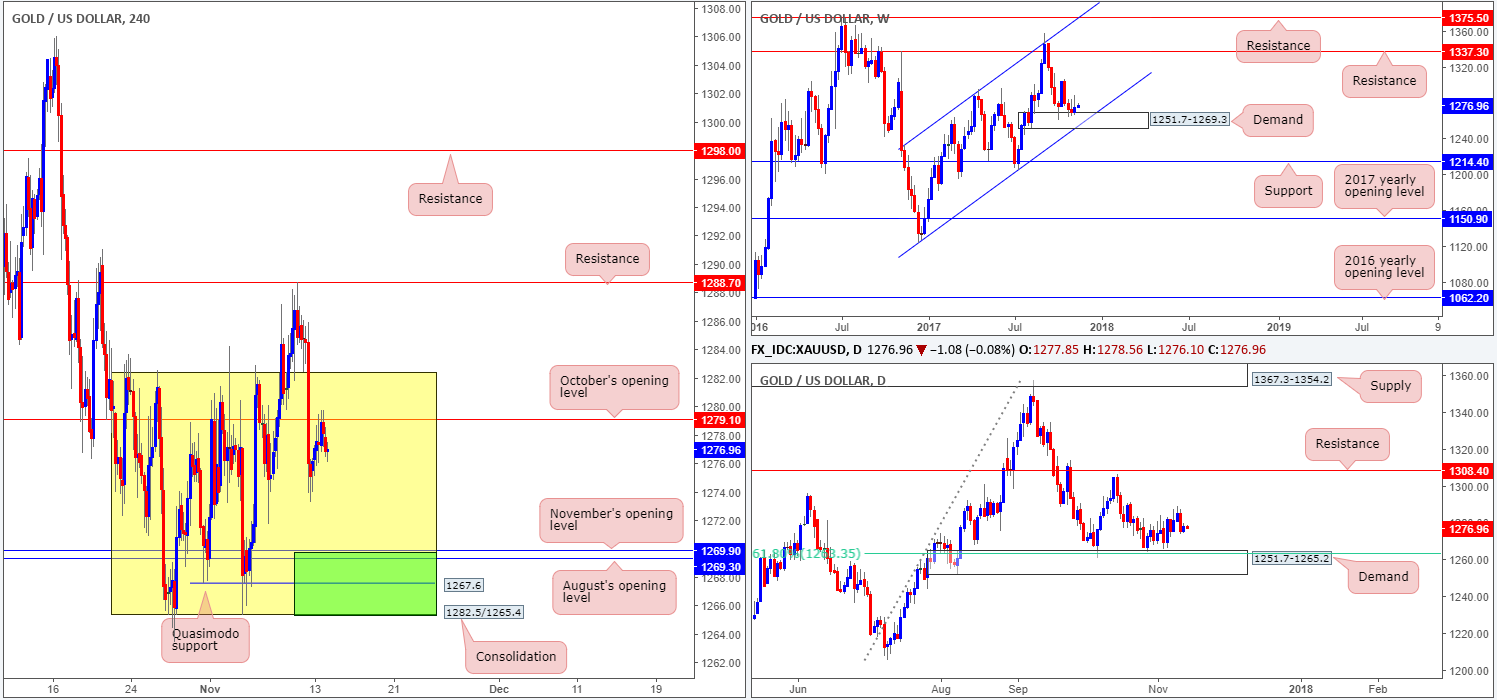
Following Friday’s precipitous selloff that broke back into the H4 consolidation zone fixed between 1282.5/1265.4, H4 price pulled back amid Monday’s sessions and retested the underside of October’s opening level at 1279.1. So far, as you can see, the level has held firm. This, however, is not a sell the team would be excited about, given that weekly bulls began making a stand around the top edge of a weekly demand area marked at 1251.7-1269.3 last week.
With the above notes in mind, we’re still eyeing the 1265.4/1269.9 green area seen on the H4 timeframe for potential longs. The lower edge of the current H4 range at 1265.4, as well as the nearby H4 Quasimodo support at 1267.6 along with August and September’s opening levels seen just above at 1269.3/1269.9 form a strong-looking buy zone. What’s more, let’s not forget that we have the weekly and daily demands mentioned above bolstering the underside of this green area!
Suggestions: To be on the safe side though, we would advise waiting for additional H4 candle confirmation, since there is a risk that the yellow metal may want to drive deeper into the current weekly demand to test the weekly channel support extended from the low 1122.8.
Levels to watch/live orders:
- Buys: 1265.4/1269.9 ([waiting for a reasonably sized H4 bullish candle to form – preferably a full or near-full-bodied candle – is advised] stop loss: ideally beyond the candle’s tail).
- Sells: Flat (stop loss: N/A).


