
Lower timeframe confirmation: is something we use a lot in our analysis. All it simply means is waiting for price action on the lower timeframes to confirm direction within a higher timeframe area. For example, some traders will not enter a trade until an opposing supply or demand area has been consumed, while on the other hand, another group of traders may only need a trendline break to confirm direction. As you can probably imagine, the list is endless. We, however, personally prefer to use the two methods of confirmation mentioned above in our trading.
EURUSD:
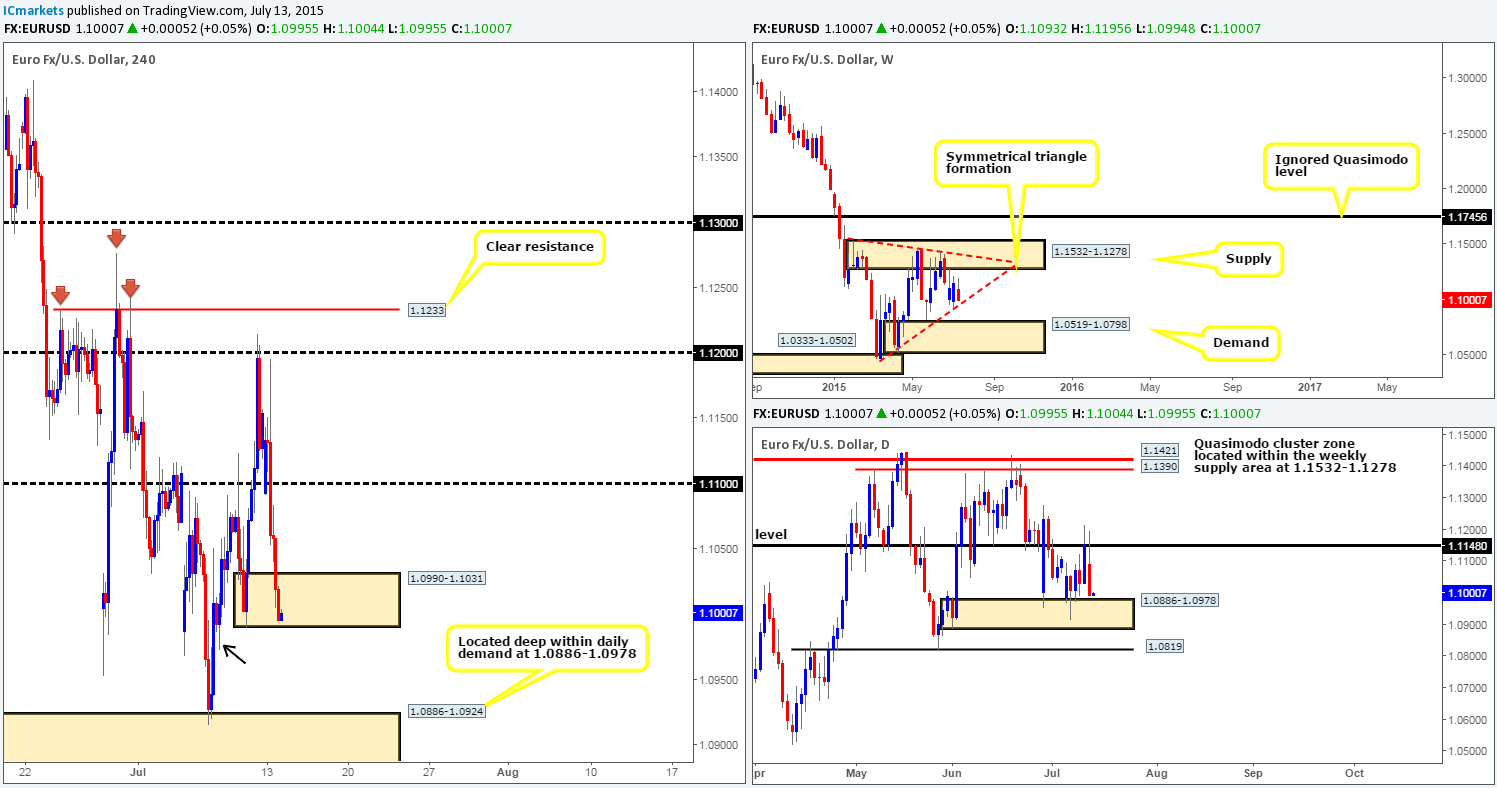
A strong wave of bids came in from the 1.1100 region yesterday following initial news that Greece had finally reached a deal with its creditors. However, the buying was relatively short-lived as price failed to break 1.1200 which led to an unrelenting squeeze to the downside when London opened for business. This sell-off cut through 1.1100 with relative ease and continued lower into the U.S session driving price deep into a 4hr demand area coming in at 1.0990-1.1031. Fundamentally, this recent selling likely stemmed from an air of uncertainty as to whether Greek parliament will accept the most recent deal.
Technically, agreement is being seen across the board regarding the higher timeframe picture. The weekly chart shows price hovering just above an ascending weekly trendline taken from the low 1.0468 (lower limit of a weekly symmetrical triangle formation), while on the daily chart price is seen floating just above a daily demand area coming in at 1.0886-1.0978. Therefore, with this in mind, our prime focus today will be on looking for confirmed longs at the current 4hr demand area.
Should this zone be taken out, however, price will likely sell off due to little active demand being seen below here until the 4hr demand area at 1.0886-1.0924 – check out the demand consumption tail marked with a black arrow at 1.0972. This lower 4hr demand area is also on our watch list and is somewhere we’d consider buying into this market as long as we see some sort of lower timeframe buy signal beforehand.
The reason we require confirmation on both of the said 4hr demand areas is simply because volatile moves will still likely be seen on the back of more rumors flooding the market regarding the never-ending Greek saga.
Levels to watch/live orders:
- Buys: 1.0990-1.1031 [Tentative – confirmation required] (Stop loss: 1.0985) 1.0886-1.0924 [Tentative – confirmation required] (Stop loss: 1.0882).
- Sells: Flat (Stop loss: N/A).
GBP/USD:
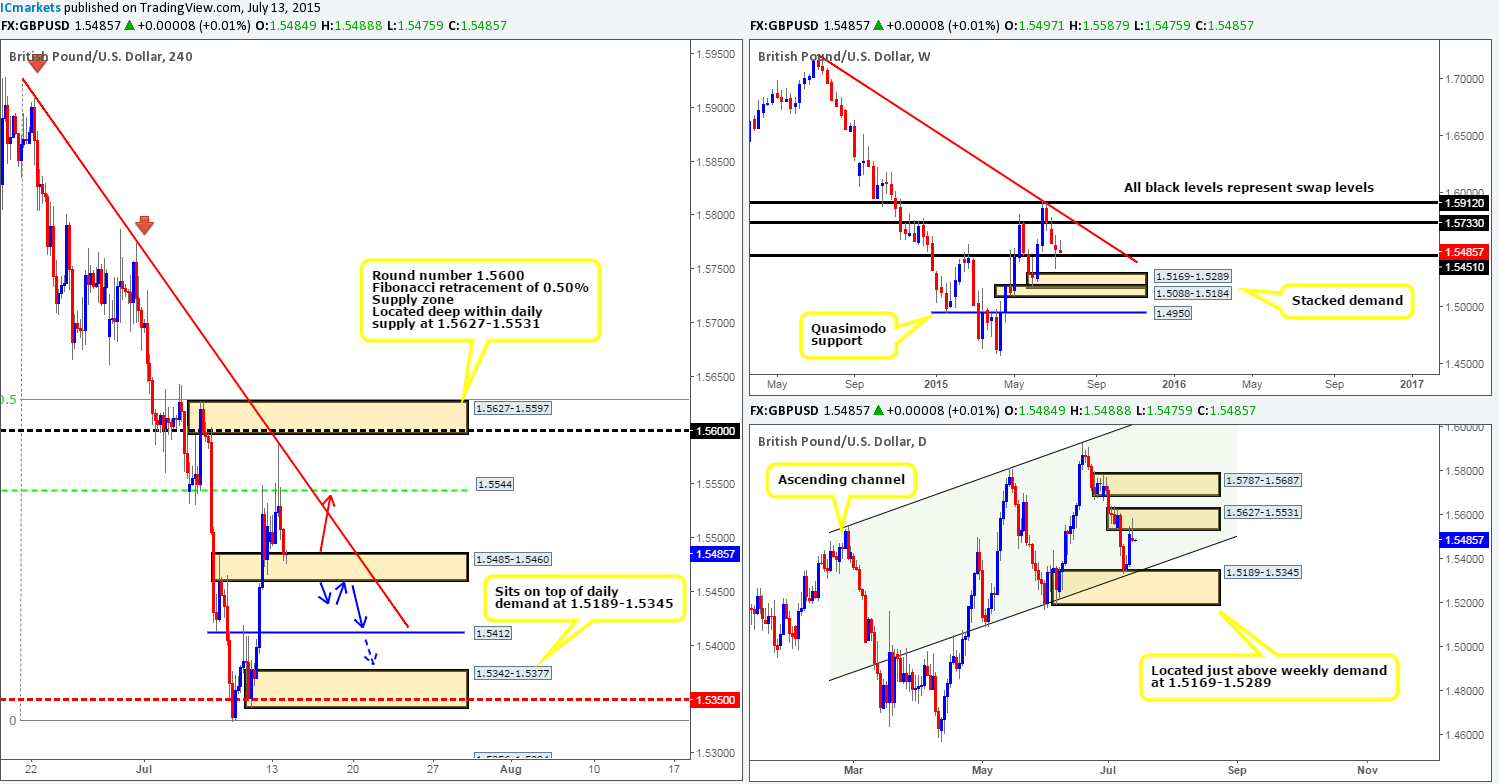
Mid-way through yesterday’s London morning session, the bulls broke above a 4hr swap level at 1.5544 resulting in price connecting with a 4hr downtrend line extended from the high 1.5908. As you can see, the bulls stood no chance here as bears hammered the GBP back down below 1.5544. This selling continued into the U.S trading session, which led to price testing a 4hr swap area at 1.5485-1.5460 going into the daily close 1.5484.
In the bigger picture, the weekly timeframe shows price is still lurking above the weekly swap level coming in at 1.5451, while the daily timeframe reveals a bearish pin-bar candle printed yesterday from the underside of a daily supply area seen at 1.5627-1.5531.
With all of the above taken into account, here is our take on the market’s possible movements today on the 4hr timeframe purely from a price action perspective… It is quite possible a rally could be seen from the current 4hr swap area up to 1.5544 today (as per the red arrow), so do keep a close eye on the lower timeframe price action for any confirmed longs that may be seen from here. In the event that price trades lower today and breaches the 4hr swap area, however, the path south would then likely be clear down to at least 1.5412, which if you look across to the daily chart, you’ll see that it coincides nicely with the lower limit of the daily ascending channel (1.5089/1.5551). With this, one could look to trade any confirmed retest seen at the underside the 4hr swap area (as per the blue arrows) and target 1.5412, or even the 4hr demand area seen just below it at 1.5342-1.5377, which as you can see not only converges nicely with the mid-level number 1.5350, but also sits on top of a daily demand area at 1.5189-1.5345.
Levels to watch/ live orders:
- Buys: 1.5485-1.5460 [Tentative – confirmation required] (Stop loss: 1.5454).
- Sells: Flat (Stop loss: N/A).
AUD/USD:
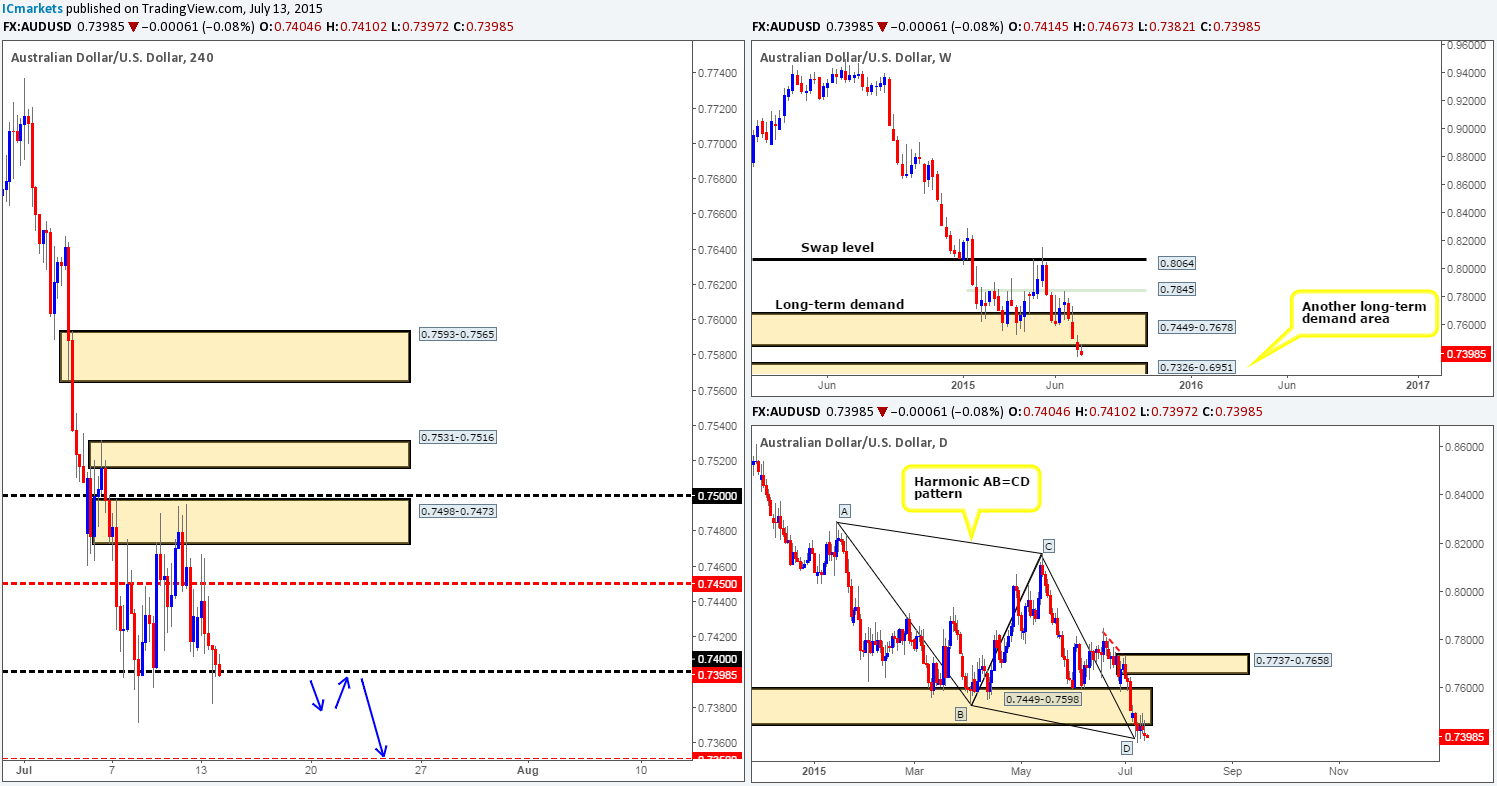
During the course of yesterday’s sessions, we can see that price retested the mid-level hurdle 0.7450 as resistance and plunged south into the round number support 0.7400. Bids at 0.7400 seem to be struggling to hold this market higher at the moment, and looks like this temporary floor will give way very soon.
In the event that a close below 0.7400 is seen today, this would, in effect, be our cue to begin watching for price to retest 0.7400 as resistance and look for lower timeframe confirmed shorts into this market, as the path south would then very likely be free down to the mid-level number 0.7350, or given enough time, 0.7326 – the top-side of weekly demand.
On the subject of the higher timeframes, the weekly chart is currently showing price respecting the underside of the recently broken weekly demand area at 0.7449-0.7678, which could potentially force price down to weekly demand at 0.7326-0.6951. Meanwhile however, on the daily chart, price has been consolidating for the past five trading days just below daily demand at 0.7449-0.7598, which is also around a completion point for a daily Harmonic AB=CD bullish pattern. There is very little strength being seen here at the moment, which (similar to the weekly and 4hr timeframes) suggests that this market is very likely headed lower sometime soon. The next area of support to keep an eye on, on the daily scale is given at 0.7227.
So, to conclude, our team has absolutely no interest in buying this pair for the time being. Instead, we’re looking for 0.7400 to give way and be retested as resistance, which will likely give us the opportunity to short this market, targeting 0.7350/0.7326…
Levels to watch/ live orders:
- Buys: Flat (Stop loss: N/A).
- Sells: Flat (Stop loss: N/A).
USD/JPY:
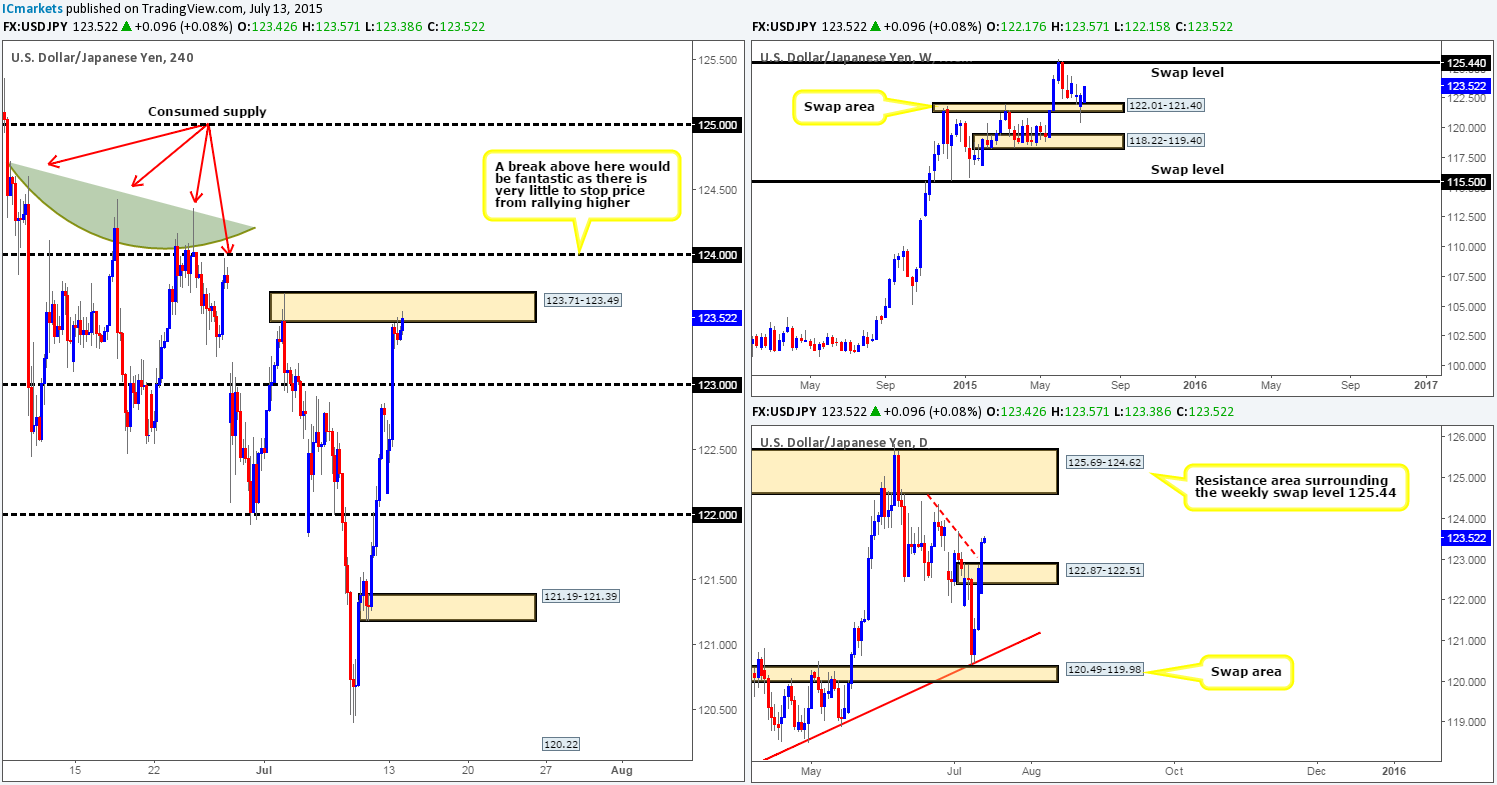
Going into yesterday’s European open, a strong wave of bids hit the line. This move saw price completely engulf the 123.00 handle and jab into a 4hr supply area coming in at 123.71-123.49, which, as you can see managed to hold this market lower throughout both the London and U.S trading sessions.
Checking in on the higher timeframes, we can see that the rebound from the weekly swap area at 122.01-121.40 has so far extended higher. The next resistance to watch out for on this timeframe is the weekly swap level 125.44. In addition to this, the daily timeframe shows price broke above a daily supply area at 122.87-122.51 yesterday, which likely confirms higher prices will be seen up to a daily resistance area coming in at 125.69-124.62 (surrounds the aforementioned weekly swap level).
Therefore, with everything taken into consideration, our team has no interest in selling at the current 4hr supply area. In saying this, even if price breaks above this barrier, which it likely will, we would still not be comfortable buying this market with 124.00 looming just above. Ultimately, we are looking for price to close above 124.00 before looking to buy this pair, as there is very little seen above here until at least 125.00. Check out the supply consumption wicks seen marked with red arrows at: 123.97/124.36/124.43/124.61.
Levels to watch/ live orders:
- Buys: Flat (Stop loss: N/A).
- Sells: Flat (Stop loss: N/A).
USD/CAD:
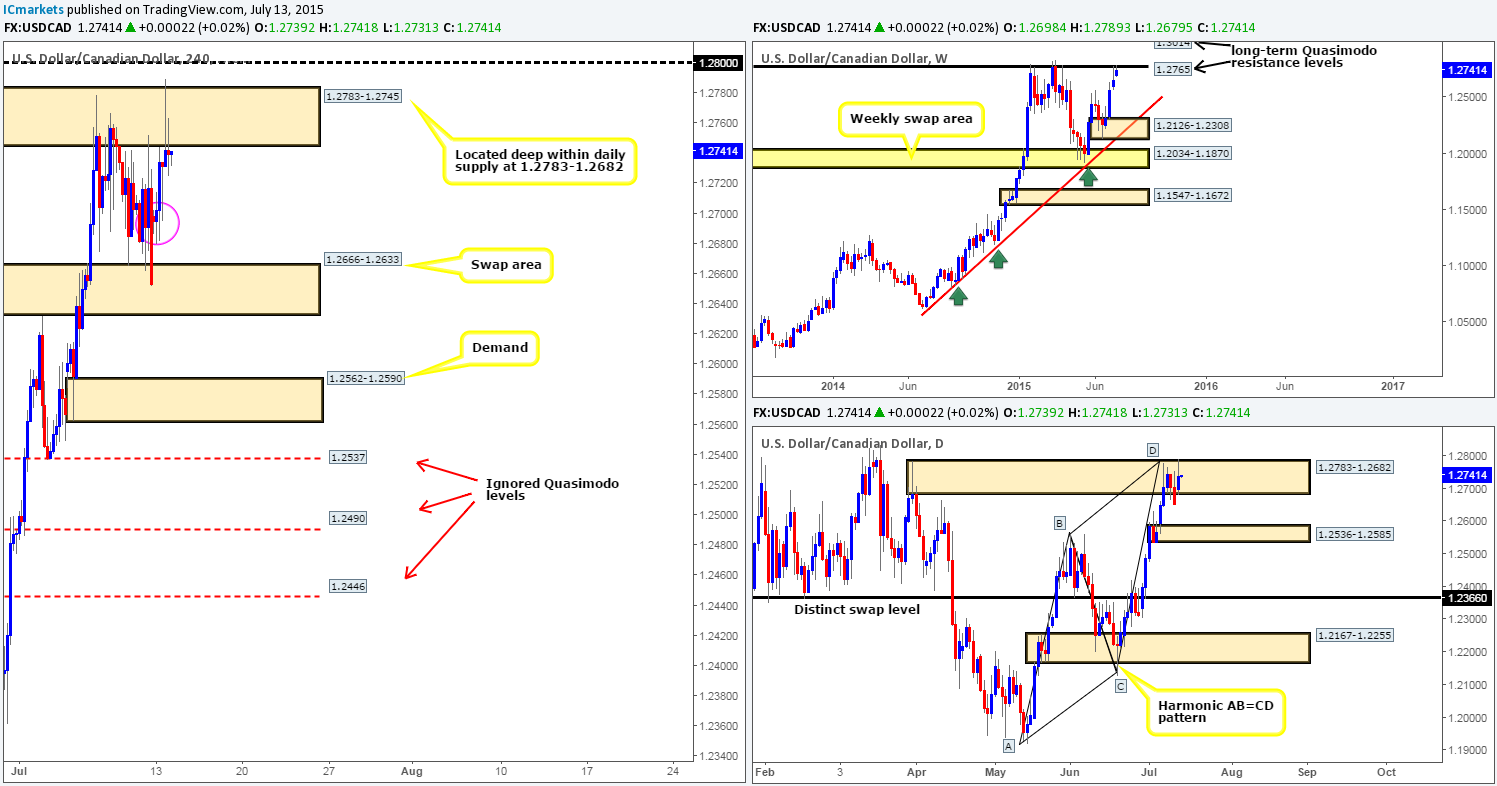
Following yesterday’s open at 1.2698, the USD/CAD rallied higher consequently driving price deep into a 4hr supply area coming in at 1.2783-1.2745. Considering that this area of 4hr supply boasts support from the following higher timeframe zones (see below) we believe this market will eventually sell off today/this week:
- Daily supply area at 1.2783-1.2682.
- Daily Harmonic AB=CD bearish pattern completion point at 1.2783.
- Long-term weekly Quasimodo resistance level at 1.2765.
In addition to this, candlestick action shows there is potentially very little demand left on the 4hr timeframe until price reaches the 4hr swap area at 1.2666-1.2633. Check out the possible demand consumption tails seen marked with a pink circle at: 1.2695/1.2681/1.2679.
Therefore, with everything taken into consideration, our objective today is simple. Watch current price action on the lower timeframes for a confirming sell signal. To be on the safe side here, nonetheless, our stop will be placed 15 pips above the round number 1.2800 should we manage to spot an entry south.
Levels to watch/ live orders:
- Buys: Flat (Stop loss: N/A).
- Sells: 1.2783-1.2745 [Tentative – confirmation required] (Stop loss: 1.2815).
USD/CHF:
The Swiss Franc took a right beating yesterday as the U.S Dollar surged over 100 pips into round number resistance at 0.9500. 0.9500 and the 4hr Quasimodo resistance level seen just above it at 0.9519 are still considered sell zones to us, simply because both the weekly and daily timeframes show price trading around resistive structures at present (Weekly swap level 0.9512/Daily supply 0.9597-0.9502).
With that, our prime focus today will be on looking for lower timeframe confirmed sell trades between 0.9500 and 0.9159. Should we manage to lock in a short position here, our ultimate take-profit target will be 0.9400. However, this is not a ‘set and forget’ trade. We intend to trail price as/if it moves in our favor, since letting a winning position turn into a loser is, as most are already aware, incredibly frustrating to say the least.

Levels to watch/ live orders:
- Buys: Flat (Stop loss: N/A).
- Sells: 0.9500/0.9519 [Tentative – confirmation required] (Stop loss: dependent on where one confirms this zone).
DOW 30
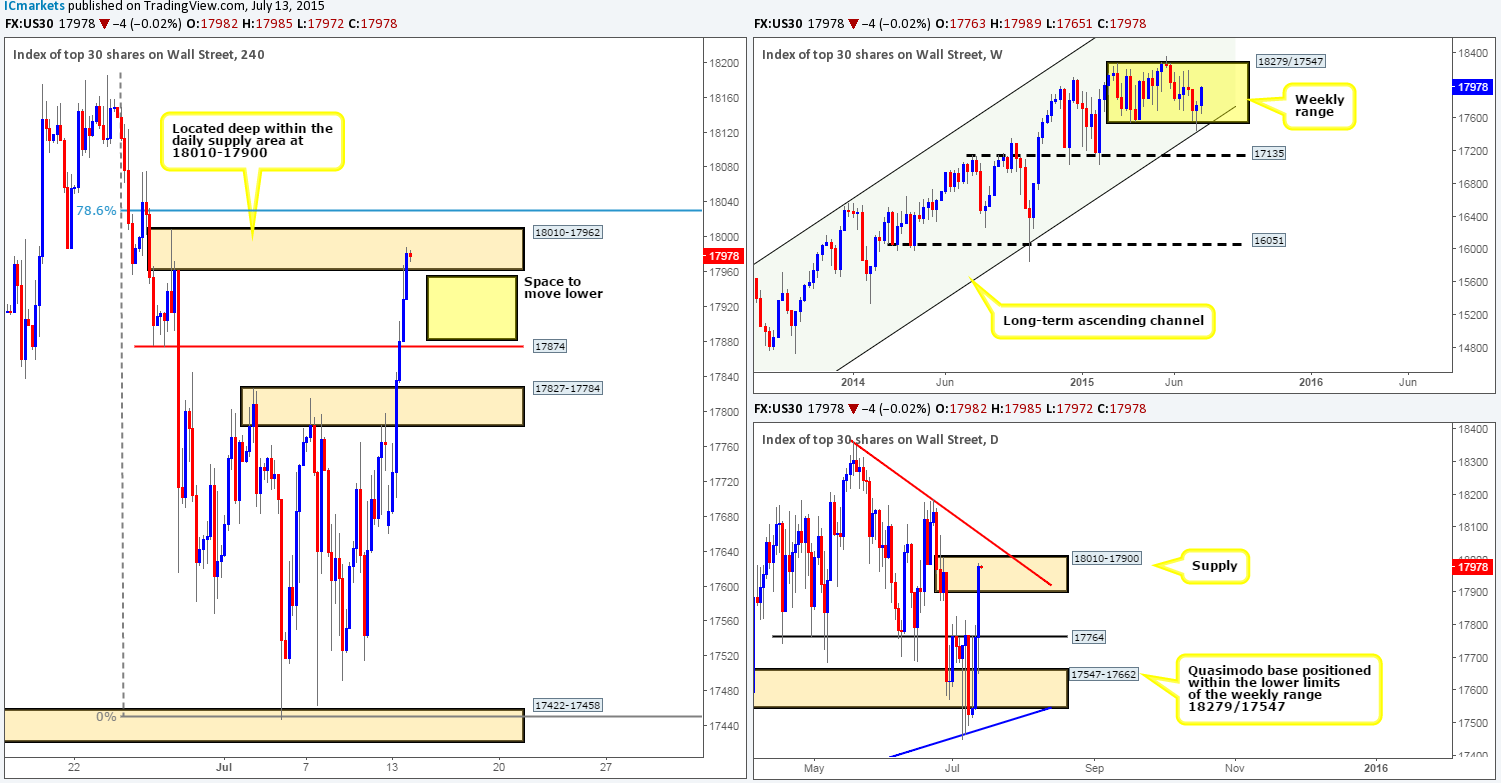
A heavy round of buying was seen on the DOW index throughout yesterday’s sessions. This, as a result, saw price take out both the 4hr supply area at 17827-17784 and a 4hr swap level at 17874, which shortly after attacked a 4hr supply area seen at 18010-17962 into the daily close 17982.
Selling at this 4hr area of supply today is certainly a possibility considering that it is located deep within a daily supply area at 18010-17900, and there is a very clear first take-profit target at 17874. However, before placing your sell orders here guys, take note that the 78.6% Fibonacci retracement value that lurks just above this 4hr supply, and also bear in mind that the weekly timeframe shows price is currently trading mid-range between 18279/17547. The safest way to trade the current 4hr supply area in our opinion is wait to see if the lower timeframes can confirm its strength. When we say lower timeframes here, we’re actually referring to no lower than the 30 minute timeframe in this case, as this will likely keep us out of trouble should this zone fail or even fakeout above to the 78.6% Fibonacci retracement number.
Levels to watch/ live orders:
- Buys: Flat (Stop loss: N/A).
- Sells: 18010-17962 [Tentative – confirmation required] (Stop loss: 18043).
XAU/USD: (Gold)
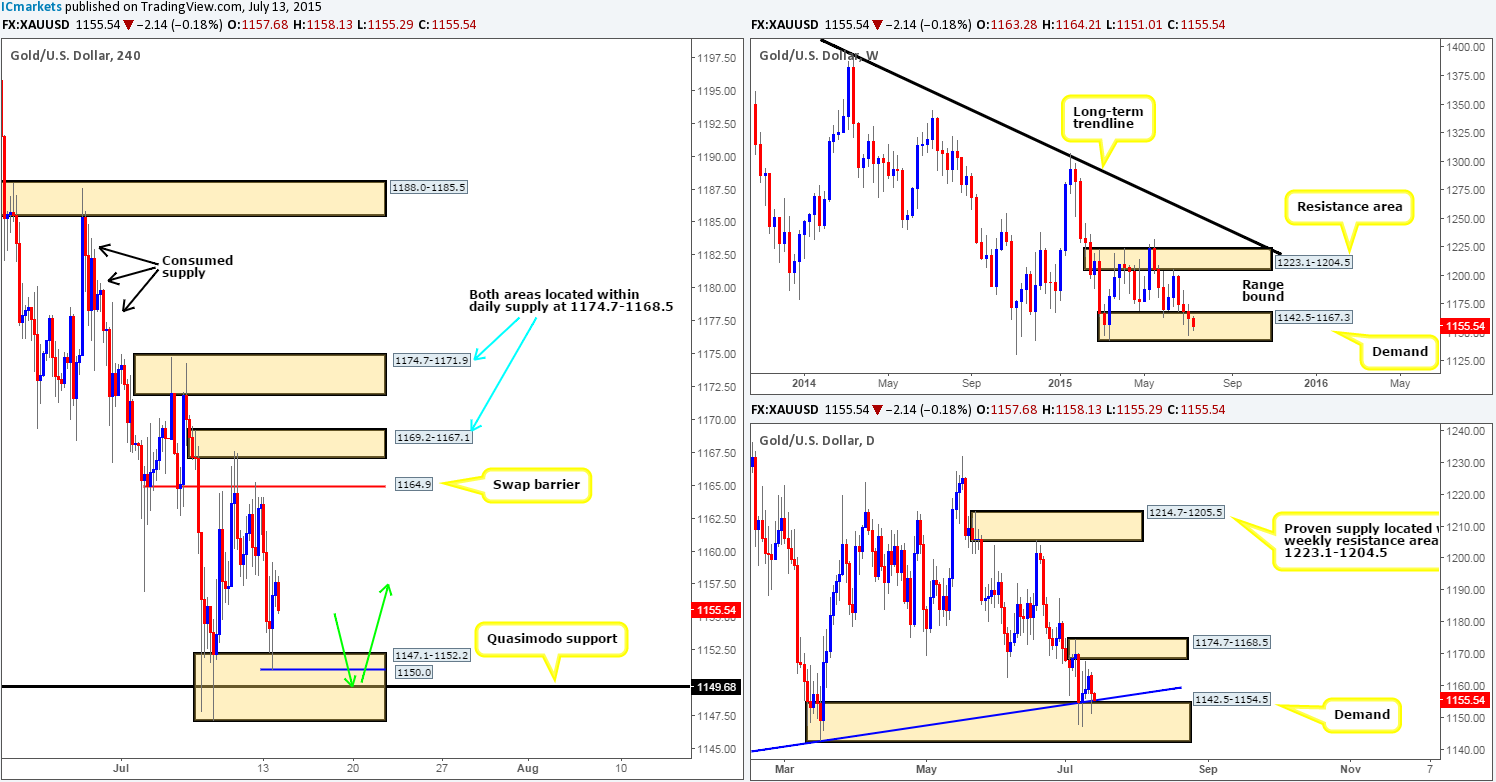
The Gold markets plummeted throughout Asia and also into the European/London morning sessions, consequently pulling prices down into a 4hr buy zone at 1147.1-1152.2, which, as you can see, was clearly strong enough to support a counter-attack back up to 1160.0 region.
We believe this 4hr buy zone to be a high-probability reversal point in the market for the following reasons:
- Located within weekly demand at 1142.5-1167.3.
- Located within daily demand at 1142.5-1154.5, which converges with a daily trendline extended from the low 1130.1.
- Converges with a 4hr Quasimodo support level at 1149.6.
Buying right now is not something we’re interested in since the risk/reward would be absolutely terrible. Therefore, we are now looking for a push back down in to the aforementioned 4hr buy zone, which breaks/fakes below the low 1150.0 into the 4hr Quasimodo support level. We already know there were active buyers within this 4hr buy zone, so a fake below the most recent swing low into 4hr Quasimodo support could trigger another reversal. Lower timeframe confirmation (primarily the 1-15 min timeframes will be used) will need to be seen following the break lower since we can never be sure how many willing buyers are left here. Should we manage to spot a long signal, our stop will likely be placed below at 1145.3, and our first take-profit target will be dependent on how price approaches our buy zone.
Levels to watch/ live orders:
- Buys: 1150.0/1149.6 [Tentative – confirmation required] (Stop loss: 1145.3).
- Sells: Flat (Stop loss: N/A).


