
EUR/USD:
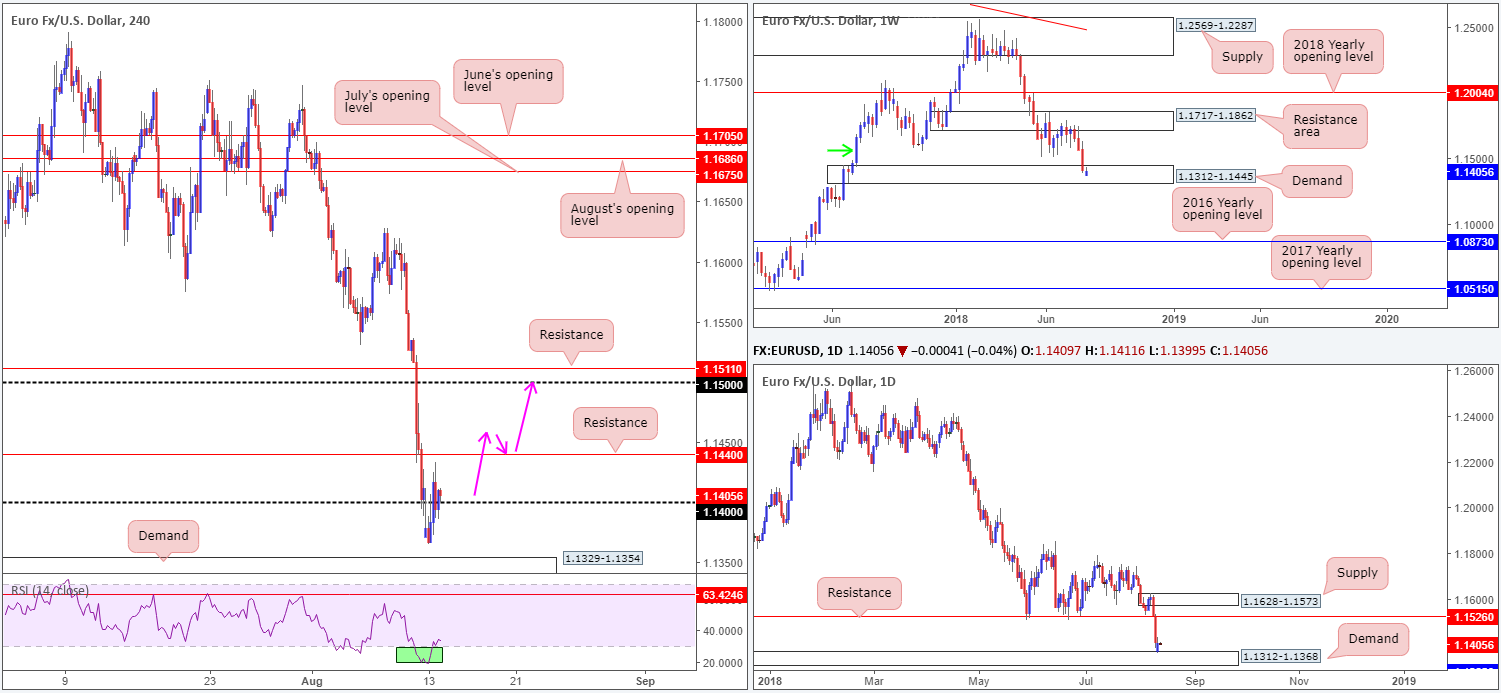
Beginning the week under pressure, the single currency drove to lows of 1.1365 and bottomed just north of H4 demand at 1.1329-1.1354, before printing a modest recovery and reclaiming 1.14 status. Despite an earnest attempt to push higher from here, H4 bulls lacked energy, unable to test nearby resistance at 1.1440. Also worth noting on the H4 scale is the RSI is seen recovering from oversold territory. With no significant macroeconomic data releases on Monday, the Turkish Lira (TRY) collapse remained in the spotlight.
On a wider perspective, weekly movement recently checked in at demand drawn from 1.1312-1.1445, formed on the break of the August 15 high (2016) at 1.1366. This demand is considered strong due to its momentum from the base (green arrow). Supporting the current weekly demand is a partner demand seen on the daily timeframe at 1.1312-1.1368. Seen positioned within the lower limits of weekly demand, the market observed a healthy response from here yesterday.
Areas of consideration:
With weekly and daily demands seen in play, 1.14 on the H4 timeframe may continue to attract buying interest and eventually gravitate higher. A H4 close above resistance at 1.1440 likely places the 1.15 handle in the firing range.
On account of the above reading, traders are urged to wait for a H4 close to form above nearby H4 resistance at 1.1440 before initiating longs. Waiting for H4 price to retest 1.1440 as support would (as per pink arrows), in our humble view, be the stronger trade, as this limits the likelihood of getting caught in a fakeout (stops best placed beyond the retesting candle’s tail).
Today’s data points: German prelim GDP q/q; EUR flash GDP q/q; German ZEW Economic sentiment.
GBP/USD:
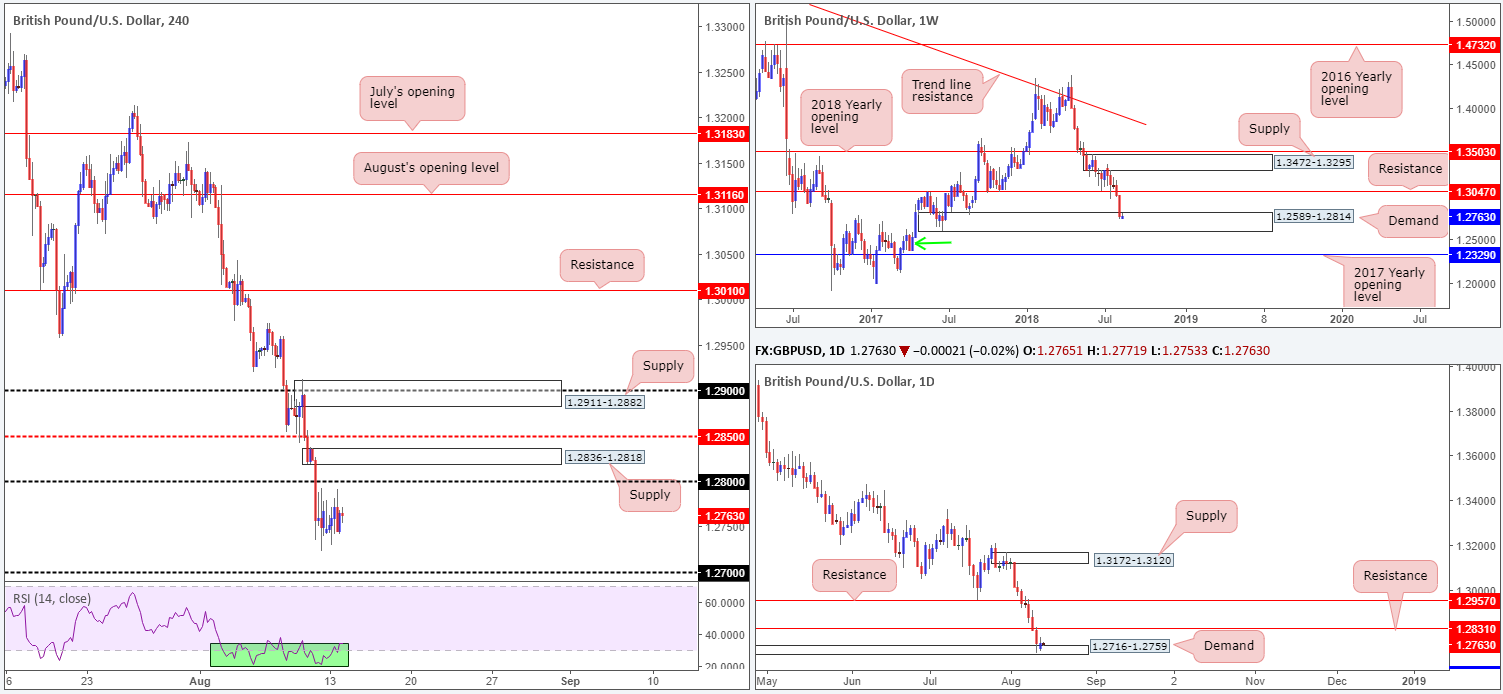
Sterling, as you can see, meandered around the lower edge of Friday’s range on Monday – a stone’s throw from the yearly low set last week at 1.2722. Amid limited macroeconomic data, the H4 candles consolidated just south of the 1.28 handle within a tight range. Given this lackluster movement, much of the following report will echo thoughts put forward in Monday’s analysis.
On the weekly timeframe, we can see cable eventually shook hands with demand located at 1.2589-1.2814. Having seen this area tested once already in August 2017 (indicating order consumption and therefore possible weakness), further selling could be seen. Beyond the current zone, demand marked with a green arrow at 1.2365-1.2555 is likely the next hurdle in the firing range, but with the 2017 yearly opening level lurking just beneath it at 1.2329, price could possibly fake lower to bring in buyers from this hurdle.
Fixed within the walls of weekly demand mentioned above at 1.2589-1.2814, daily demand at 1.2716-1.2759 was also brought into the fray last week. To the upside from here, resistance stands at 1.2831, with little seen above this angle until we reach 1.2957, another level of resistance. Beneath the current demand, nevertheless, a Quasimodo support at 1.2635 is seen (not visible on the screen).
Areas of consideration:
In view of current weekly and daily demands, buying may take shape in the early stages of this week, likely bringing 1.28 on the H4 timeframe back into the fold. A large portion of intraday sellers will be looking to short this number on the retest. While a sell from here could work out, a fakeout through this number (common viewing around psychological levels to run stops) is just as likely, in our view.
Given the H4 supply seen directly above 1.28 at 1.2836-1.2818 boasts strong momentum to the downside, and daily resistance at 1.2831 is seen positioned within the walls of this area, a sell from this supply is likely the better option over shorting 1.28. The only grumble here, of course, is weekly buyers could theoretically push the market as far north as weekly resistance at 1.3047 (the next upside target on the weekly scale). In light of this threat, should H4 price respond from the said H4 supply and print a H4 close beneath 1.28, consider reducing risk to breakeven as soon as possible.
Today’s data points: UK job’s data.
AUD/USD:
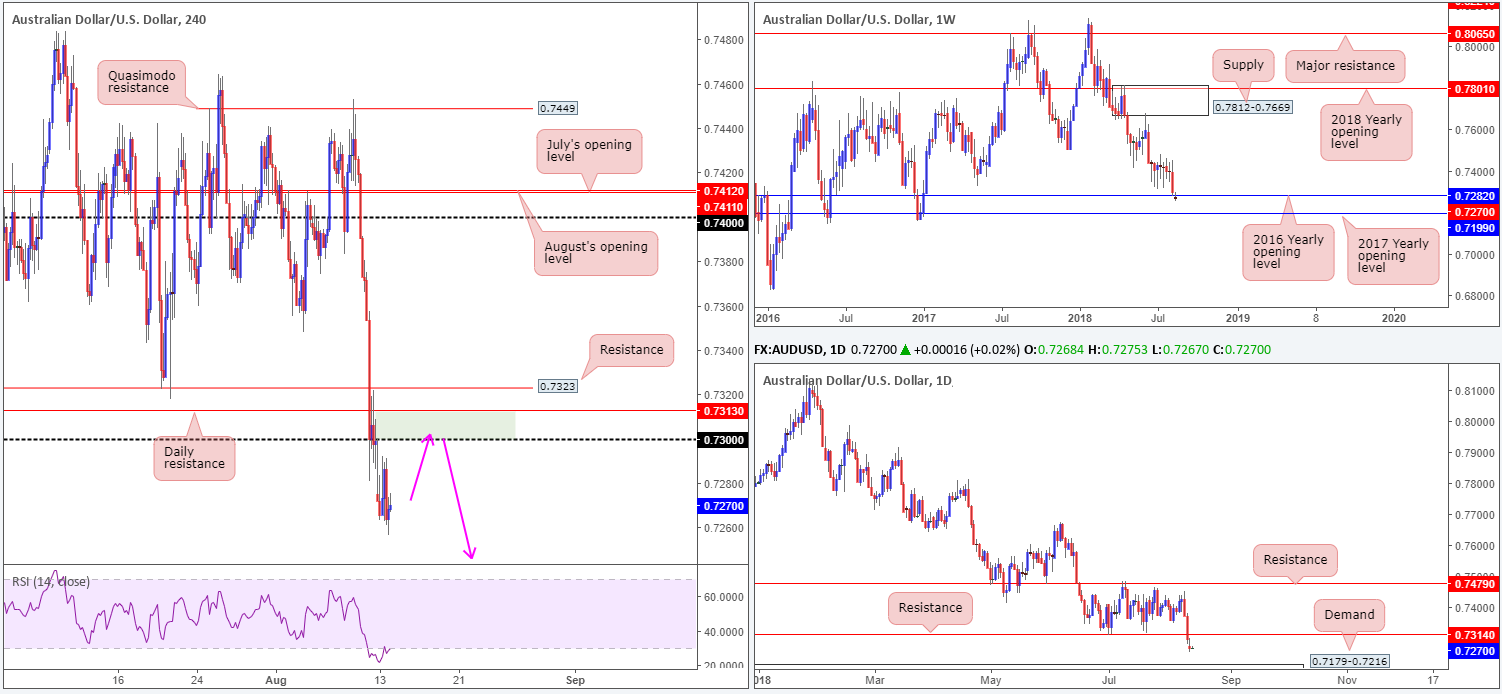
The Australian dollar witnessed limited momentum in Monday’s trading, though did manage to dip to fresh lows of 0.7256. The 0.73 handle plotted on the H4 timeframe continues to be central resistance on this scale, while to the downside, price shows room to stretch as far south as demand at 0.7215-0.7240 (not visible on the screen).
The 2016 yearly opening level seen on the weekly timeframe at 0.7282 has thus far been ignored. Continued selling beneath this base has the 2017 yearly opening level at 0.7199 to target. The story on the daily timeframe shows support at 0.7314 was taken out last week (now acting resistance), opening the window to further selling. Assuming sellers remain defensive, demand at 0.7179-0.7216 is likely the next support target on the radar (the 2017 yearly opening level mentioned above on the weekly timeframe at 0.7199 is housed within this demand).
Areas of consideration:
In a nutshell, all three timeframes point to further downside right now. As such, shorting opportunities from the H4 grey zone at 0.7313/0.73 (daily resistance and round number) could be an option today, targeting the H4 demand mentioned above at 0.7215-0.7240 (glued to the top edge of daily demand mentioned above at 0.7179-0.7216).
Today’s data points: AUD NAB business confidence; China fixed asset investment ytd/y and industrial production y/y.
USD/JPY:
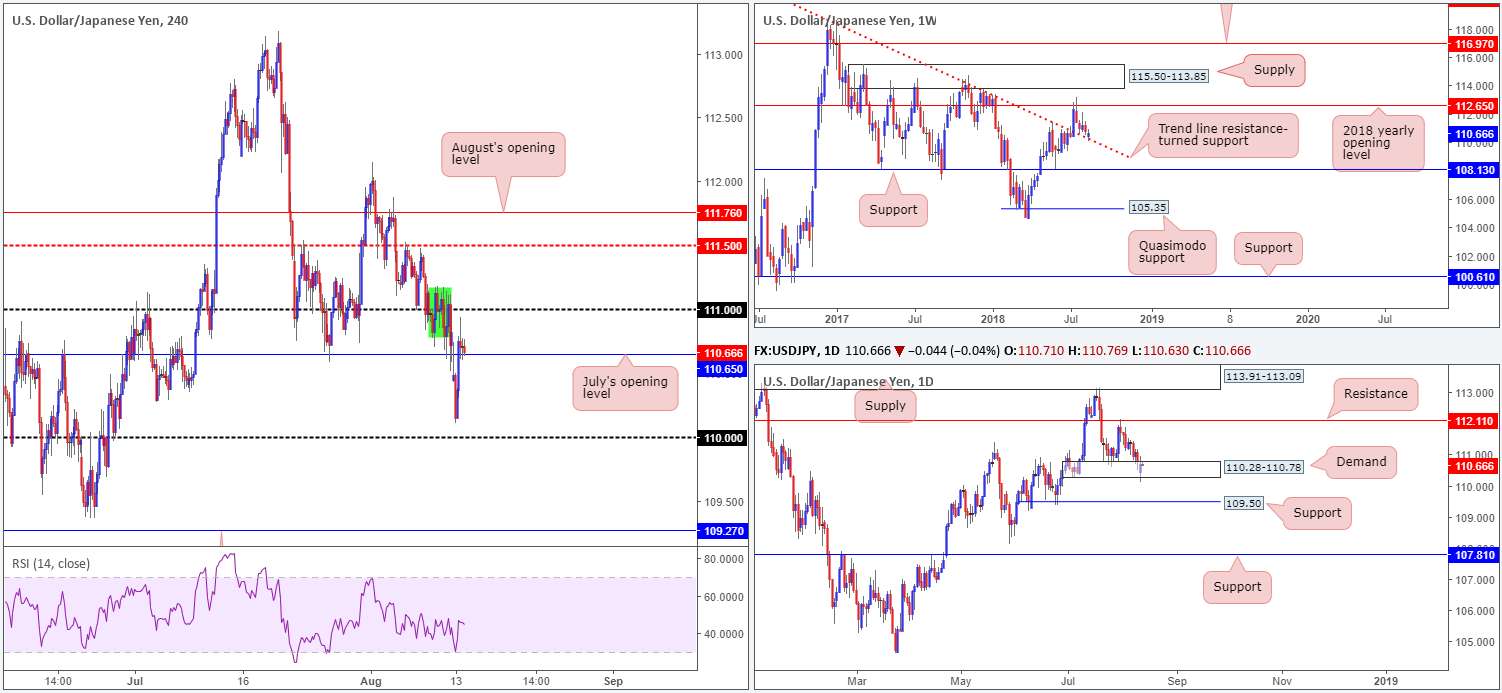
The Japanese yen began the week on a strong footing, forcing the USD/JPY to lows of 110.11, just north of the 110 handle seen on the H4 timeframe. During European hours, however, traders witnessed an advance from the said lows and an eventual close above July’s opening level at 110.65, which, as you can see, is currently being retested as support.
Upside from 110.65, however, appears somewhat limited given the thick consolidation seen marked in green around the 111 handle. Bolstering a move higher, nonetheless, is the weekly timeframe. Weekly movement recently crossed swords with a trend line resistance-turned support (taken from the high 123.57). Having seen the current trend line hold firm as resistance on a number of occasions in the past, it’s likely to remain a defensive barrier going forward. Further buying from current price has the 2018 yearly opening level at 112.65 to target. In terms of daily activity, demand at 110.28-110.78 suffered a minor breach to the downside (stop-loss orders potentially tripped as a result of this move) yesterday, though has managed to remain intact.
Areas of consideration:
Although weekly price suggests the bulls are fighting fit, the recent break of daily demand, along with nearby structure surrounding the 111 handle on the H4 timeframe, are strong competing themes. To verify bullish intent, the team has noted to wait and see if H4 price can close above 111. A retest of this level as support in the shape of a full or near-full-bodied H4 bull candle would likely be enough evidence to initiate longs, with an ultimate take-profit target set at the 2018 yearly opening level mentioned above on the weekly timeframe at 112.65.
Today’s data points: Limited.
USD/CAD:
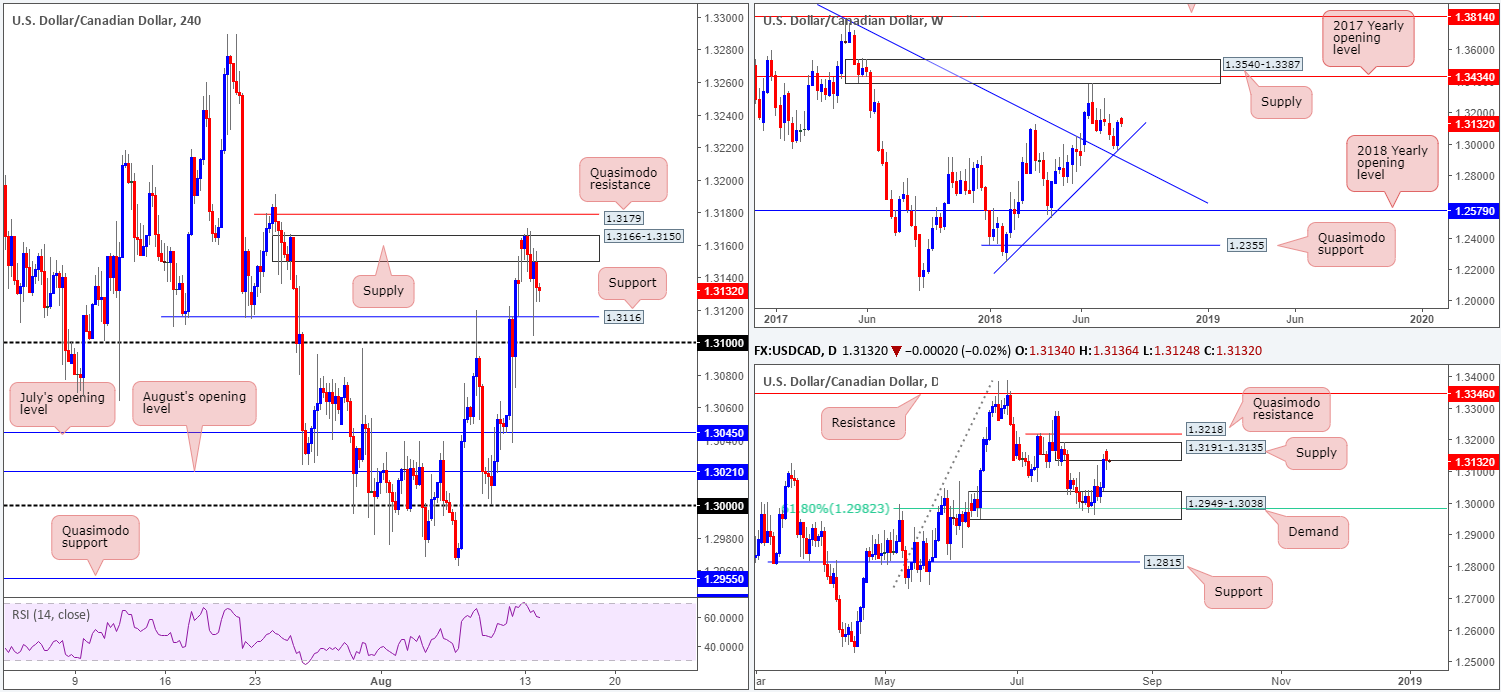
The USD/CAD, as you can see, gapped higher to begin the week, though failed to generate much follow-through movement. H4 supply at 1.3166-1.3150 witnessed a minor breach to highs of 1.3170 amid London hours, before collapsing lower during US trade and challenging H4 support at 1.3116.
Daily supply at 1.3191-1.3135 (encases the current H4 supply area) remains intact. Further selling interest from here has the daily demand at 1.2949-1.3038 to target, which happens to intersect with a 61.8% Fib support value at 1.2982. In the event buyers enter the fight, nevertheless, keep eyeballs on the Quasimodo resistance seen at 1.3218.
Over on the weekly timeframe, however, last week’s trade printed a bullish engulfing candle of note off trend line support (drawn from the low 1.2247).
Areas of consideration:
Traders looking to initiate long positions based on the recently formed weekly bullish engulfing candle entails buying into daily supply mentioned above at 1.3191-1.3135! While we’re aware weekly flows generally take precedence over daily movement, the daily supply is fresh and is not likely to give up without a fight. Therefore, this is not considered the best time to enter long off the weekly pattern, according to technical structure.
H4 structure is also incredibly cramped at the moment. To the downside we have support at 1.3116, followed by the 1.31 handle, while to the upside, the recently engulfed supply at 1.3166-1.3150, is shadowed closely by Quasimodo resistance at 1.3179.
Based on the above reading, neither a long nor short seems attractive right now.
Today’s data points: Limited.
USD/CHF:
USD/CHF movement was rather lackluster on Monday, amid a lack of fundamental drivers. In light of this, our outlook for this market remains unchanged.
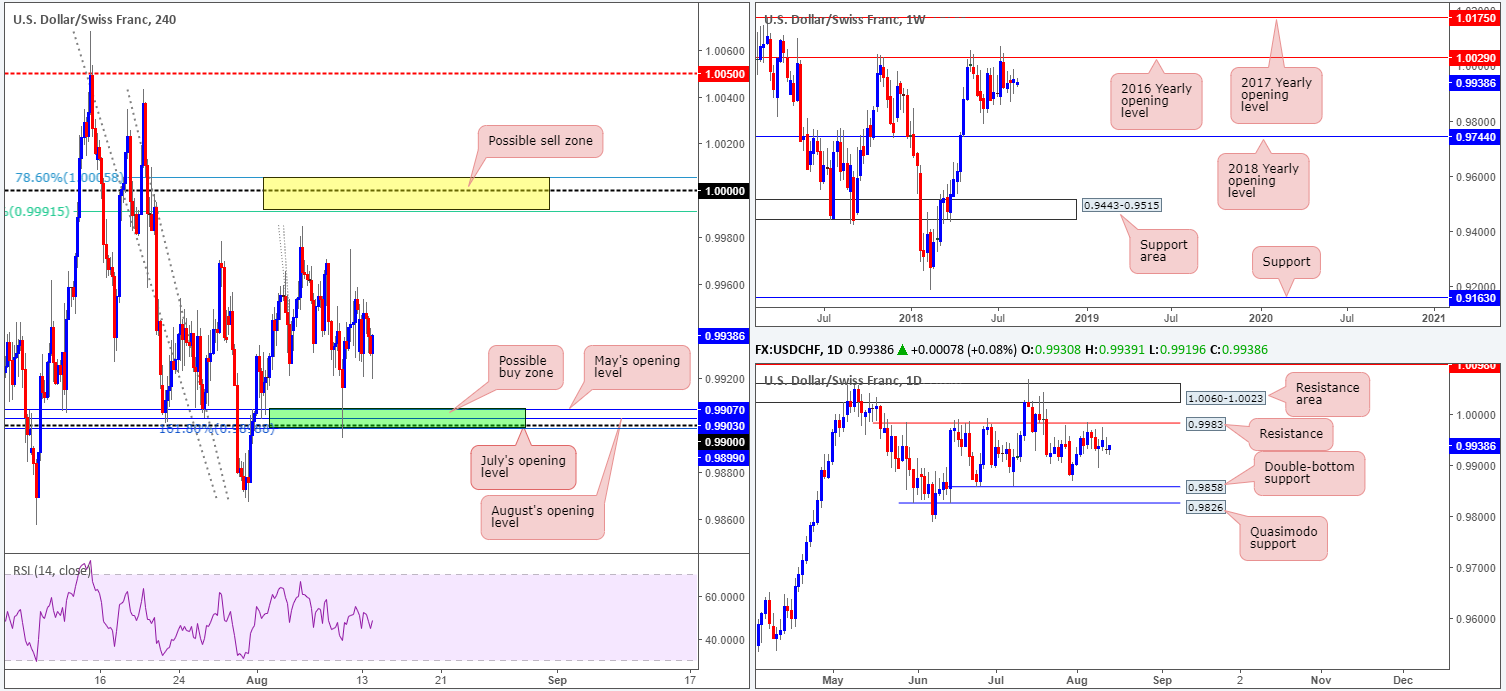
As can be seen on the weekly timeframe, price action penciled in a clear-cut indecision candle last week as the piece consolidates just south of a key resistance at 1.0029: the 2016 yearly opening level. Holding price lower on two occasions in 2017, and twice already in 2018, this level commands attention! Downside supports to keep eyeballs on from here fall in at June’s low 0.9788, followed by the 2018 yearly opening level at 0.9744.
Daily resistance at 0.9983, as is evident from the chart, continues to cap upside at the moment. In the event of a break north, nonetheless, the resistance area planted at 1.0060-1.0023 (holds the 2016 yearly opening level at 1.0029 mentioned on the weekly timeframe) is likely the next base in the firing range. A move lower from current price, on the other hand, has 0.9858 in view: a double-bottom support, shadowed closely by Quasimodo support at 0.9826.
In terms of H4 structure, the team has noted to keep crosshairs fixed on two areas this week for potential trading opportunities:
- A possible buy zone marked in green at 0.9899/0.9907 (comprised of July’s opening level at 0.9899, a 161.8% Fib ext. point at 0.9899 [taken from the high 0.9984], the 0.99 handle, August’s opening level at 0.9903 and May’s opening level at 0.9907).
- The next area of interest can be seen at parity (1.0000). Note surrounding this widely watched number are two Fibonacci resistances: 78.6% at 1.0005 and 61.8% at 0.9991 (yellow zone).
Areas of consideration:
Traders are urged to wait for additional H4 candle confirmation at both the above said areas prior to pulling the trigger, preferably in the shape of a full or near-full-bodied candle. The reason being is round numbers (1.0000 and 0.99) tend to attract ‘stop runs’ (fakeouts). There’s little worse than having your stop-loss order triggered by a hair only to watch price shortly after hit your take-profit area!
Today’s data points: Limited.
Dow Jones Industrial Average:
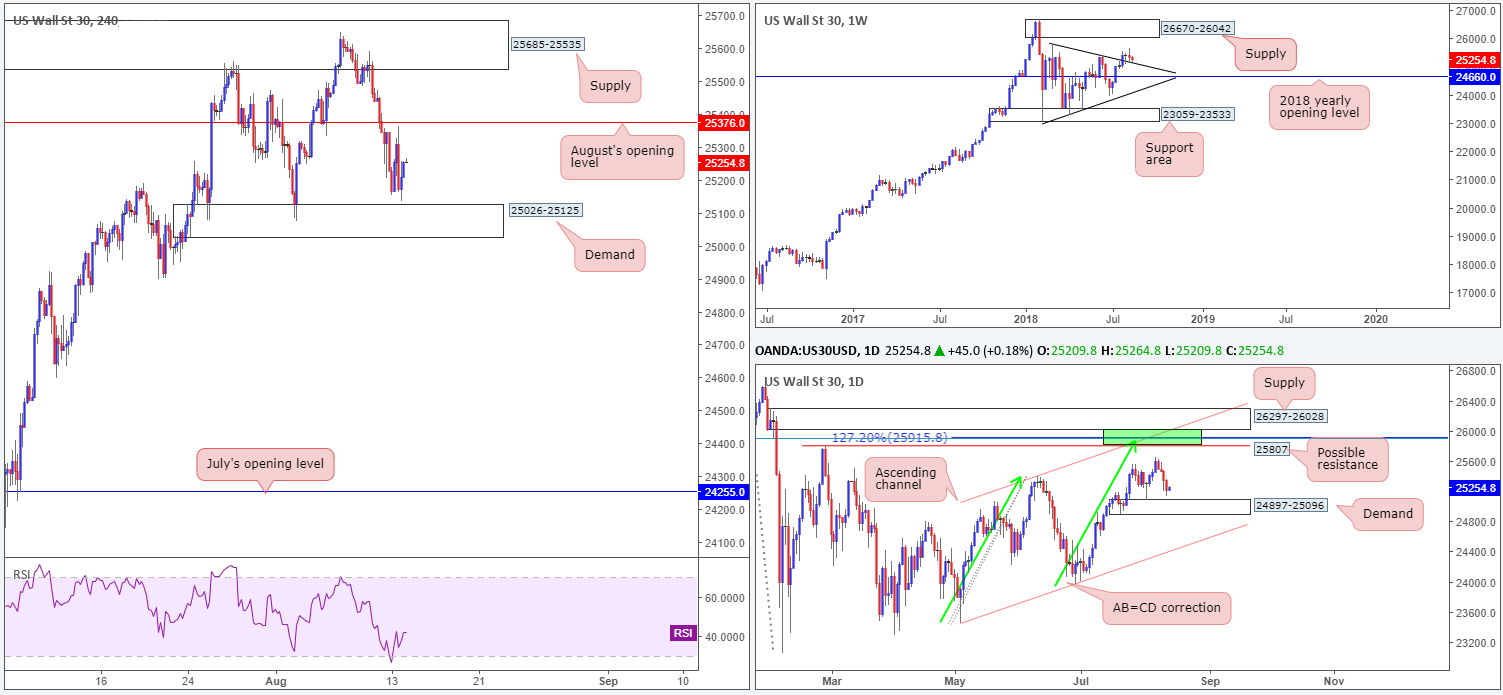
Recording its fourth consecutive daily loss on Monday, weighed on by the Turkish lira’s (TRY) collapse and its ripple effects on major global stock markets, the index observed a retest of a weekly trend line resistance-turned support (etched from the high 25807).
In conjunction with weekly action, daily movement shows nearby demand at 24897-25096 now within striking distance. Also of interest is the H4 demand base coming in at 25026-25125 seen glued to the top edge of the said daily demand area. Note this area has managed to hold this market higher twice already – will history repeat itself here?
Areas of consideration:
The H4 demand base mentioned above at 25026-25125 will likely be on the radar for the majority of short/medium-term traders this morning. Aggressive traders may look to enter at market around the top edge of this zone with stops planted a few points beneath the area. Conservative traders, on the other hand, might want to wait and see if H4 price can pencil in a full or near-full-bodied bull candle before pulling the trigger, since one can never be sure if daily price wants to test the lower edge of its demand at 24897-25096.
In the event a push above August’s opening level takes shape (next upside target on the H4 scale), without connecting with the noted H4 demand, traders can then expect follow-through buying towards H4 supply at 25685-25535. A retest of 25376 as support would, in our view, be enough evidence to suggest an intraday long position here.
Today’s data points: Limited.
XAU/USD (Gold)
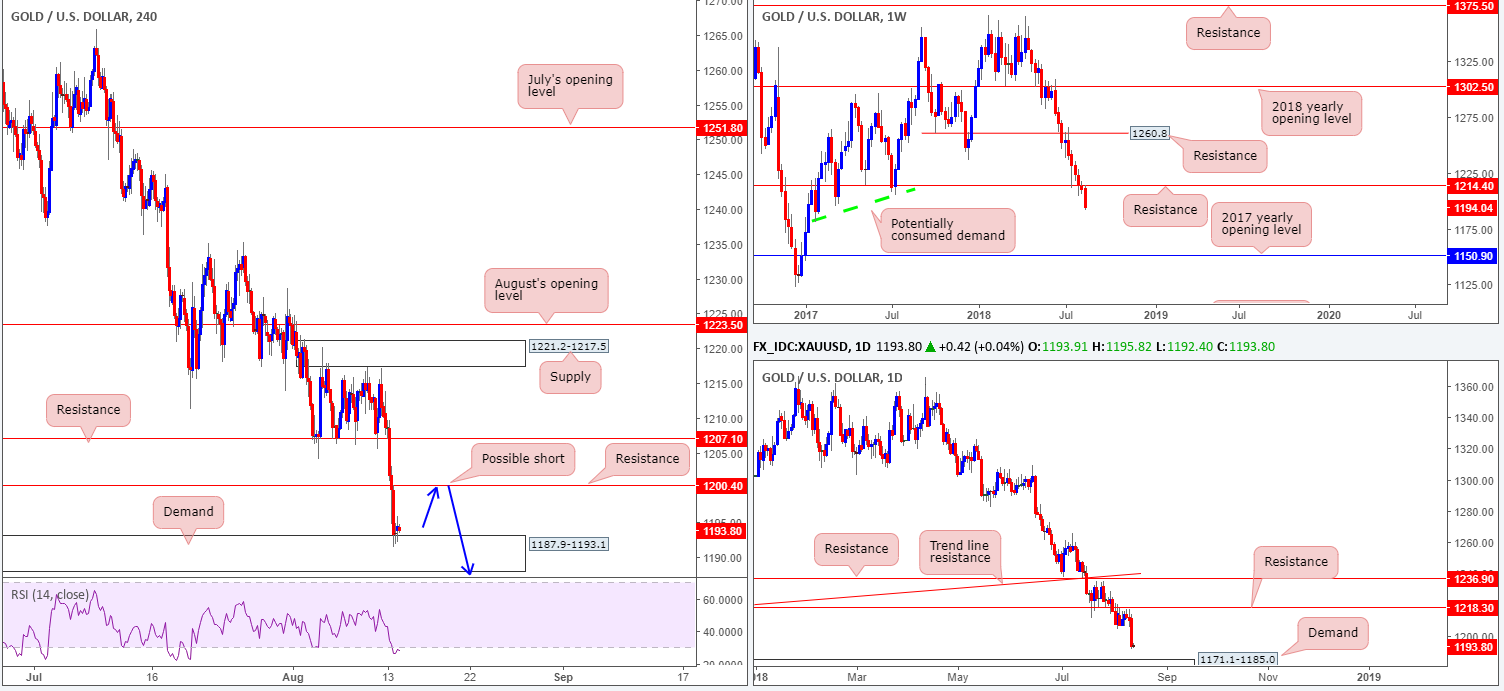
Despite a round of defensive longs off H4 support at 1207.1, the yellow metal went back to playing on the back foot on Monday, clocking its lowest level since January 2017 at 1191.8. Not only did H4 price rip through orders at support drawn from 1207.1, bullion also attacked and engulfed support at 1200.4 (both levels now acting resistances), consequently clearing the path south for a test of demand at 1187.9-1193.1 (shadowed closely by a Quasimodo support at 1184.3).
Meanwhile, weekly movement is seen emphasizing a strong bearish tone beneath resistance at 1214.4. The possibility of further selling as far south as the 2017 yearly opening level at 1150.9 is certainly there, as there’s limited active demand seen to the left of current price. While weekly price eyes lower levels, however, daily activity appears poised to shake hands with nearby demand plotted at 1171.1-1185.0.
Areas of consideration:
A long from the current H4 demand area has a number of competing themes to contend with: the daily demand area mentioned above at 1171.1-1185.0 lurking just beneath it and weekly flow portending lower prices. Therefore, a buy from the H4 zone is considered low probability, with the most expected out of a move from here is resistance at 1200.4.
The only level that really stands out at the moment is a short from H4 resistance at 1200.4. On the assumption H4 demand is fragile, and higher-timeframe direction pointing in a southerly direction, a short from here has healthy odds (blue arrows), targeting the top edge of daily demand at 1185.0.
The use of the site is agreement that the site is for informational and educational purposes only and does not constitute advice in any form in the furtherance of any trade or trading decisions.
The accuracy, completeness and timeliness of the information contained on this site cannot be guaranteed. IC Markets does not warranty, guarantee or make any representations, or assume any liability with regard to financial results based on the use of the information in the site.
News, views, opinions, recommendations and other information obtained from sources outside of www.icmarkets.com.au, used in this site are believed to be reliable, but we cannot guarantee their accuracy or completeness. All such information is subject to change at any time without notice. IC Markets assumes no responsibility for the content of any linked site. The fact that such links may exist does not indicate approval or endorsement of any material contained on any linked site.
IC Markets is not liable for any harm caused by the transmission, through accessing the services or information on this site, of a computer virus, or other computer code or programming device that might be used to access, delete, damage, disable, disrupt or otherwise impede in any manner, the operation of the site or of any user’s software, hardware, data or property.


