
Waiting for lower timeframe confirmation is our main tool to confirm strength within higher timeframe zones, and has really been the key to our trading success. It takes a little time to understand the subtle nuances, however, as each trade is never the same, but once you master the rhythm so to speak, you will be saved from countless unnecessary losing trades. The following is a list of what we look for:
- A break/retest of supply or demand dependent on which way you’re trading.
- A trendline break/retest.
- Buying/selling tails/wicks – essentially we look for a cluster of very obvious spikes off of lower timeframe support and resistance levels within the higher timeframe zone.
We typically search for lower-timeframe confirmation between the M15 and H1 timeframes, since most of our higher-timeframe areas begin with the H4. Stops are usually placed 1-3 pips beyond confirming structures.
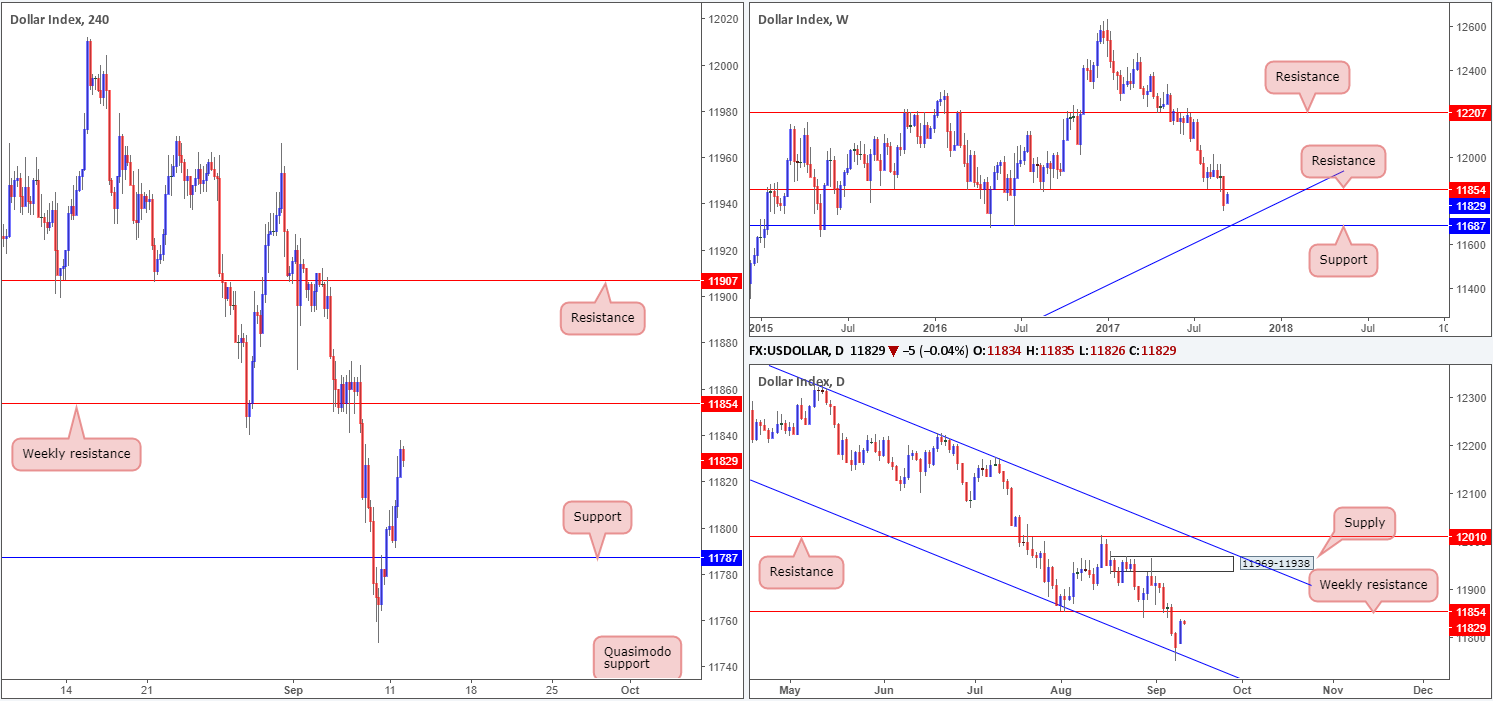
US dollar index (USDX):
EUR/USD:
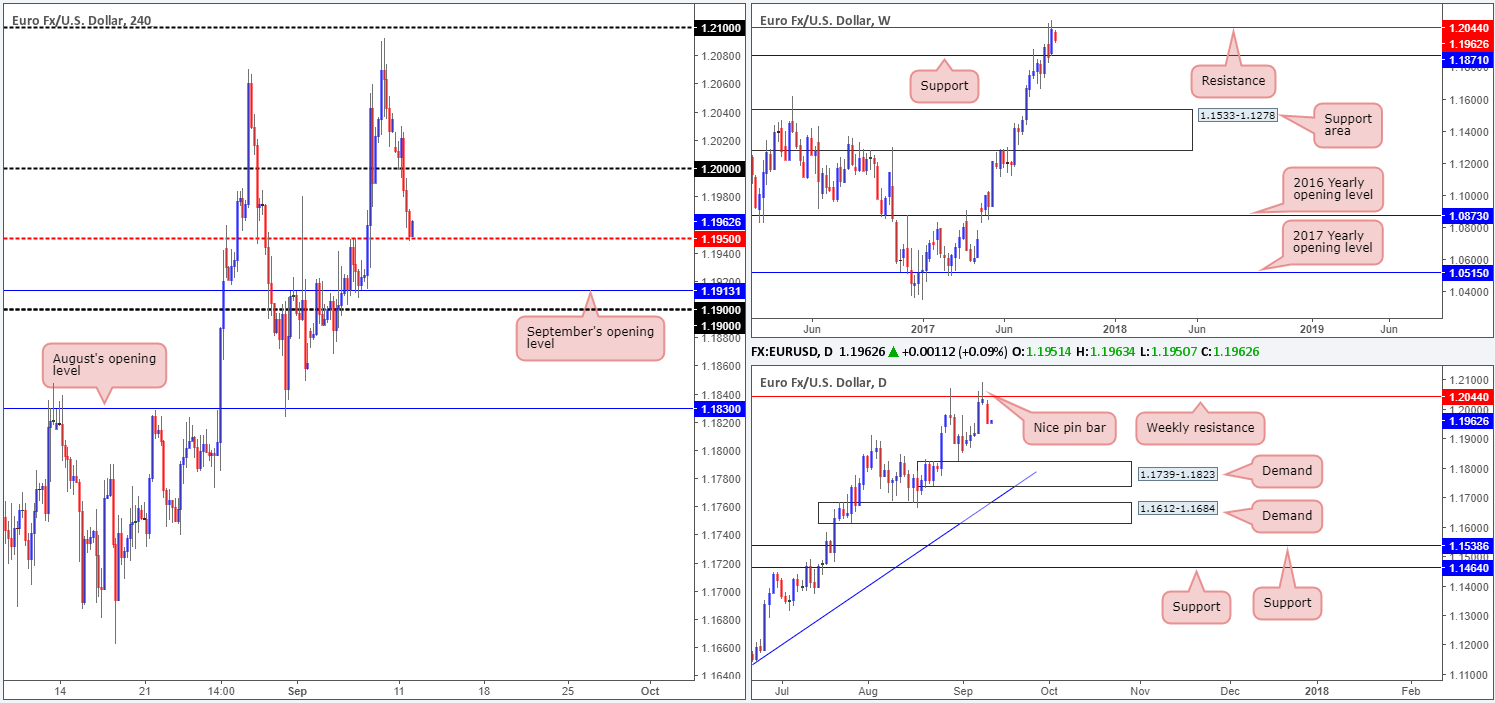
Despite a moderate bounce seen from the large psychological level 1.20 in early London on Monday, the shared currency spent the remainder of the day under pressure. Consequent to a strong dollar advance, the pair concluded the day shaking hands with a H4 mid-level support at 1.1950.
Yesterday’s downside push was also likely influenced by the current weekly resistance in play at 1.2044 and Friday’s closing bearish pin bar. Should price continue to fall from here, the next support target in the firing range can be seen on the weekly timeframe at 1.1871, followed closely by daily demand plotted at 1.1739-1.1823.
Suggestions: With the bigger picture suggesting that further selling could be seen down to at least the 1.1871 mark, a short beyond 1.1950 could be an option today. In addition to this, we also see that the USDX shows room for the currency to appreciate up to as far as the weekly resistance at 11854, thus further bolstering EUR sellers.
A H4 close beyond 1.1950, along with a retest and a lower-timeframe confirming sell signal (see the top of this report for information on how to use lower-timeframe structure) would, in our view, be enough to warrant a sell trade here. Nevertheless, do make sure that you monitor the trade since H4 price may stall at September’s opening line drawn from 1.1913/1.19 handle.
Data points to consider: No high-impacting news events scheduled for release today.
Levels to watch/live orders:
- Buys: Flat (stop loss: N/A).
- Sells: Watch for H4 price to engulf 1.1950 and then look to trade any retest seen thereafter ([waiting for a lower-timeframe sell signal to present itself following the retest is advisable] stop loss: dependent on where one confirms the number).
GBP/USD:
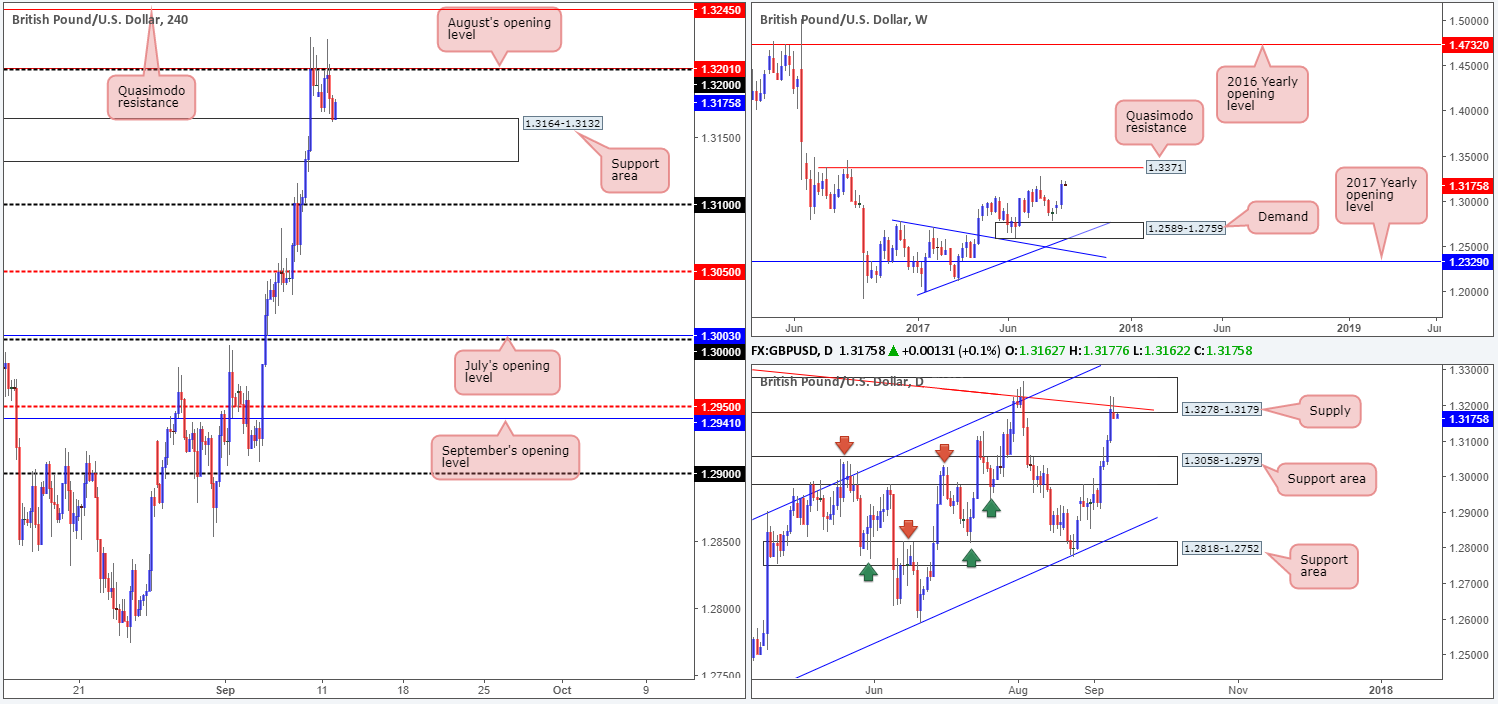
As can be seen from the H4 chart, the British pound was unable to muster enough strength to close beyond the 1.32 handle on Monday, despite an earnest attempt from the bulls during London. The move brought the candles down to a nearby support area placed at 1.3164-1.3132, which, as you can see, is currently reinforcing the unit at the moment.
Weekly price, in our view, maintains a bullish view due to room being seen for the pair to rally up to as far as the Quasimodo resistance level at 1.3371. On the other side of the coin, however, daily action is seen crossing swords with supply at 1.3278-1.3179 (boasts a nice-looking trendline resistance taken from the high 1.3480). Also noteworthy is the USDX shows room for the currency to advance up to the weekly resistance at 11854.
Suggestions: With weekly price showing gains could be on the horizon, daily price trading at supply and H4 action showing interest from a support area, where does one step from here?
Well, a buy in this market will, of course, place you against daily flow. However, another cautionary point to consider is how close the 1.32 handle is positioned. Shorts, from our perspective, are just as challenging. Not only do you have the current H4 support area in view, but you may also be selling into potential weekly flow.
Given the above notes, the desk has opted to remain on the sidelines for the time being.
Data points to consider: UK Inflation figures at 9.30am GMT+1.
Levels to watch/live orders:
- Buys: Flat (stop loss: N/A).
- Sells: Flat (stop loss: N/A).
AUD/USD:
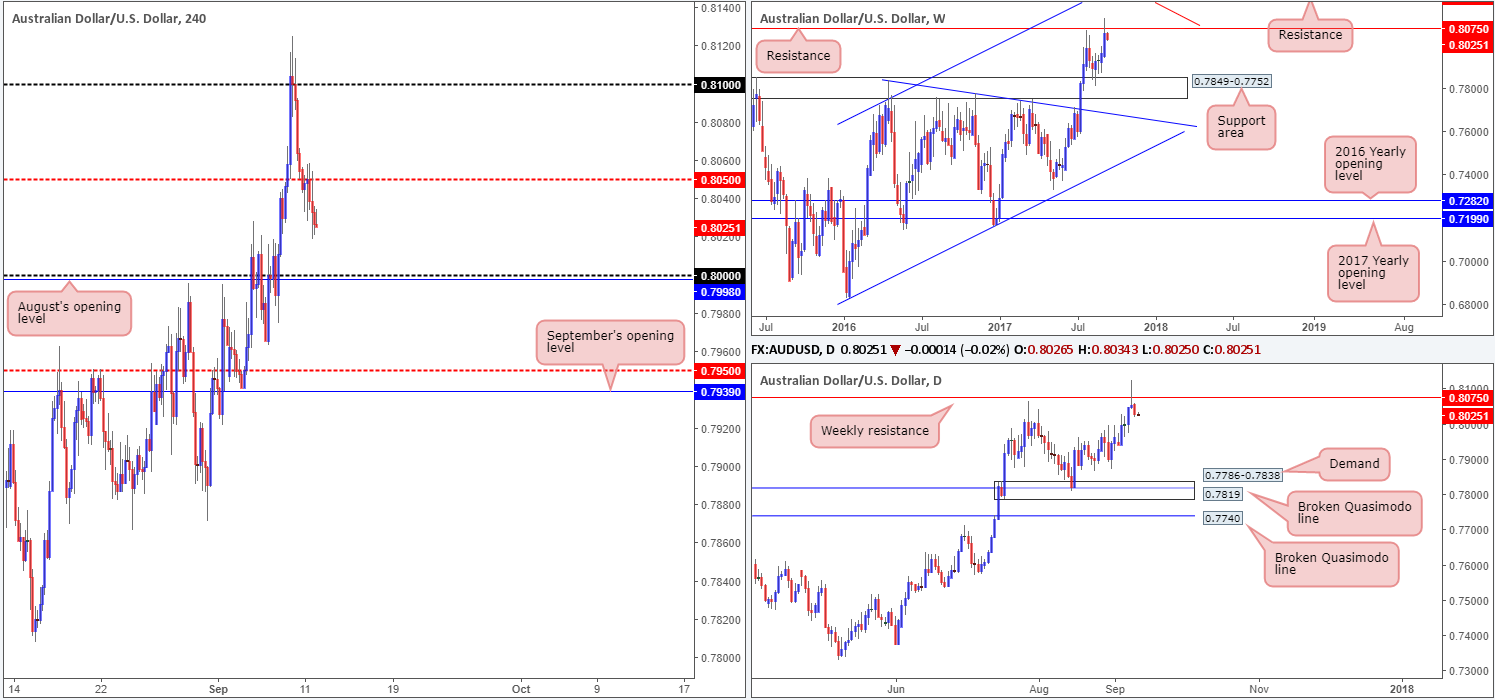
Using a top-down approach this morning, we can see weekly price beginning to ease from resistance plotted at 0.8075. Providing that the bears remain in the driving seat here, the next downside target in view is the support area positioned at 0.7849-0.7752. On top of this, traders may have also noticed that Friday’s trade chalked up a nice-looking bearish pin bar from the noted weekly resistance. To our way of seeing things, downside looks relatively cramped on the daily scale with little clear demand seen until we revisit the 0.7786-0.7838 area.
For those who read Monday’s report you may recall us mentioning that if the H4 mid-level support at 0.8050 was consumed, coupled with a retest and a reasonably sized H4 bearish candle in the shape of a full, or near-full-bodied formation, we would look to sell. With the setup coming to fruition yesterday, we took a short trade from 0.8038 and placed a stop at 0.8060 (two pips above the rejection candle’s wick).
Suggestions: For traders who also managed to short this market, we’ll be looking to take partial profits around the key 0.80 level/August’s opening line at 0.7998. Beyond here, the H4 mid-level support at 0.7950 looks attractive, followed closely by September’s opening level at 0.7939.
Data points to consider: No high-impacting news events scheduled for release today.
Levels to watch/live orders:
- Buys: Flat (stop loss: N/A).
- Sells: 0.8038 ([live] stop loss: 0.8060).
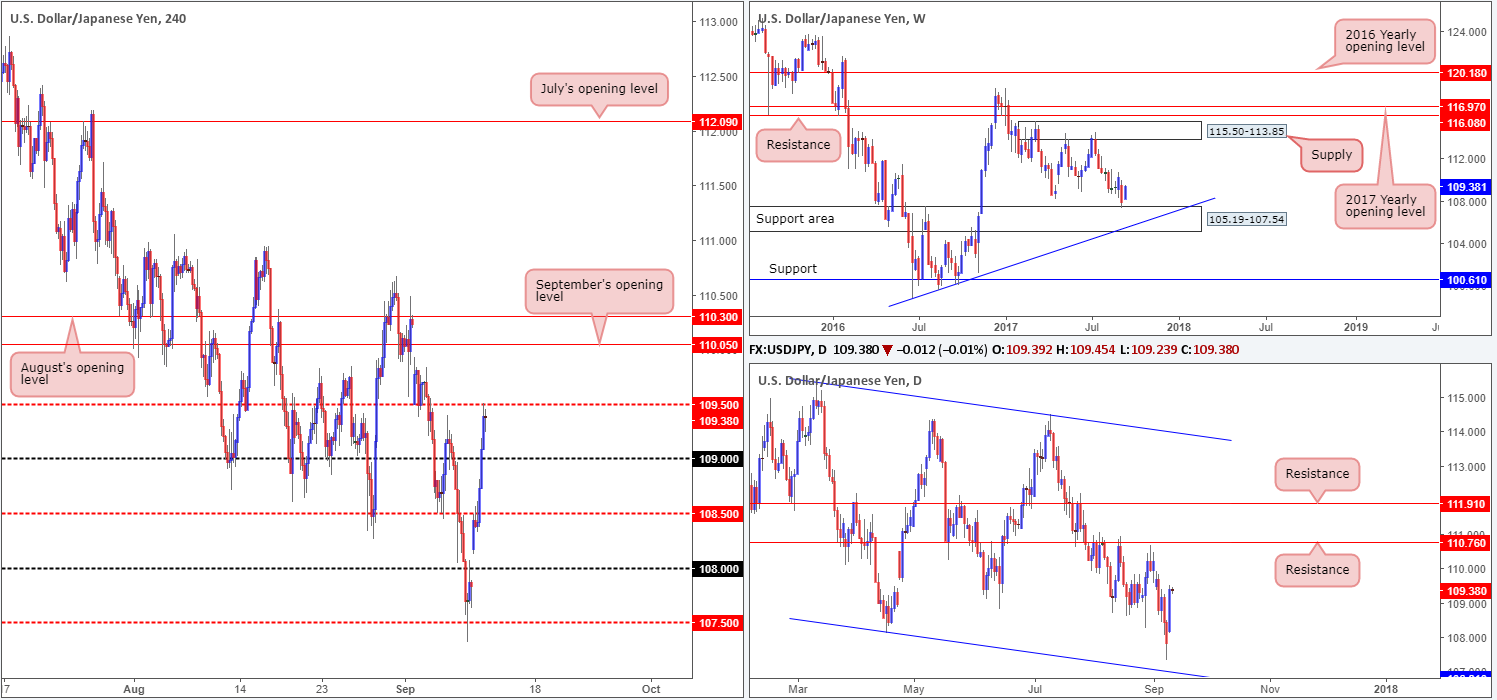
USD/JPY:
Leaving the weekend gap unfilled, recent action shows the USD/JPY extended Friday’s bounce from the H4 mid-level support at 107.50 on Monday. Taking out both H4 mid-level resistance at 108.50 and the 109 handle, price was able to connect with the H4 mid-level resistance at 109.50 by the day’s end.
According to the USDX charts, the currency has room to advance up to as far as weekly resistance pegged at 11854. Similarly, both the weekly and daily charts on the USD/JPY also show room for further upside. Weekly action is currently trading from a support area at 105.19-107.54, with room to rally north as far as supply coming in at 115.50-113.85. On the daily timeframe, however, the next upside hurdle is seen at 110.76 (a resistance level).
Suggestions: We see two possible scenarios playing out today:
1. A close above 109.50. This – coupled with a retest and a lower-timeframe buy signal could provide one entry into the market (see the top of this report for information on how to use structure on the lower timeframes for entry), targeting September’s opening line at 110.05, followed closely by August’s opening level at 110.30.
2. A retest of the 109 handle. Similar to option 1, could also be an option should this retest be accompanied by a lower-timeframe buy signal, targeting 109.50 as an initial take-profit zone.
Data points to consider: No high-impacting news events scheduled for release today.
Levels to watch/live orders:
- Buys: Watch for price to engulf 109.50 and then look to trade any retest seen thereafter ([waiting for a lower-timeframe confirming signal to form following the retest is advised] stop loss: dependent on where one confirms this number). 109 region ([waiting for a lower-timeframe confirming signal to form is advised] stop loss: dependent on where one confirms this number).
- Sells: Flat (stop loss: N/A).
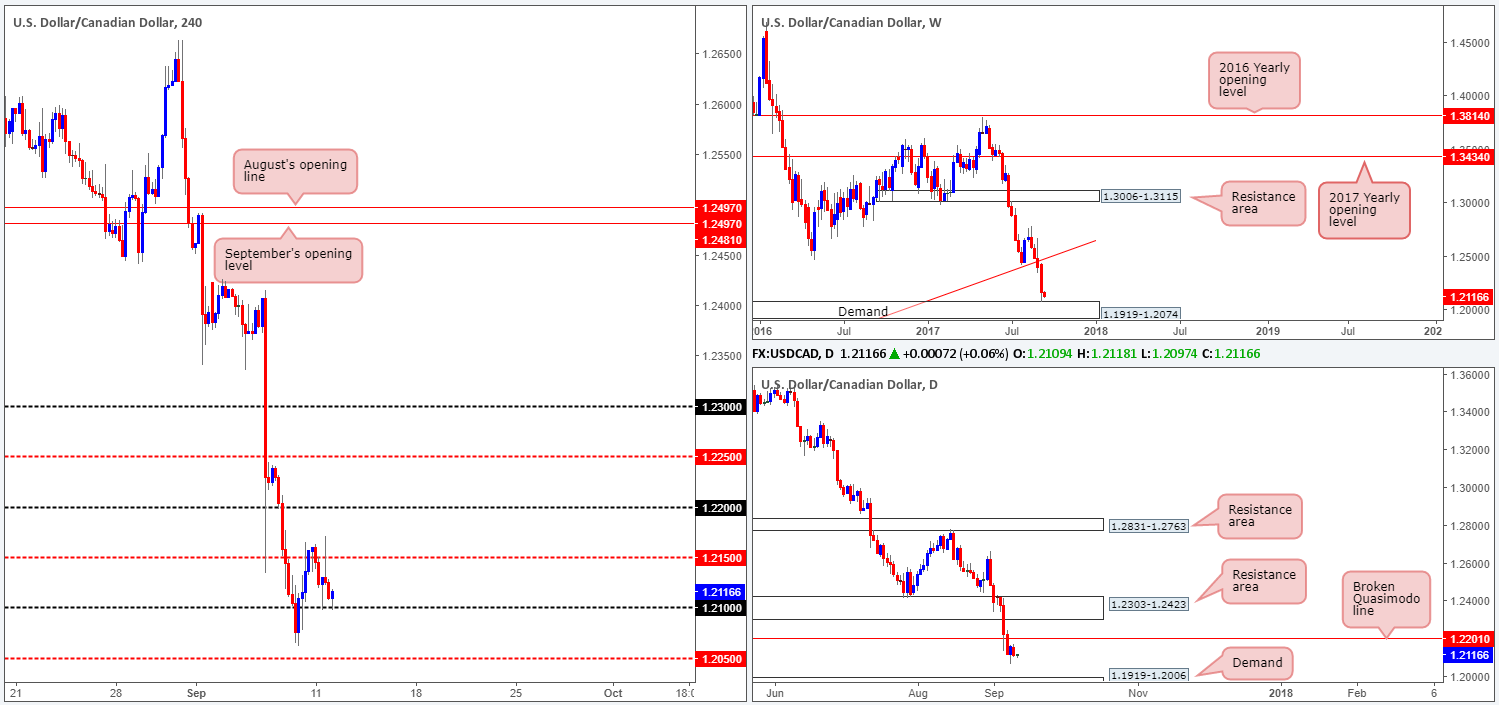
USD/CAD:
Although weekly activity recently clashed with demand at 1.1919-1.2074, there has been little bullish intent registered from here. Technically speaking, this likely has something to do with H4 candles failing to muster enough strength to take out the mid-level resistance at 1.2150. However, even if H4 price manages to hold above 1.2150, the path north is still paved with obstacles.
Not only do we have a weekly resistance plotted on the USDX weekly chart at 11854, we also see a nearby daily broken Quasimodo line at 1.2201 on the loonie chart, followed closely by a resistance area at 1.2303-1.2423. Couple this with a strong down trending market, and buys no longer appear as attractive as they initially did from the weekly chart!
Suggestions: Despite weekly demand in play, we are not looking to become buyers in this market right now. A decisive close below 1.21 could, therefore, open the trapdoor down to H4 mid-level support at 1.2050, shadowed closely by the top edge of daily demand at 1.1919-1.2006.
Data points to consider: No high-impacting news events scheduled for release today.
Levels to watch/live orders:
- Buys: Flat (stop loss: N/A).
- Sells: Watch for H4 price to engulf 1.21 and then look to trade any retest seen thereafter ([waiting for a H4 bearish candle to form following the retest – preferably in the shape of a full, or near full-bodied candle – is advised] stop loss: ideally beyond the candle’s wick).
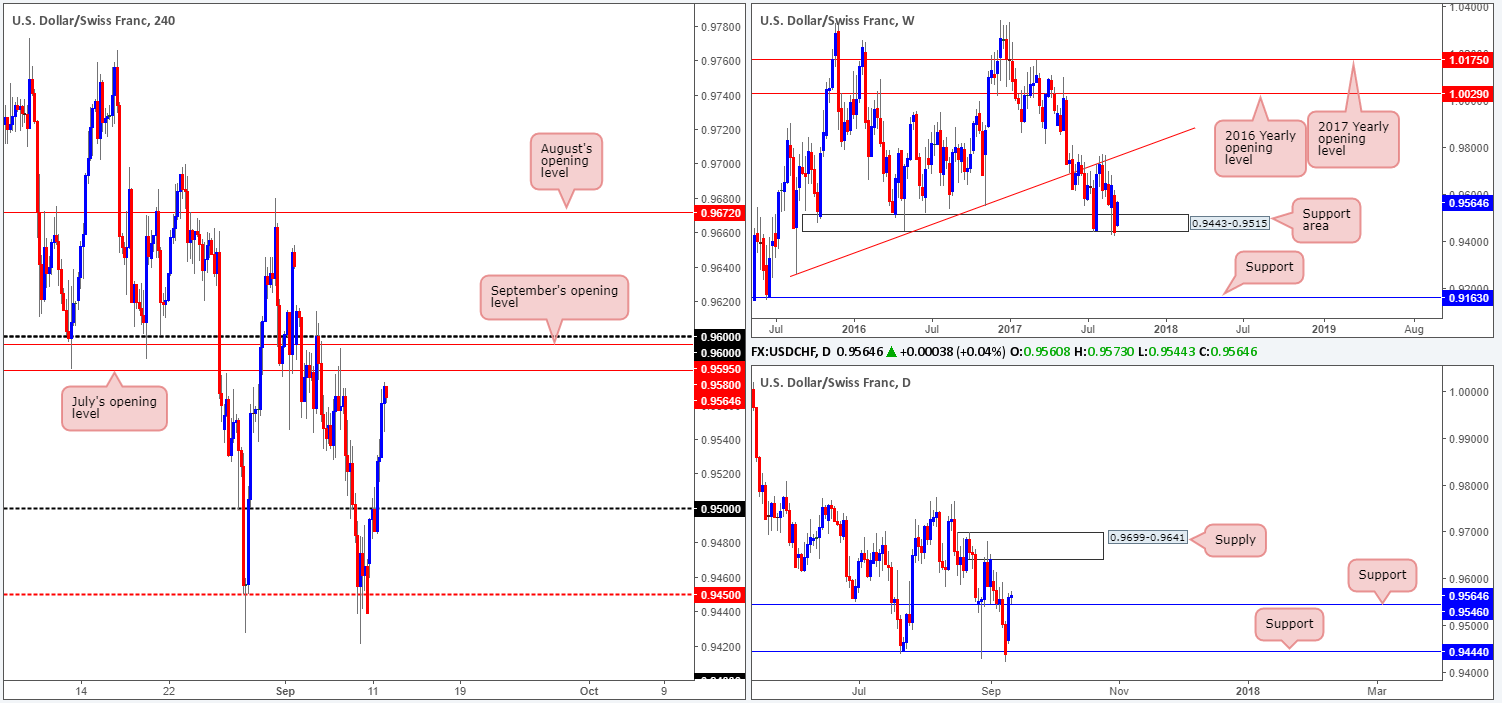
USD/CHF:
The USD/CHF maintained its bullish stance on Monday, consequently breaking through the 0.95 handle and closing the day just ahead of July’s opening level at 0.9580. Adding to that, the unit also crossed above daily resistance pegged at 0.9546 (now an acting support) and has possibly opened up the path north to supply drawn from 0.9699-0.9641. This – coupled with weekly price trading from a support area at 0.9443-0.9515, certainly places bulls in a favorable position this morning.
While we cannot deny the buyers do look in fine form at the moment, the bull run could be tested today as not only is there July’s opening level seen just ahead, there’s also September’s opening line at 0.9595, as well as the 0.96 handle!
Suggestions: Usually, we would simply wait for the buyers to close price above the noted H4 resistances, and then proceed to look for buys. However, 40 pips above 0.96 we have the lower edge of daily supply positioned at 0.9641! Therefore, to trade above 0.96, you would have to make sure that you have adequate risk/reward in place once price struck the 0.9640 mark. If not, it would not be a trade worth taking, in our humble opinion.
Data points to consider: No high-impacting news events scheduled for release today.
Levels to watch/live orders:
- Buys: Flat (stop loss: N/A).
- Sells: Flat (stop loss: N/A).
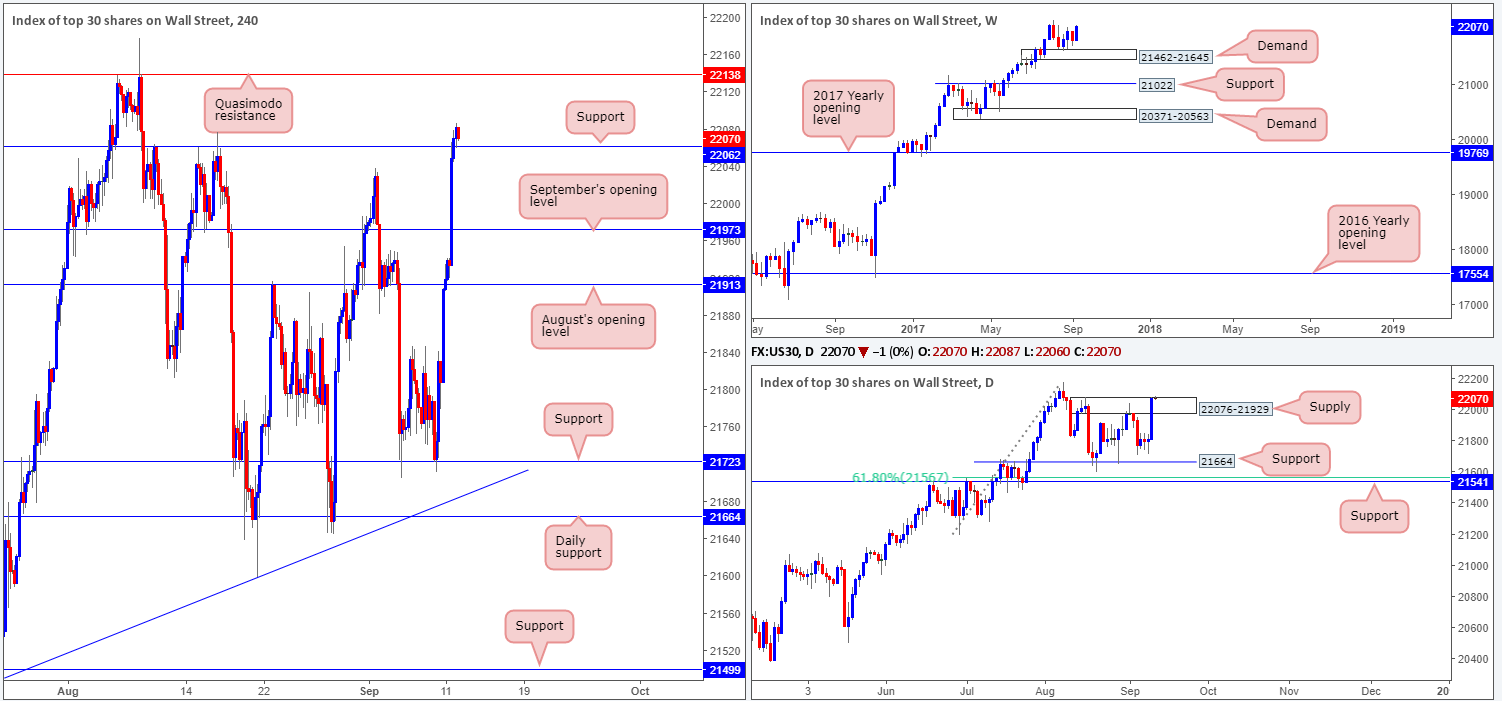
DOW 30:
Hurricane Irma threat has receded and caused less damage than anticipated, consequently lifting US equity prices higher on Monday. The index, as you can see, ran through both August and September’s opening levels at 21913/21973, as well as H4 resistance at 22062. What’s more, we also saw daily price close around the top edge of a daily supply base carved from 22076-21929. Up on the weekly timeframe, however, price remains afloat above demand at 21462-21645 with little overhead resistance to contend with.
Suggestions: Having seen price already respect the recently engulfed H4 resistance as support, along with both weekly and daily price looking as though they’ll both stretch further north, a long from this region is of interest this morning.
Ultimately, we’re looking for a second retest of the H4 support line along with a reasonably sized H4 bull candle. Assuming we see this take shape, a long position will be executed, targeting the H4 Quasimodo resistance at 22138 as an initial take-profit line.
Data points to consider: No high-impacting news events scheduled for release today.
Levels to watch/live orders:
· Buys: 22062 region ([waiting for a reasonably sized H4 bullish candle to form – preferably a full, or near-full-bodied candle – is advised] stop loss: ideally beyond the candle’s tail).
· Sells: Flat (stop loss: N/A).
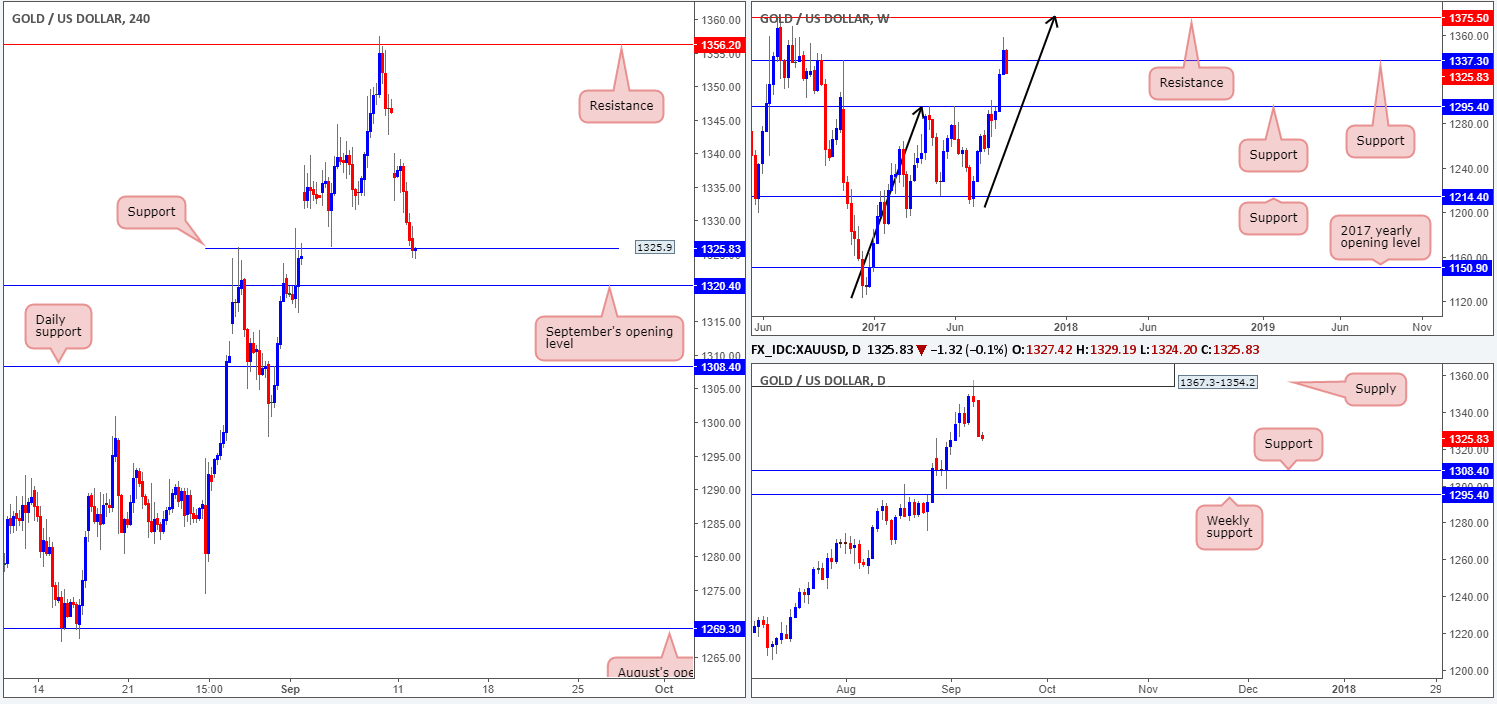
GOLD:
Following Monday’s somewhat aggressive opening gap, the metal entered into a temporary consolidation, before turning red and pushing down to H4 support pegged at 1325.9. Looking at how deep price has pressed below the support, our guess is the majority of stops have already been triggered, thus potentially opening the market up to a move down to September’s opening level at 1320.4.
Weekly price, as you can see, has crossed back below support at 1337.3 and may now be heading down to support coming in at 1295.4. Down on the daily timeframe, Friday’s rejection from supply at 1367.3-1354.2 saw strong sellers enter the market on Monday, placing support at 1308.4 in the firing range.
Suggestions: We really like the look of September’s opening line at 1320.4 as a possible buy zone today. This may seem a little risky given both weekly and daily timeframes show further downside could be on the cards. However, take a look at the USDX chart – price is nearing weekly resistance at 11854. A dollar move up to this weekly level could see the dollar collapse and therefore push the yellow metal higher!
Before a long can be considered from 1320.4, nevertheless, we would advise waiting for a lower-timeframe confirming signal to take shape (see the top of this report for information). This will help gauge whether buying pressure is present or not.
Levels to watch/live orders:
- · Buys: 1320.4 region ([waiting for a lower-timeframe confirming buy signal to form is advised] stop loss: dependent on where one confirms this area).
- · Sells: Flat (stop loss: N/A).


