
A note on lower-timeframe confirming price action…
Waiting for lower timeframe confirmation is our main tool to confirm strength within higher timeframe zones, and has really been the key to our trading success. It takes a little time to understand the subtle nuances, however, as each trade is never the same, but once you master the rhythm so to speak, you will be saved from countless unnecessary losing trades. The following is a list of what we look for:
- A break/retest of supply or demand dependent on which way you’re trading.
- A trendline break/retest.
- Buying/selling tails/wicks – essentially we look for a cluster of very obvious spikes off of lower timeframe support and resistance levels within the higher timeframe zone.
- Candlestick patterns. We tend to stick with pin bars and engulfing bars as these have proven to be the most effective.
We typically search for lower-timeframe confirmation between the M15 and H1 timeframes, since most of our higher-timeframe areas begin with the H4. Stops are usually placed 3-5 pips beyond confirming structures.
EUR/USD:
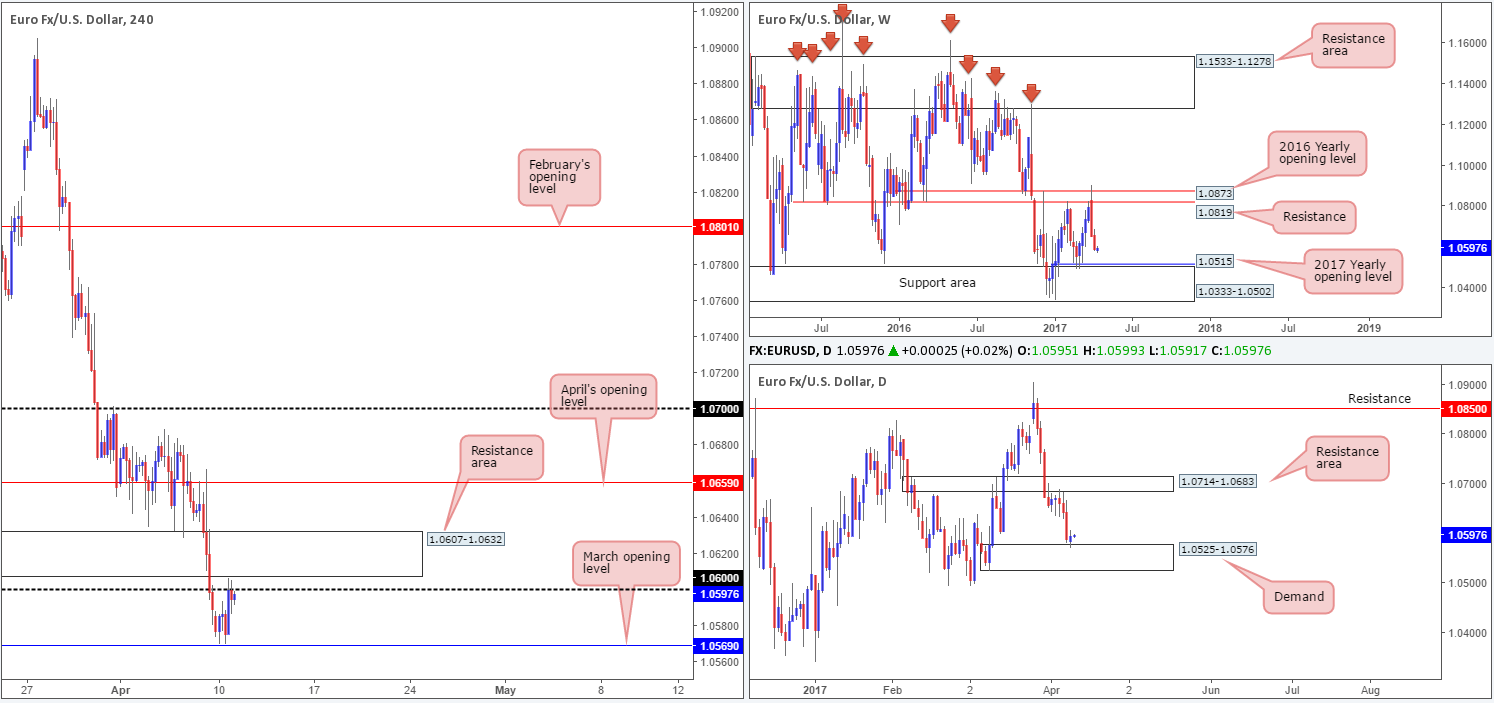
Going into the early hours of yesterday’s US segment, the shared currency managed to advance after coming within an inch of connecting with March’s opening level at 1.0569. However, despite an earnest attempt, the bulls struggled to surpass the nearby 1.06 handle (bolstered by a H4 resistance area at 1.0607-1.0632).
As highlighted in Monday’s report, weekly action shows price extended its pullback from the 2016 yearly opening level at 1.0873. According to this scale, there’s little support seen in this market until we reach the 2017 yearly opening level at 1.0515/support area at 1.0333-1.0502. The flipside, of course, is that daily movement recently checked in with demand coming in at 1.0525-1.0576, and indicates that the bulls have space to rally up to a resistance area pegged at 1.0714-1.0683.
Our suggestions: Since we know H4 price is trading beneath 1.06/resistance area at 1.0607-1.0632, and the weekly candles point to further selling, taking a long from the daily demand base at 1.0525-1.0576 is not something our desk is comfortable with. Yet, similarly, taking shorts from the 1.06 neighborhood is also not really a trade we would label high probability, due to March’s opening level at 1.0569 sitting only 30 pips away! It doesn’t exactly leave a lot of room to play with.
Data points to consider: German ZEW economic statement at 10am. FOMC member Kashkari speaks at 6.45pm GMT+1.
Levels to watch/live orders:
- Buys: Flat (stop loss: N/A).
- Sells: Flat (stop loss: N/A).
GBP/USD:
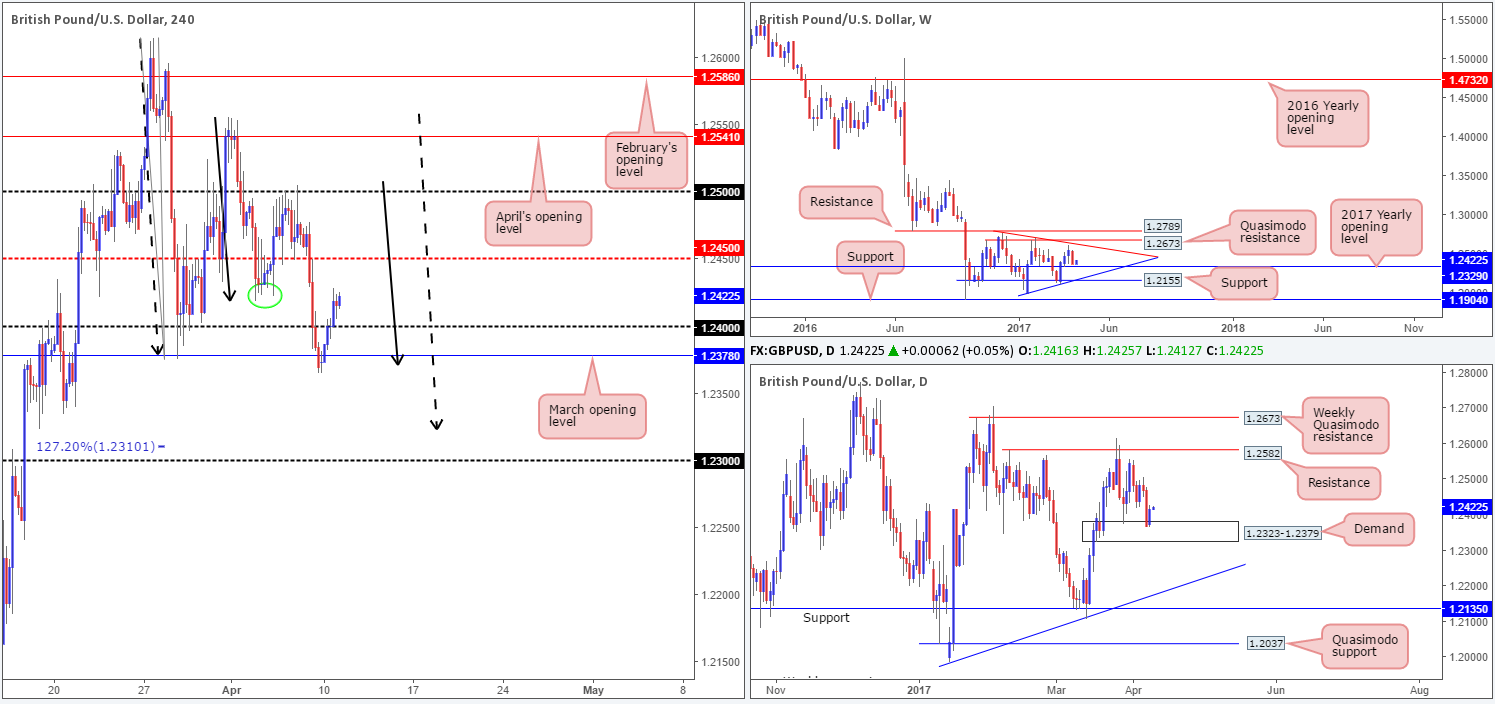
Strengthened by the daily demand at 1.2323-1.2379, the H4 symmetrical AB=CD (filled arrows) completion point taken from the high 1.2556 managed to hold firm, closing price back above March’s opening level at 1.2378 and the 1.24 handle. While we are expecting H4 flow to find some resistance around current price, due to immediate structure seen to the left marked with a green circle at the 1.2423ish range, both the weekly and daily charts show room to advance.
Our suggestions: Given the noted structure, longs from the 1.24 handle could be something to consider. Nevertheless, there is a strong possibility that H4 price could fakeout down to 1.2378, so avoid simply placing a pending buy order and hoping for the best! Instead, wait for price to connect with 1.24 and form a lower-timeframe confirming buy signal (see the top of this report). This will help with stop-loss placement and avoiding the dreaded fakeout. The Initial take-profit target from this region is the H4 mid-way resistance marked at 1.2450.
Data points to consider: UK inflation figures at 9.30am. FOMC member Kashkari speaks at 6.45pm GMT+1.
Levels to watch/live orders:
- Buys: 1.24 region ([waiting for a lower-timeframe confirming signal to form before pulling the trigger is advised] stop loss: dependent on where one confirms this area).
- Sells: Flat (stop loss: N/A).
AUD/USD:
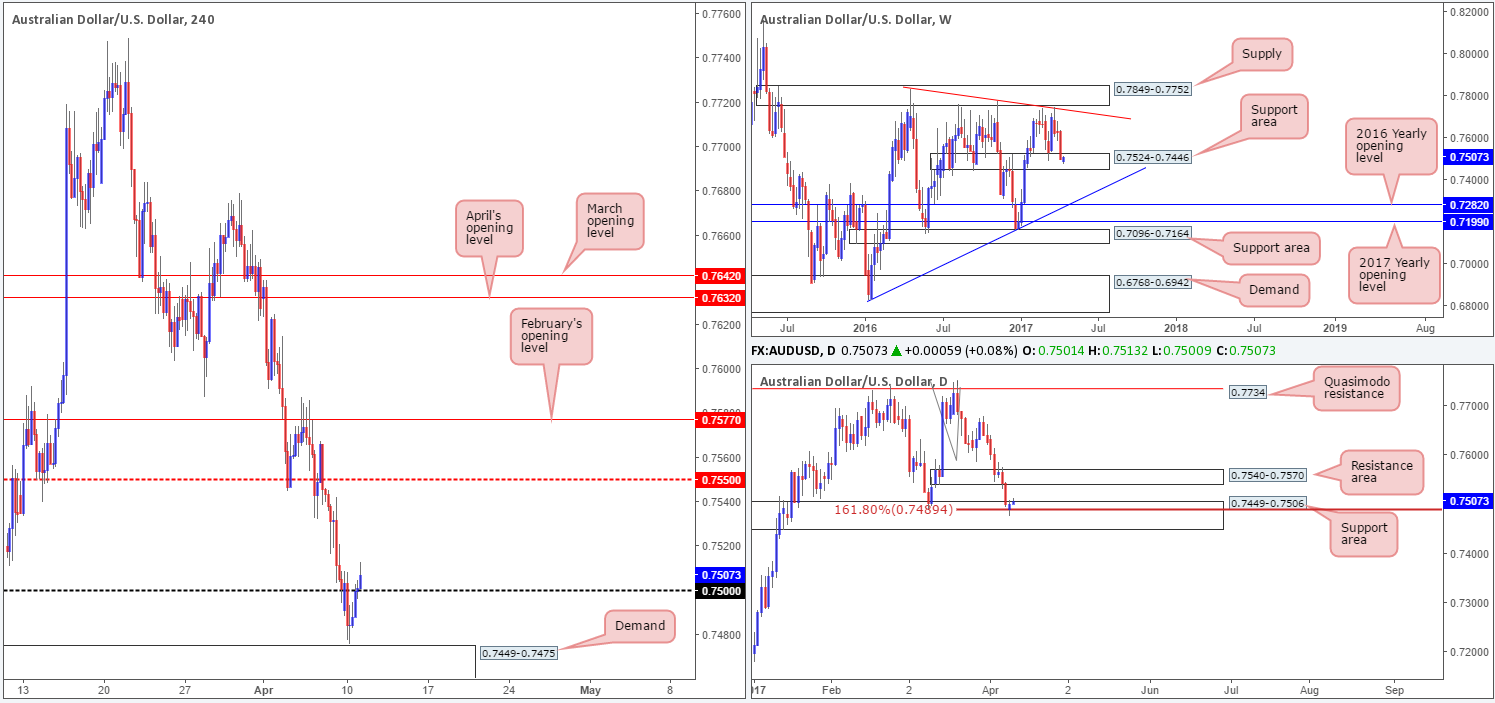
Looking at this market from the top/down today, buyers and sellers remain battling for position within the walls of a weekly support area at 0.7524-0.7446. This zone has provided support and resistance since mid-2016, so we do expect to see some buying pressure eventually emerge from here. Along the same vein, daily price found a pocket of bids around the AB=CD (taken from the high 0.7749) 161.8% Fib ext. at 0.7489, which is housed within a daily support area at 0.7449-0.7506 and the noted weekly support area.
Over on the H4 chart, the candles are seen trading above the 0.75 handle after coming within striking distance of demand at 0.7449-0.7475. Should the bulls manage to hold ground beyond 0.75, this would, in our opinion, further confirm bullish strength from the mentioned higher-timeframe support areas.
Our suggestions: Basically, our team is looking for 0.75 to hold. In the event that price retests this number and prints a reasonably sized H4 bullish candle, we would, dependent on the time of day, look to long from here and target 0.7550 as an initial take-profit zone.
Data points to consider: FOMC member Kashkari speaks at 6.45pm GMT+1.
Levels to watch/live orders:
- Buys: 0.75 region ([waiting for a reasonably sized H4 bullish candle to form before pulling the trigger is advised] stop loss: ideally beyond the trigger candle’s tail).
- Sells: Flat (stop loss: N/A).
USD/JPY:
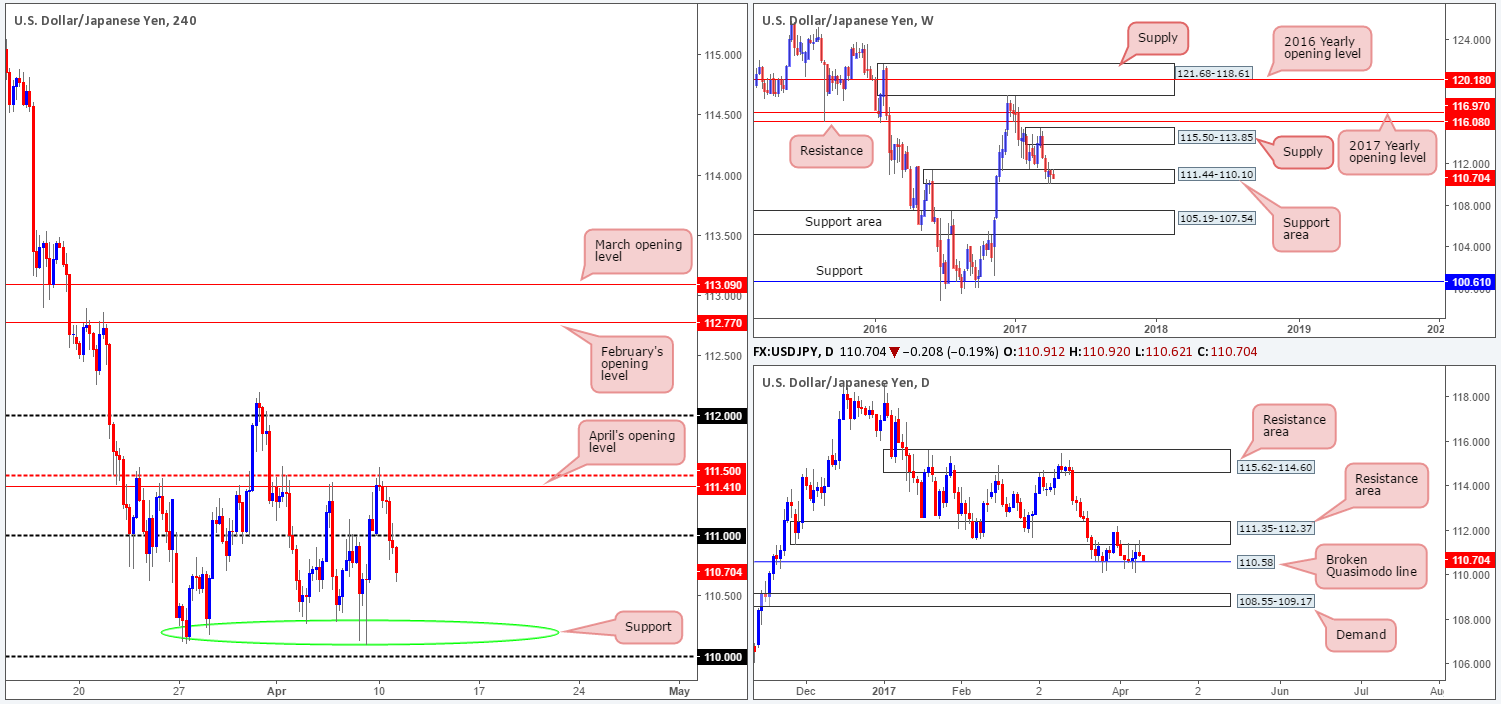
The USD/JPY spent yesterday’s sessions fading from April’s opening level at 111.41 which, as you can see, is shadowed closely by the H4 mid-way resistance at 111.50. After running through bids at the 111 handle, the H4 chart shows room for price to attack the support area marked with a green circle at the 110.20ish area, followed closely by the 110 handle.
Although we have to agree the bears do look incredibly enthusiastic at the moment, it might be worth noting that there’s a weekly support area in play at 111.44-110.10 and also a daily broken Quasimodo line at 110.58! As such, we wouldn’t fancy being a seller in this market right now.
Our suggestions: In view of the unit’s close proximity to the noted higher-timeframe structures, our desk is going to be looking for longs around the 110 neighborhood today. An ideal scenario would be for the H4 candles to print a reasonably sized bullish rotation off this number. This would be enough evidence to suggest the buyers are making a play, in our opinion.
Data points to consider: FOMC member Kashkari speaks at 6.45pm GMT+1.
Levels to watch/live orders:
- Buys: 110 region ([waiting for a reasonably sized H4 bullish candle to form before pulling the trigger is advised] stop loss: ideally beyond the trigger candle’s tail).
- Sells: Flat (stop loss: N/A).
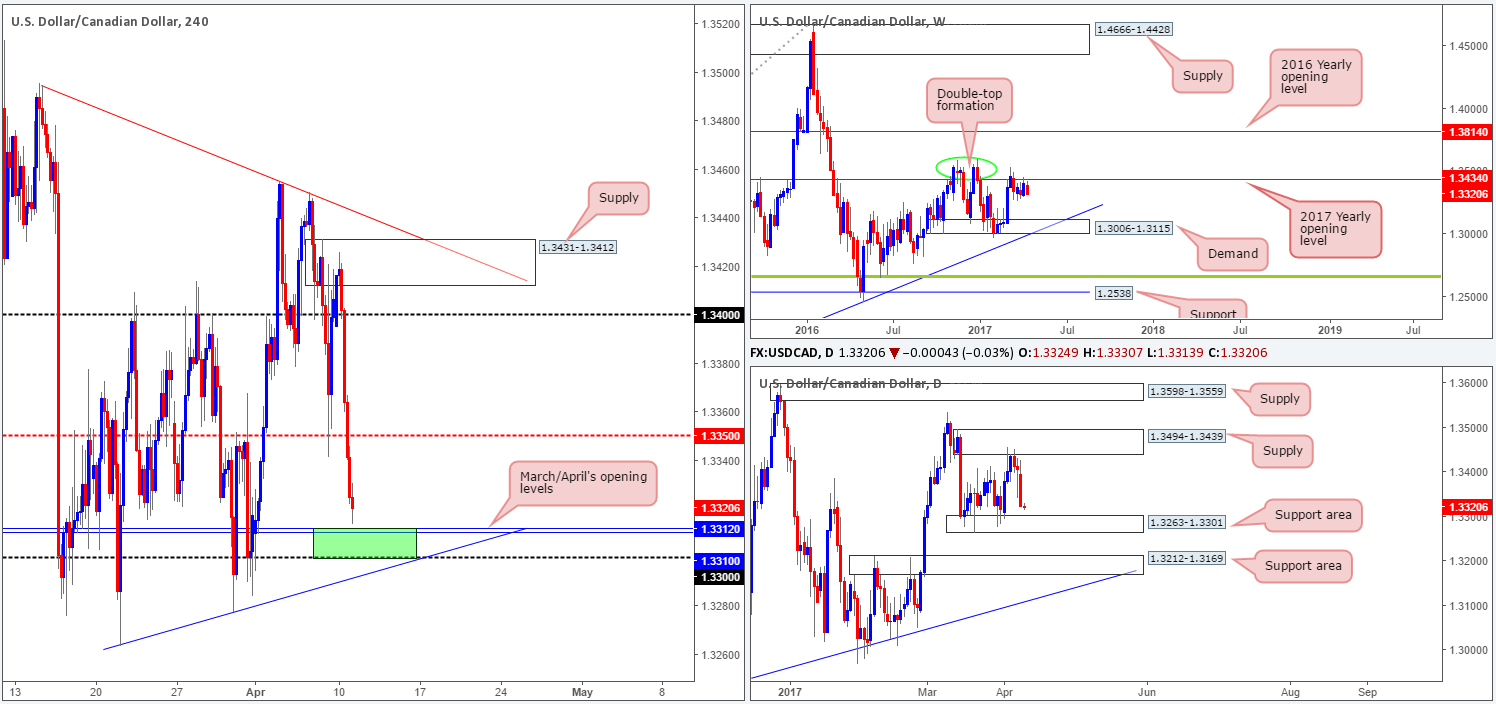
USD/CAD:
Weighed on heavily by rising oil prices, the USD/CAD fell sharply yesterday. The 1.34 handle and the H4 mid-way support 1.3350 were both taken out, leaving price free to challenge March/April’s opening levels at 1.3310/12.
Technically speaking, this recent downside move should not really come as too much of a surprise since weekly price has spent the best part of a month teasing the underside of the 2017 yearly opening level at 1.3434. While the bears do look to be in a strong position at the moment, one may want to take into account that a daily support area at 1.3263-1.3301 has recently elbowed its way into the spotlight! The zone has offered support to this market since the 16th March and could very well do so again.
Our suggestions: March/April’s opening levels at 1.3310/12, coupled with the 1.33 handle and nearby daily support area (green H4 zone), could, in our view, hold this market higher this week despite weekly action suggesting lower prices may be on the horizon. However, before we’d look to commit here, we would require a reasonably sized H4 bullish candle to form out of the zone, showing us that the bulls have interest here.
Data points to consider: FOMC member Kashkari speaks at 6.45pm GMT+1.
Levels to watch/live orders:
- Buys: 1.33/1.3312 ([waiting for a reasonably sized H4 bullish candle to form before pulling the trigger is advised] stop loss: ideally beyond the trigger candle’s tail).
- Sells: Flat (stop loss: N/A).
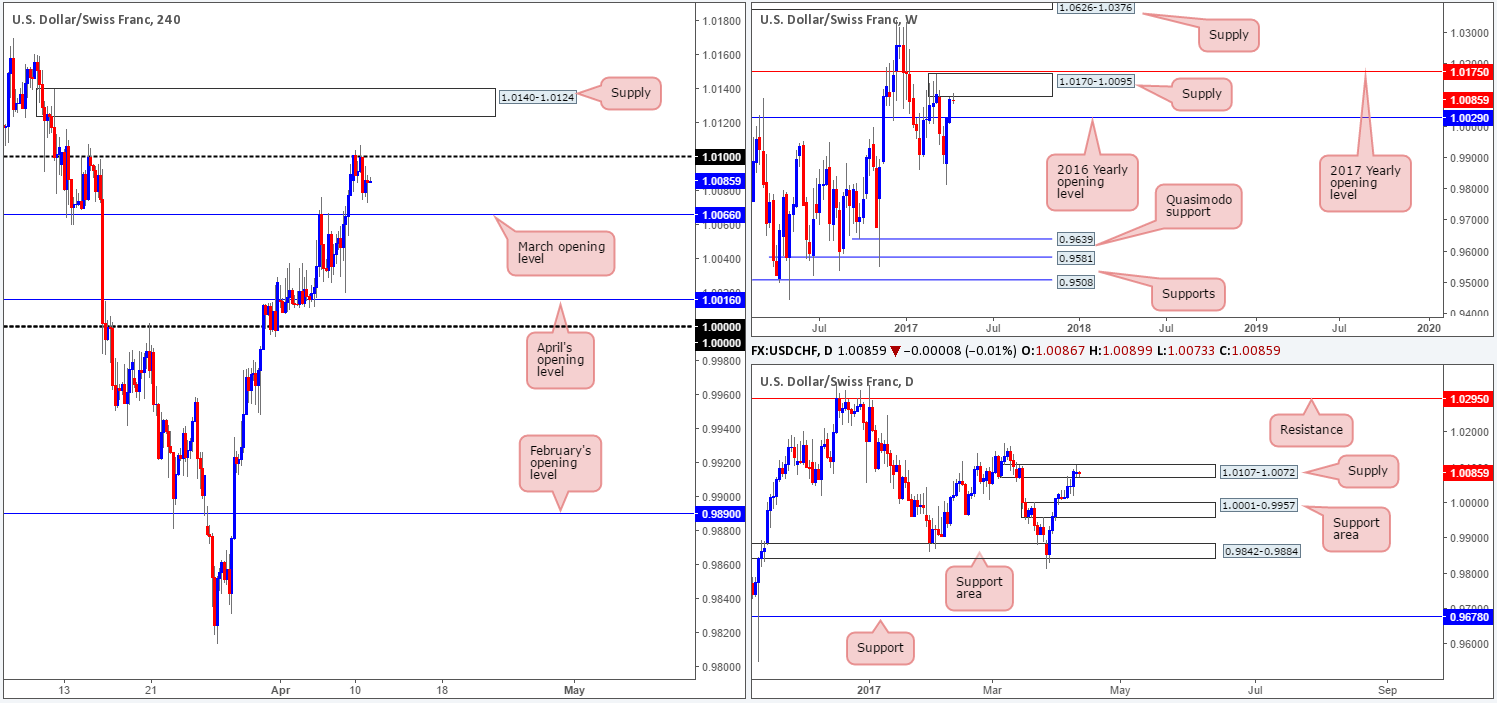
USD/CHF:
Try as it might, the Swissy failed to muster enough strength to breach the 1.01 handle yesterday. This might have had something to do with the fact that the daily candles are seen trading within the walls of a supply zone penciled in at 1.0107-1.0072, and also weekly price seen teasing the underside of a supply formed at 1.0170-1.0095.
Before traders look to press the sell button, however, we would strongly recommend waiting for March’s opening level at 1.0066 to be consumed. Not only would this confirm downside strength, it would also open the path south to April’s opening level at 1.0016 and parity (1.0000), which also represents the top edge of a daily support area (the next downside target on that timeframe).
Our suggestions: A decisive H4 close beyond 1.0066, followed up with a retest as resistance and a reasonably sized H4 bearish candle, would, in our estimation, be enough evidence to warrant a short position. Under these circumstances, stops are usually placed a few pips beyond the candle’s wick.
Data points to consider: FOMC member Kashkari speaks at 6.45pm GMT+1.
Levels to watch/live orders:
- Buys: Flat (stop loss: N/A).
- Sells: Watch for H4 price to engulf 1.0066 and then look to trade any retest seen thereafter ([waiting for a reasonably sized H4 bearish candle to form following the retest is advised] stop loss: ideally beyond the trigger candle’s wick).
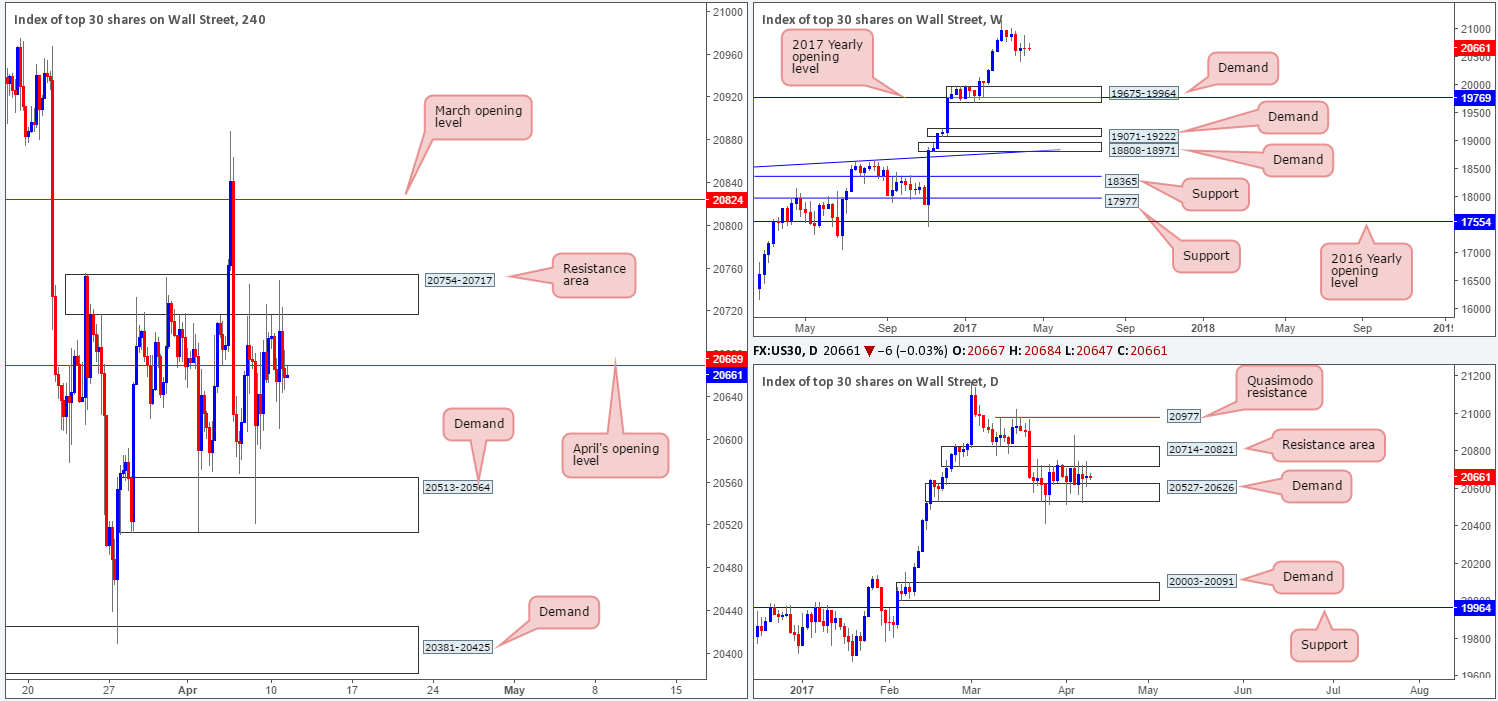
DOW 30:
The H4 resistance area at 20754-20717 managed to hold ground yesterday, consequently pushing the index back below April’s opening level at 20669. While a short from this number could be something to consider, let’s be mindful to the fact that the daily candles have experienced a significant amount of choppy action between demand plugged at 20527-20626 and the resistance area at 20714-20821 since the 22nd March. Although daily action indicates that shorts may be risky, we should remind ourselves that there is little weekly structure seen until the index crosses swords with demand at 19675-19964, which happens to intersect with the 2017 yearly opening level at 19769.
Our suggestions: For those willing to take the risk of selling into a daily demand, a short from 20669 does have the backing of weekly flow at the moment. Waiting for a H4 bearish candle to form off 20669 is advised before pressing the sell button. That way stops can be placed beyond the rejection candle’s wick.
Data points to consider: FOMC member Kashkari speaks at 6.45pm GMT+1.
Levels to watch/live orders:
- Buys: Flat (stop loss: N/A).
- Sells: 20669 level ([waiting for a reasonably sized H4 bearish candle to form before pulling the trigger is advised] stop loss: ideally beyond the trigger candle’s wick).
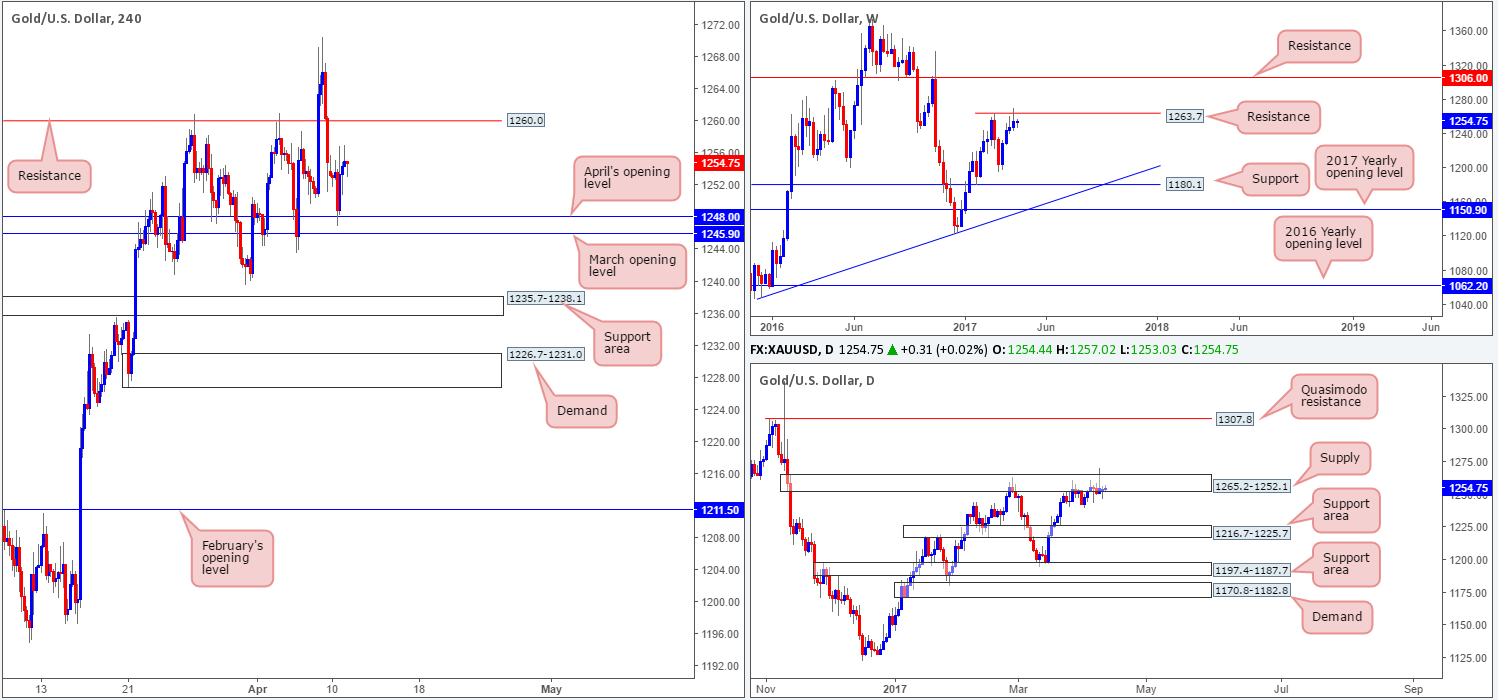
GOLD:
As anticipated, the yellow metal bounced nicely from between April and March’s opening lines at 1245.9/1248.0 and rallied to a high of 1257.0 on the day. With H4 price now seen meandering between the noted monthly levels and resistance planted at 1260.0, where does one step from here? Well, with weekly price recently crossing swords with resistance at 1263.7, and daily movement trading within supply lodged at 1265.2-1252.1, the path of least resistance is south.
Our suggestions: Based on the above notes, we see two possible scenarios playing out:
- Wait and see if H4 price tests resistance at 1260.0. In the event that it holds ground and forms a reasonably sized H4 bearish candle, a short from here is valid.
- Assuming that the monthly levels at 1245.9/1248.0 are taken out, the next area on the hit list is a support zone formed at 1235.7-1238.1. Should price retest the underside of these levels and print a reasonably sized H4 bearish candle, a short from here is also valid.
Levels to watch/live orders:
- Buys: Flat (stop loss: N/A).
- Sells: 1260.0 region ([waiting for a reasonably sized H4 bearish candle to form before pulling the trigger is advised] stop loss: ideally beyond the trigger candle’s wick). Watch for H4 price to engulf 1245.9/1248.0 and then look to trade any retest seen thereafter ([waiting for a reasonably sized H4 bearish candle to form following the retest is advised] stop loss: ideally beyond the trigger candle’s wick).


