
A note on lower timeframe confirming price action…
Waiting for lower timeframe confirmation is our main tool to confirm strength within higher timeframe zones, andhas really been the key to our trading success. It takes a little time to understand the subtle nuances, however, as each trade is never the same, but once you master the rhythm so to speak, you will be saved from countless unnecessary losing trades. The following is a list of what we look for:
- A break/retest of supply or demand dependent on which way you’re trading.
- A trendline break/retest.
- Buying/selling tails – essentially we look for a cluster of very obvious spikes off of lower timeframe support and resistance levels within the higher timeframe zone.
- Candlestick patterns. We tend to only stick with pin bars and engulfing bars as these have proven to be the most effective.
EUR/USD:
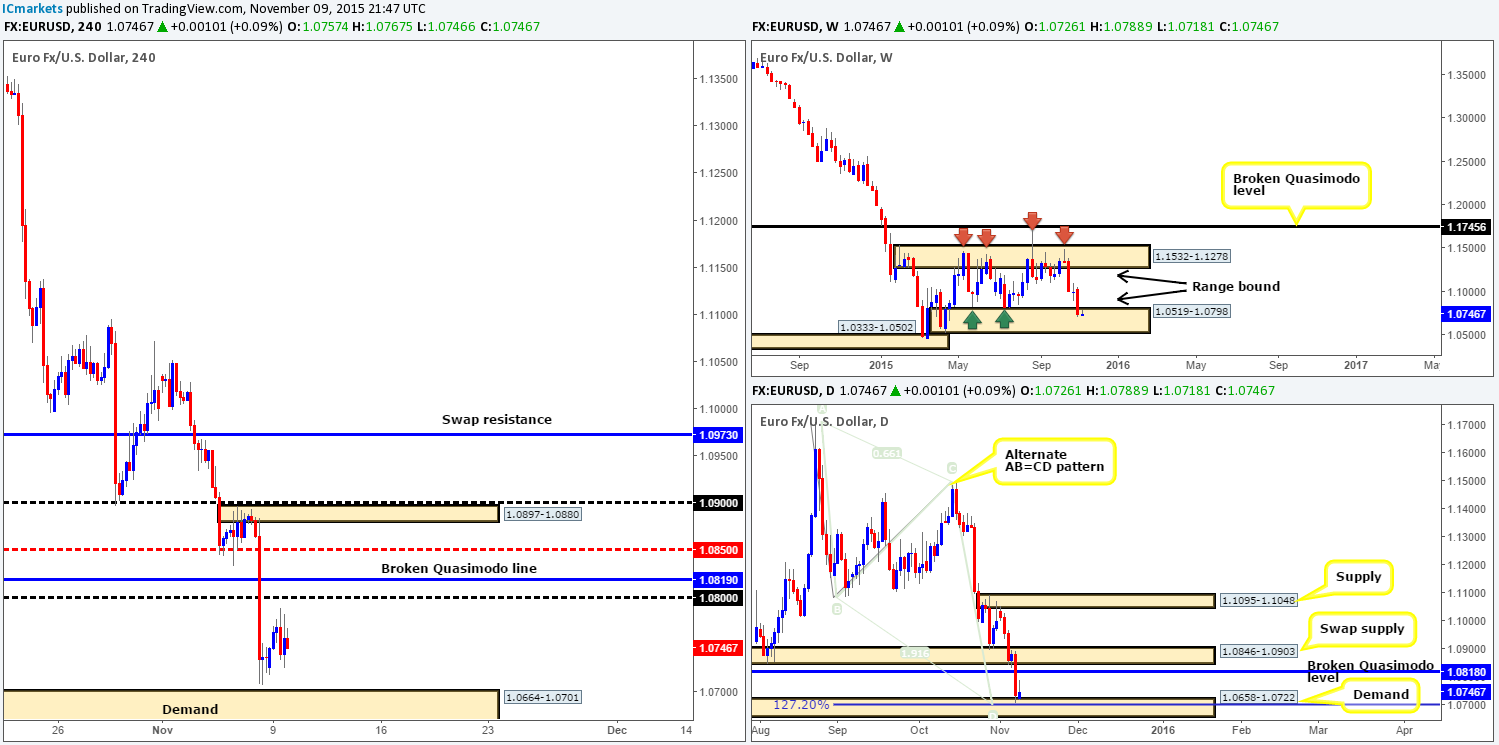
Following the open 1.0726, the EUR had a relatively quiet session yesterday – well, quiet in comparison to Friday’s NFP shenanigans that is. Price peaked at highs of 1.0778 and recorded lows of 1.0718. Consequent to this somewhat sluggish performance, much of the following analysis will remain the same as our previous report…
Ultimately, we’re still looking for price to drive lower and break below Friday’s lows 1.0707 to connect with demand seen at 1.0664-1.0701 to enter long (waiting for lower timeframe confirmation is recommended here due to how powerful the selling pressure has been over the past two weeks).
For anyone who did not read Monday’s report, the reason we’re looking for longs at this area lies within the higher timeframe structure. As you can see, the weekly chart shows price lurking within range demand at 1.0519-1.0798, and daily action is also shaking hands with demand coming in at 1.0658-1.0722. Furthermore, this daily area not only sits within the above said weekly range demand, but also coincides nicely with a bullish alternate AB=CD pattern at 1.0697.
Should the above come to fruition, targets to keep an eye on come in at psychological resistance 1.0800, followed closely by the broken Quasimodo line at 1.0819 and mid-level resistance 1.0850.
Levels to watch/live orders:
- Buys:1.0664-1.0701 [Tentative – confirmation required] (Stop loss: dependent on where one confirms this area).
- Sells:Flat (Stop loss: N/A).
GBP/USD:
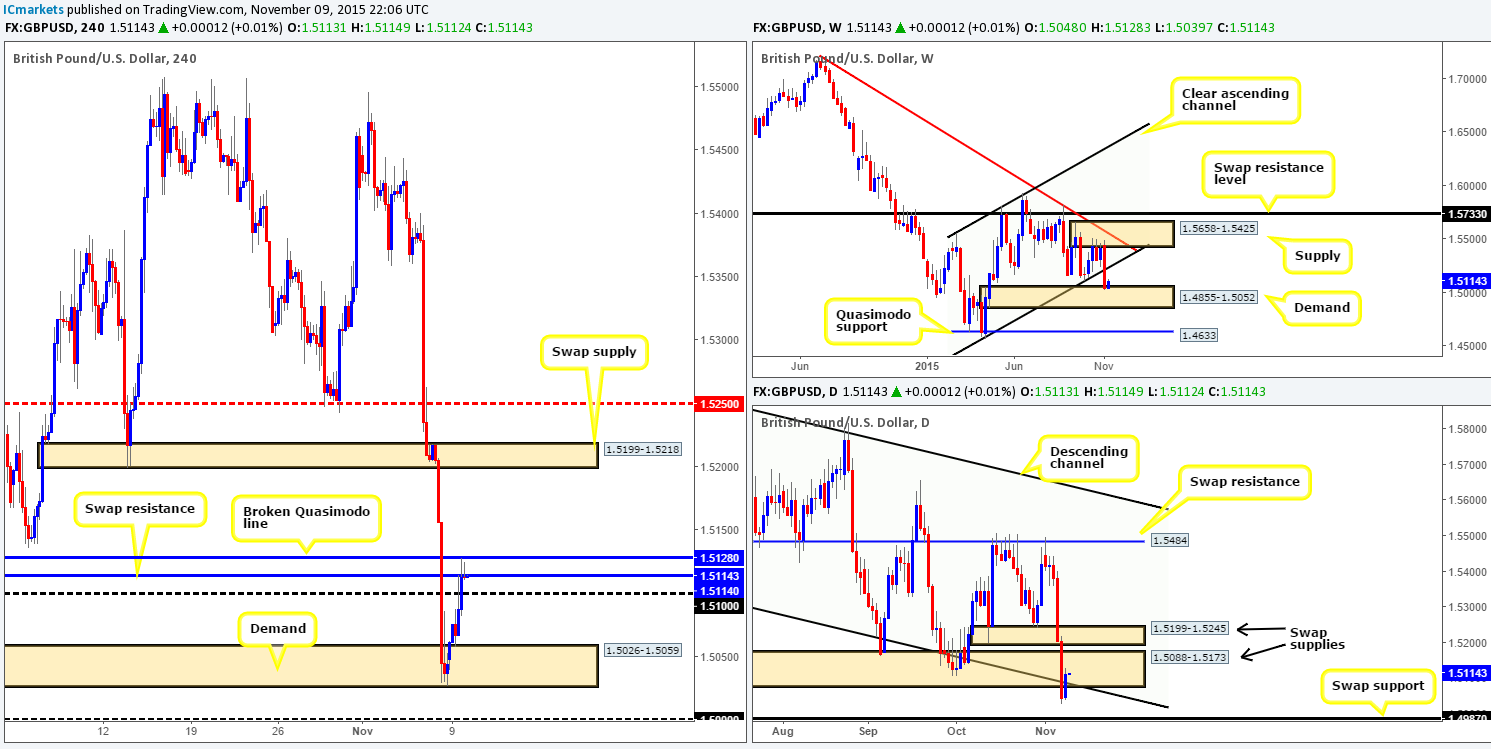
During the course of yesterday’s sessions, Cable corrected sharply higher from deep within 4hr demand at 1.5026-1.5059. This, as can be seen from the chart, forced price above psychological resistance 1.5100 into not only a swap resistance level at 1.5114, but also a broken Quasimodo line at 1.5128 as well.
Now, given that price is trading from the top-side of a weekly demand zone at 1.4855-1.5052 at the moment, there is, at least from where we’re standing, the chance of further upside today/this week. Conversely, however, daily demand (now supply) at 1.5088-1.5173 was taken out amid Friday’s NFP sell-off, potentially clearing the path south towards the swap support hurdle visible at 1.4987.
Therefore, between the 4hr broken Quasimodo line at 1.5128 and the 1.5100 figure, this we believe will be a key area to watch today. We say this simply because a close above this barrier could indicate longs are possible on any confirmed retest of this area up to the swap supply at 1.5199-1.5218. On the other hand, should the sellers hold ground here (watch for confirmed sells), there is a possibility this market could drive back down to the aforementioned 4hr demand area, and due to how deep price has driven into this zone already, maybe even the large psychological support below it at 1.5000. This number – coupled with the daily swap (support) barrier seen just below it at 1.4987, makes one heck of a buy zone to keep a tab on today/this week.
Levels to watch/ live orders:
- Buys: Watch for offers to be consumed around 1.5128 and then look to trade any retest seen at this level (confirmation required).
- Sells: 1.5128/1.5100 [Tentative – confirmation required] (Stop loss: dependent on where one confirms this area).
AUD/USD:
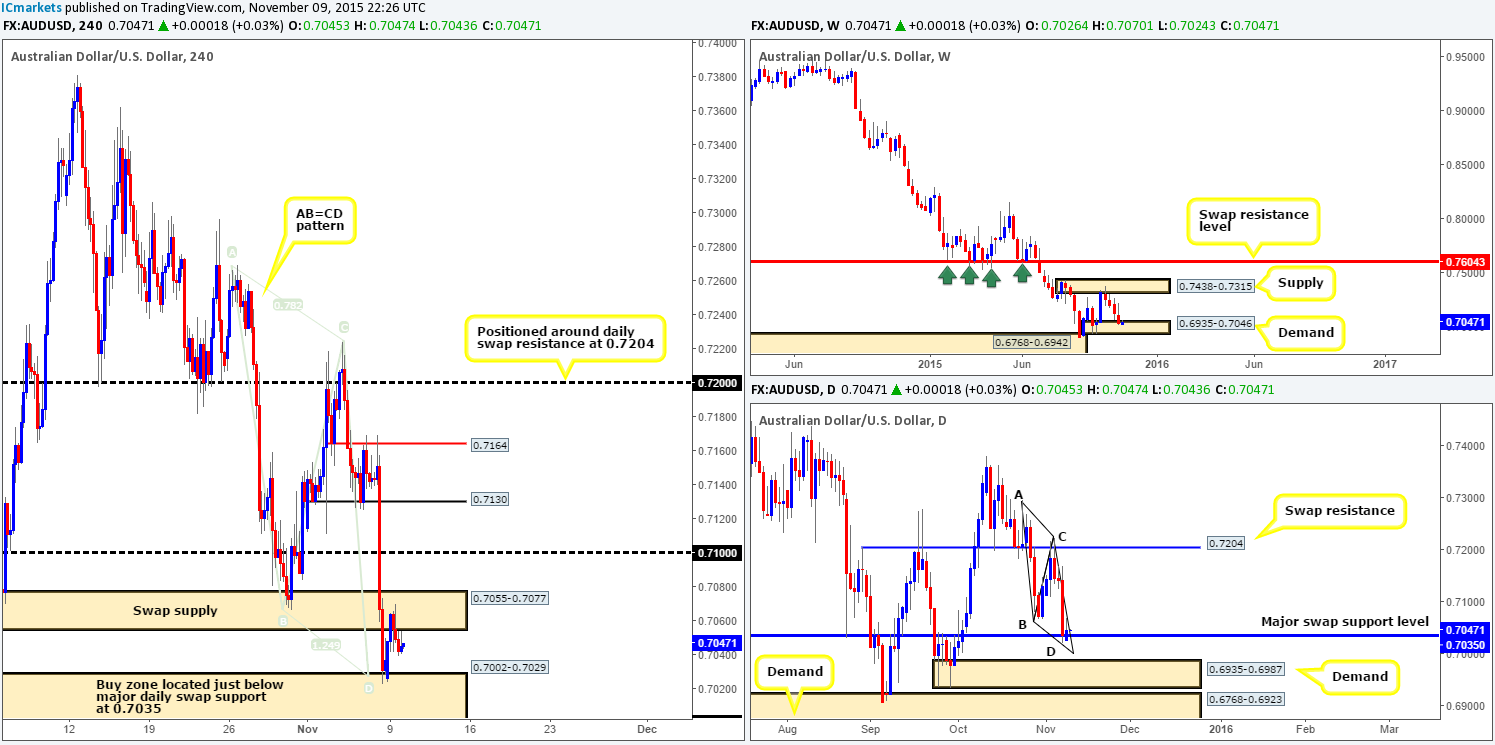
Kicking off this morning’s analysis with a look at the weekly timeframe shows us that price remains trading within demand coming in at 0.6935-0.7046. Down on the daily timeframe, nonetheless, price action reveals that the Aussie pair is still kissing the supportive barrier drawn from 0.7035. As we mentioned in yesterday’s report, most would likely agree that this level combined with the weekly demand zone mentioned above forms a relatively cool buy zone. However, traders may have also noticed that price appears to be in the process of forming a nice-looking AB=CD bullish pattern that completes a little lower at 0.7000. Therefore, there is a possibility that this market may jab lower to complete this pattern before the bulls make any noteworthy appearance.
Turning our attention to the 4hr timeframe, we can see that shortly after the open 0.7026, a steady wave of bids came into this market from demand seen at 0.7002-0.7029 (converges nicely with an AB=CD bottom at 0.7024), pushing price up to a swap supply visible at 0.7055-0.7077.
As far as we see, this market can do one of two things…
- Continue advancing north today and take out the above said swap supply to connect with psychological resistance 0.7100. If this turns out to be the case, we see very little way of trading this market.
- The current swap supply holds firm and pushes this market back into the aforementioned demand area, only this time, likely lower to hunt for fresh bids, and even quite possibly faking below the zone itself. Remember, the lower limits of this demand represents not only a huge psychological support at 0.7000, it is also a bottom of an AB=CD bull pattern on the daily timeframe (see above)!Therefore, a very nice place to be looking to enter long from!
Levels to watch/ live orders:
- Buys:0.7002-0.7029 [Tentative – confirmation required] (Stop loss: dependent on where one confirms this area – expect the possibility of a fake lower).
- Sells:Flat (Stop loss: N/A).
USD/JPY:
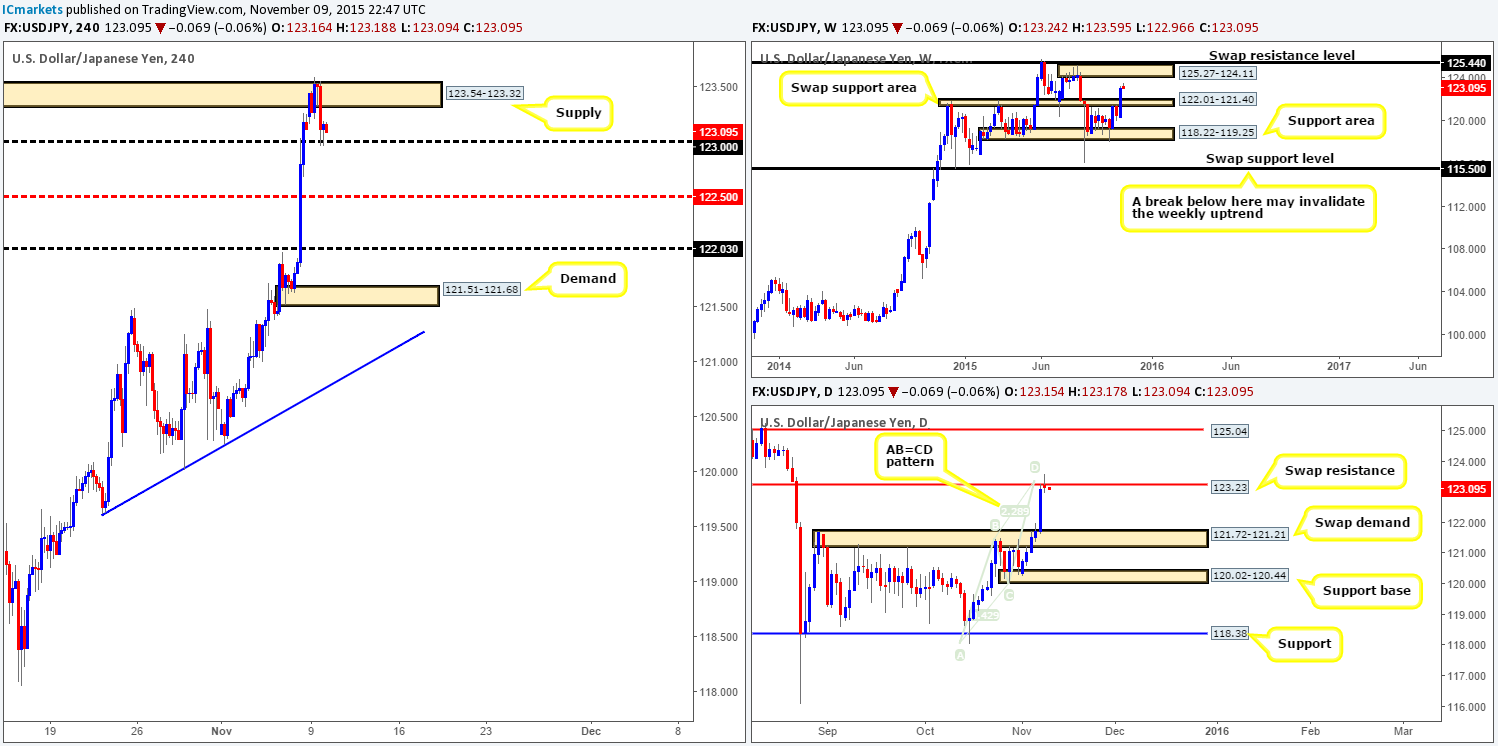
For those who read our previous report (http://www.icmarkets.com/blog/monday-9th-november-weekly-technical-outlook-and-review/), you may recall us mentioning that our team was looking to short (with lower timeframe confirmation) at supply seen at 123.54-123.32. The reason for why came from price also trading ata daily swap (resistance)level at 123.33, which converges nicely with an AB=CD bear top at 123.43.
As is evident from the chart, price did indeed sell-off from this zone down into the jaws of psychological support 123.00, but only after a small fake of around five pips (just enough to collect stops) above this area. We missed this move altogether unfortunately, well done to any of our readers who managed to lock in some green pips here.
With market action currently printing rejection tails off the back of 123.00, where do we see price heading today? Well, that is a difficult one. Reason being is that on the weekly chart, the path north appears free for a further advance up to supply seen at 125.27-124.11, followed closely by the swap resistance level above it at 125.44. Meanwhile, as we mentioned above, daily structure is indicating shorts could be possible. Therefore, 123.00 will play a key role in our decision-making process today…
- In the event that price remains well-bid above 123.00 and we are able to spot lower timeframe confirming price action on either the 30 or 60 minute timeframe, we may consider a long from here dependent on the time of day. Remember, the jab above the current 4hr supply likely cleared out the majority of offers, thus opening the gates for prices to possibly drive higher.
- On the other side of the coin, a close below 123.00 and a confirmed retest would not only suggest to us that this market is likely headed lower, but also give us the opportunity to sell. Targets to keep an eye on from here are the mid-level support 122.50, followed by psychological support 122.00 and even possibly demand at 121.51-121.68.
Levels to watch/ live orders:
- Buys: 123.00 [Tentative – confirmation required] (Stop loss: dependent on where one confirms this level).
- Sells: Watch for bids to be consumed around 123.00 and then look to trade any retest seen at this level (confirmation required).
USD/CAD:
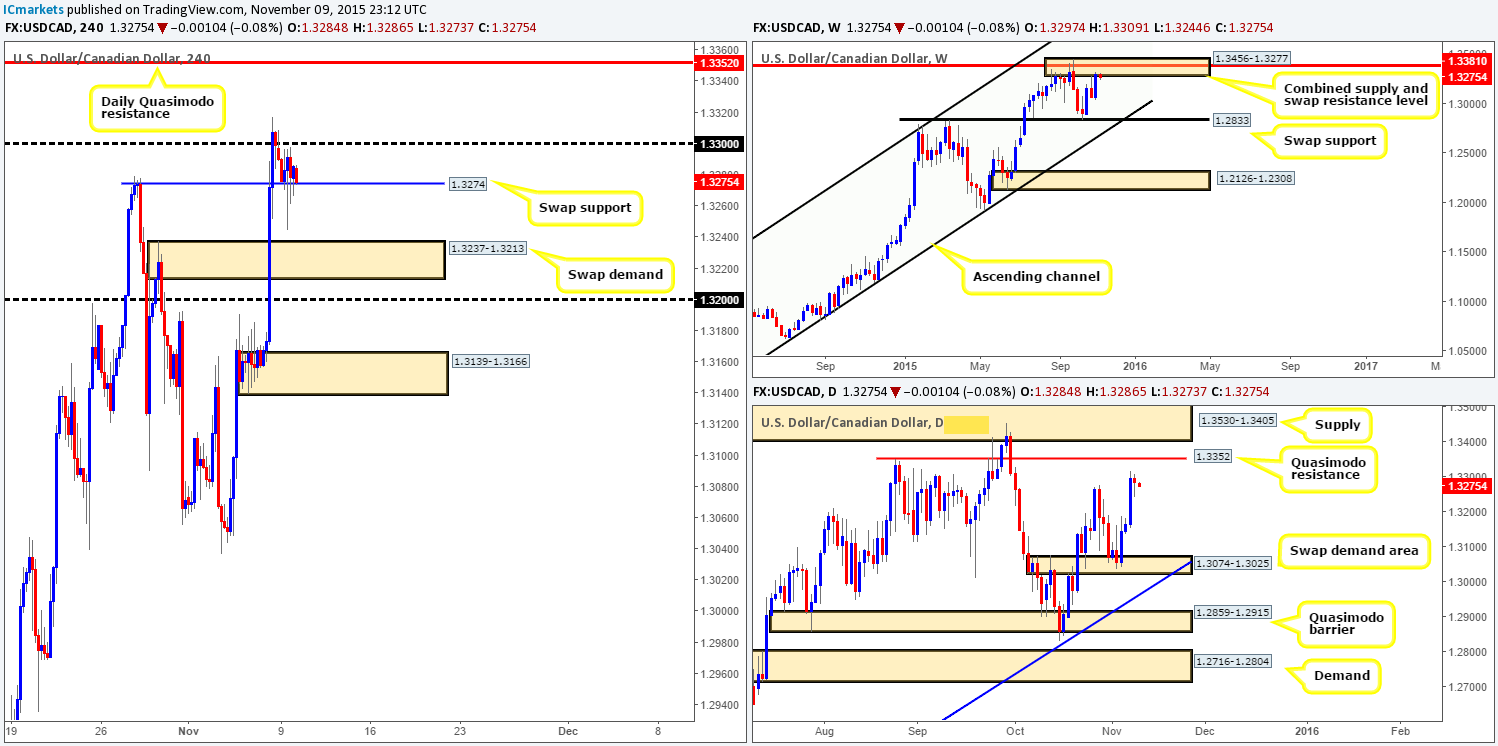
The USD/CAD, as you can see, failed to hold above psychological support 1.3300 yesterday, resulting in price dropping down to the next ‘floor’ of bids sitting around the swap support level coming in at 1.3274 (which is also very clear on the daily structure). With this clear supportive pressure being seen at the moment, and offers around 1.3300 likely being weak now from the break above it on Friday, there is potential for further buying today up to the daily Quasimodo level at 1.3352.
Personally, we have absolutely no interest in buying from here, however, due to price currently trading at the underside of a combined weekly supply and swap resistance area at 1.3456-1.3277/1.3381. What we are interested in, nonetheless, is(if price reaches this high of course) shorting from the daily Quasimodo resistance due to it sitting so neatly within the above said weekly combined supply and swap resistance zone.
Levels to watch/ live orders:
- Buys:Flat (stop loss: N/A).
- Sells:1.3352 [Tentative – confirmation required] (Stop loss: dependent on where one confirms this level).
USD/CHF:
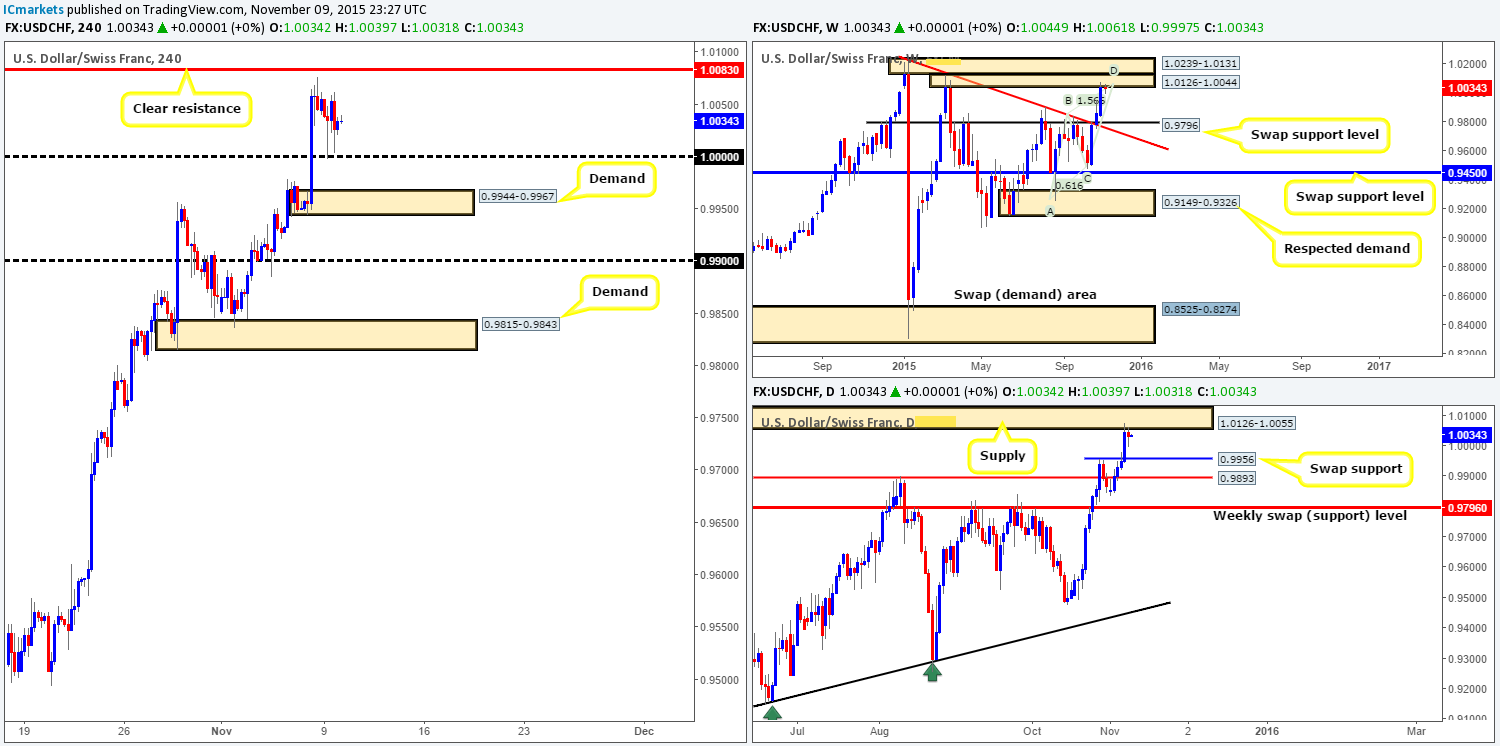
Amid yesterday’s trade, the USD/CHF pair sold off bringing prices down into the hands of 1.0000 – parity, which, of course reacted beautifully as support. Despite this, our initial analysis remains the same…
We still see weekly action jabbing into the lower limits of a stacked supply formation coming in at 1.0126-1.0044 (upper zone is seen at 1.0239-1.0131). In addition to this, we also see a nice-looking AB=CD Harmonic pattern completing around 1.0046 region, thus forming one heck of a sell zone to keep an eye on this week! Similar to that of the weekly timeframe, daily action shows price now kissing the underside of supply drawn from 1.0126-1.0055 (ties in lovely with the weekly supply area mentioned above at 1.0126-1.0044).
Ultimately, what we’re looking for is price to break above Friday’s high 1.0076 and attack the 4hr resistance level seen just above it at 1.0083 today and hold firm. This would, combined with the higher timeframe picture, give us enough confidence to short this pair, targeting parity first and foremost. However, even though this resistance boasts higher timeframe confluence, we would still recommend waiting for confirmation here, seeing as price could still fake above this level to connect with psychological resistance 1.0100.
Levels to watch/ live orders:
- Buys:Flat (Stop loss: N/A).
- Sells:1.0083 [Tentative – confirmation required] (Stop loss: dependent on where one confirms this level).
DOW 30:
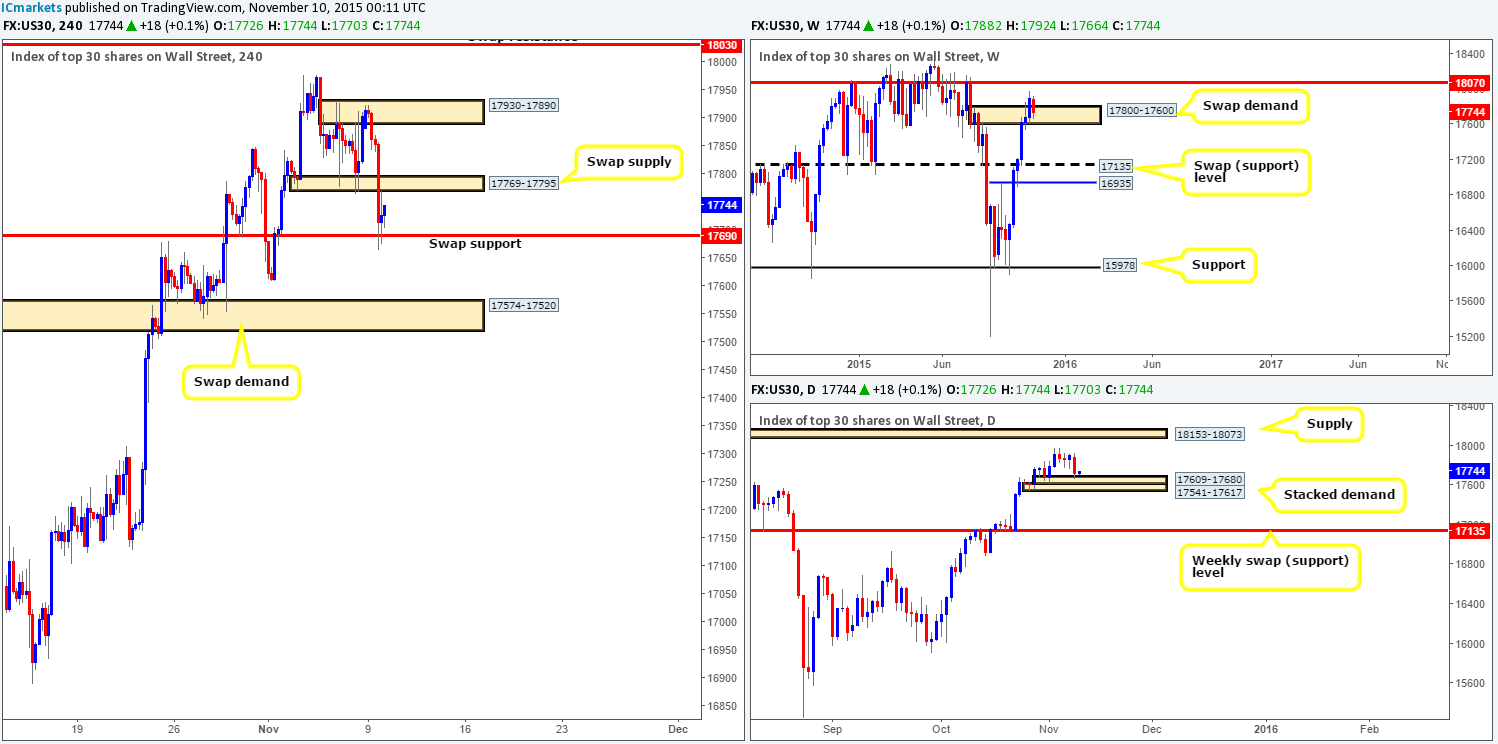
The DOW Jones industrial average took a relatively large hit yesterday as prices plummeted from the 4hr resistance area visible at 17930-17890 following the open 17782. The aftermath of this decline saw demand (now supply) at 17769-17795 wiped out, ending with price tagging in bids from a swap support barrier coming in at 17690.
Technically, this was a little surprising to us as at the time both the weekly and daily charts showed room to appreciate north. Fundamentally, however, economists believe the fall out was due to U.S companies facing the possibilities of higher borrowing costs if, or indeed when the Fed raises interest rates.
Back to the technical picture, once again the DOW now appears to be in a relatively nice-looking buy zone overall. Weekly action shows price trading within a swap demand zone at 17800-17600, whilst down on the daily, price is crossing swords with the top-side of a stacked demand formation at 17541-17617/17609-17680. Couple this with the fact that active bids are defending the above said 4hr swap support barrier at the moment, the market could potentially bounce north from here.
To be on the safe side, we are only considering longs from this 4hr swap support level if we manage to pin-point a lower timeframe buy signal, due to the high possibility a fakeout could take place here. Should all go to plan, our team has noted that they’ll be watching the swap supply area at 17769-17795 as their first take-profit target.
Levels to watch/ live orders:
- Buys: 17690 [Tentative – confirmation required] (Stop loss: dependent on where one confirms this level).
- Sells:Flat (Stop loss: N/A).
XAU/USD: (Gold)
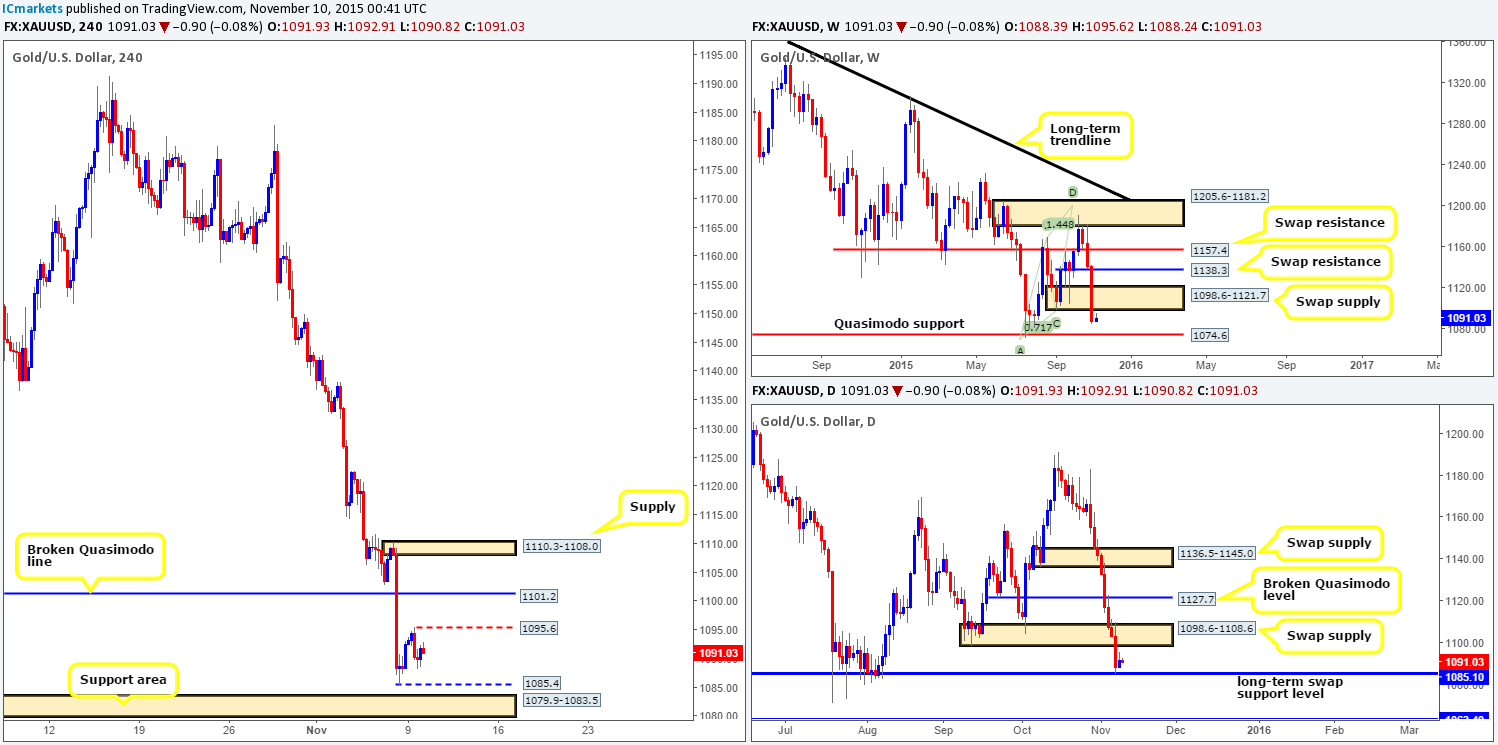
All in all, there was not much action seen on Gold throughout the course of yesterday’s sessions. With that in mind, our team is now eyeing Friday’s low 1085.4, and yesterday’s high 1095.6. Just to be clear here, our team has no interest in trying to fade these barriers today. Instead, it’s the areas sitting beyond these hurdles that we’re interested in!
Directly below 1085.4 sits a nice-looking support area drawn from 1079.9-1083.5, which has to potential to bounce prices since it is also positioned just below the long-term swap support level on the daily timeframe at 1085.1. However, be warned here traders, this area also has the potential to be faked, seeing as this zone sits not too far from a weekly Quasimodo level at 1074.6. With that, we believe the most logical way to approach this area is to wait for the lower timeframes (preferably on the 30/60 minute timeframes) to show some form of confirming price action before considering a long.
Above 1095.6, on the other hand, lurks a broken Quasimodo line at 1101.2, which is surrounded by not only a weekly swap (supply) area at 1098.6-1121.7, but also its partner swap supply on the daily timeframe at 1098.6-1108.6. So, do keep an eye on this ignored Quasimodo level for a possible bounce lower today. Despite this level being supported by higher timeframe supplies, we would still recommend waiting for lower timeframe confirmation to present itself before shorting to avoid the possibility of being stopped on a fake above this level, which is very common to see nowadays!
Levels to watch/live orders:
- Buys:1079.9-1083.5 [Tentative – confirmation required] (Stop loss: dependent on where one confirms this area).
- Sells: 1101.2 [Tentative – confirmation required] (Stop loss: dependent on where one confirms this level).


