
EUR/USD:
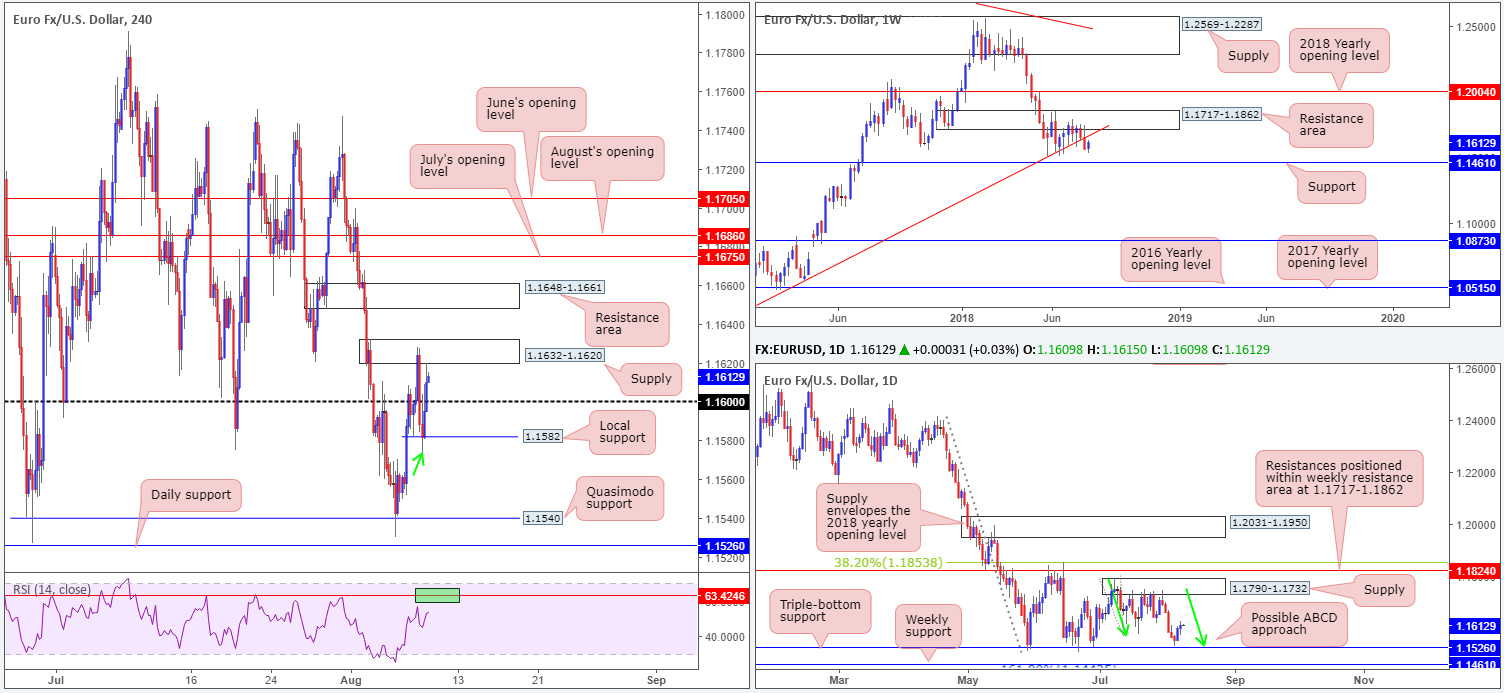
Although the single currency ended Wednesday’s segment in the green, market action was somewhat sedated. Driven by the ebb and flow of USD movement, intraday action found active sellers residing around H4 supply at 1.1632-1.1620, and willing buyers from local H4 support around the 1.1582 neighborhood. The 1.16 handle planted between these two barriers was all but ignored during yesterday’s trade. Also worth noting on the H4 scale is the RSI indicator seen within striking distance of a key resistance level (green area) at 63.42.
Higher up on the curve, nevertheless, weekly price is seen approaching the underside of a trend line support-turned resistance (taken from the low 1.0340). The pair is expected to find resistance here, with it having been a strong barrier of support on a number of occasions in the past. Over on the daily timeframe, a move as far north as supply at 1.1790-1.1732 could eventually be seen, after the unit came within 5 pips of testing a triple-bottom support at 1.1526 on Monday.
Areas of consideration:
A break beyond the current H4 supply immediately exposes nearby H4 resistance area at 1.1648-1.1661 – that’s less than 20 pips of space to work with! Above the resistance area, however, we see a collection of Monthly opening levels between 1.1705/1.1675. As the noted weekly trend line resistance intersects with his area, active sellers likely lie in wait here, and therefore marks an area to have noted on your watchlist for future shorting opportunities.
Below local H4 support mentioned above at 1.1582, room to move towards a H4 Quasimodo support at 1.1540 is seen. This provides a 40-pip gap to work with should one feel shorts below 1.1582 are valid. Waiting for 1.1582 to be retested as resistance before executing a sell, though, is strongly recommended. This will help avoid being whipsawed out of a position on a fakeout, as we saw yesterday (green arrow).
Today’s data points: US PPI m/m; US unemployment claims.
GBP/USD:
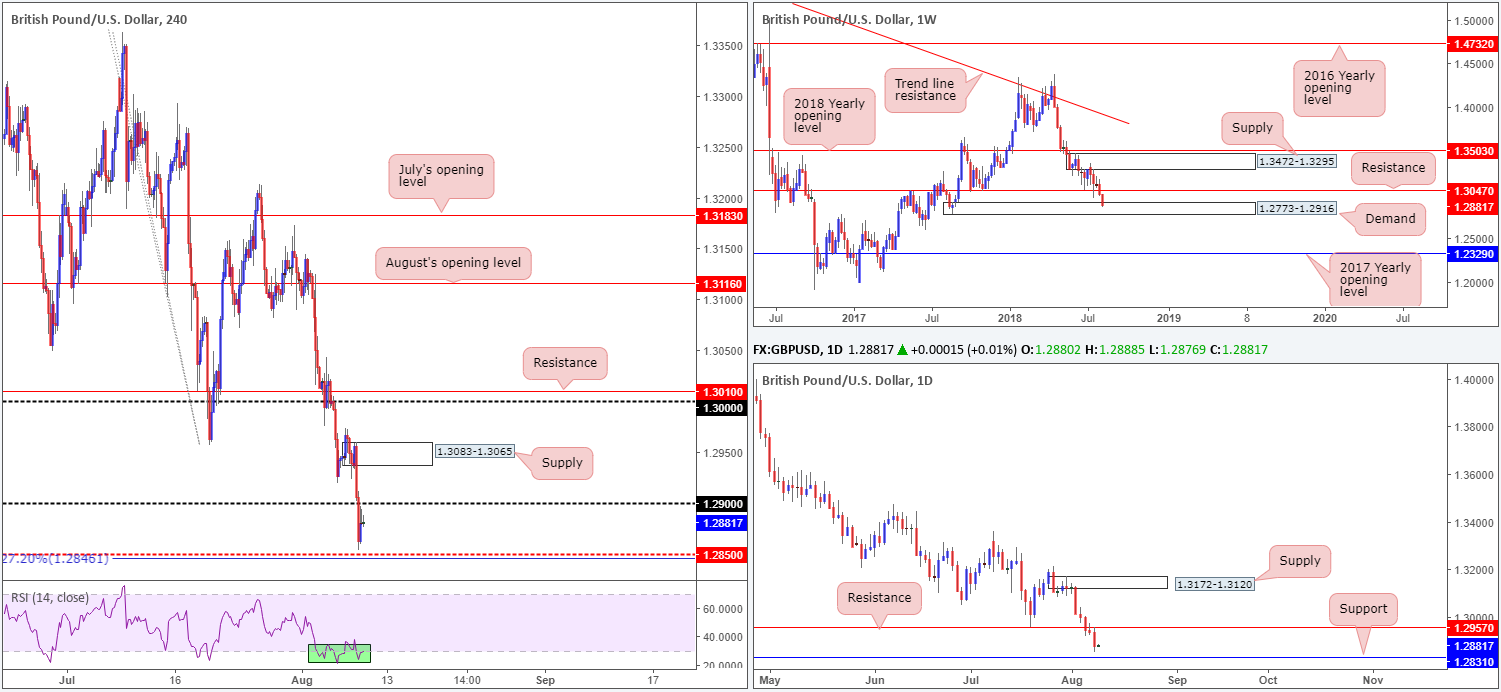
The British pound, as you can see, dived south on Wednesday on persistent Brexit concerns, and unconfirmed reports the UK Government is set to convene next month for a no-deal meeting. Registering its fifth consecutive daily loss, H4 activity is now seen sandwiched between the underside of the 1.29 handle and mid-level support at 1.2850, which happens to converge closely with a 127.2% Fib ext. point at 1.2846 (extended from the high 1.3362).
Weekly demand at 1.2773-1.2916 is seen firmly in the picture now thanks to yesterday’s move. Note this area boasts strong momentum to the upside, indicating possible strength here. The story on the daily scale places the market within striking distance of support priced in at 1.2831. A bounce from this region could see prices revisit resistance at 1.2957.
Areas of consideration:
Given we’re trading from weekly demand and also closing in on daily support, as well as trading within a few pips of H4 mid-level support and a 127.2% Fib ext. point, selling is not something we’d label high probability from a technical standpoint.
Between 1.2850 and 1.2831 (H4 and daily support), a bounce to the upside may occur. Waiting for H4 price to confirm bullish intent (a full or near-full-bodied bull candle would suffice – stops generally can be positioned beneath the rejection candle’s tail) is advised before pulling the trigger, since little is stopping weekly price from driving deeper into its current demand area. As for take-profit targets, the 1.29 handle will likely be the first base of resistance to contend with, therefore best to take some profits of the table from this region if possible.
Today’s data points: US PPI m/m; US unemployment claims.
AUD/USD:
Although the pair ranged over 55 pips on Wednesday, the overall structure of this market remains unchanged from a technical perspective.
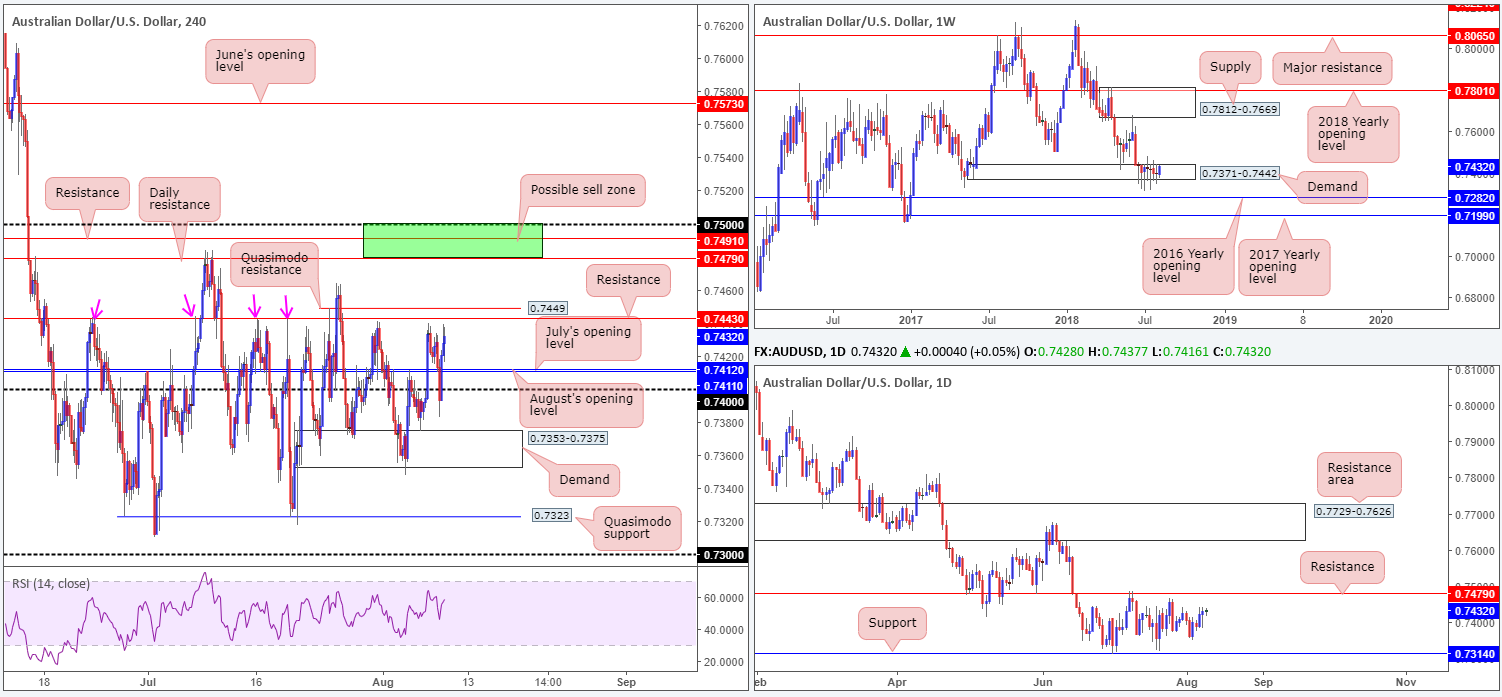
As you can see, H4 structure remains restricted right now. Between 0.7412 (August’s opening level) and 0.7443 (a H4 resistance), one has less than 30 pips of room to play with, whereas a push back beneath the 0.74 handle, sellers have the top edge of H4 demand to target at 0.7375 – even less room! A break through 0.7443 and nearby Quasimodo resistance at 0.7449, nonetheless, likely opens the path to 0.75/0.7479: a H4 sell zone marked in green comprised of a round number, a H4 resistance and daily resistance.
In terms of weekly price action, little has changed over the past month and a half. Demand at 0.7371-0.7442 remains in a fragile state, opening the window to a possible test of the 2016 yearly opening level at 0.7282 sometime down the road. In the event the bulls regain consciousness, however, a retest of supply at 0.7812-0.7669 may eventually be on the cards. The reason behind the lack of movement on the weekly timeframe, technically that is, likely has something to do with the fact daily flow continues to respect its current range. Since early July, the Aussie has fluctuated between support drawn from 0.7314 and resistance chalked up at 0.7479.
Areas of consideration:
The only area of interest that jumps out at us this morning is the H4 sell zone mentioned above at 0.75/0.7479. Already holding price lower once in early July, this area has a healthy chance of holding should it be tested. As the approach has yet to complete it’s difficult to pin down any firm take-profit targets. In regards to stop-loss orders, nevertheless, traders are urged to wait for H4 price to print something of note (a full or near-full-bodied H4 bear candle) from within the zone (tuck stops above the candle’s rejection wick), since there’s a chance the market may witness a fakeout above 0.75 (common viewing around psychological boundaries).
Today’s data points: China inflation y/y; US PPI m/m; US unemployment claims.
USD/JPY:
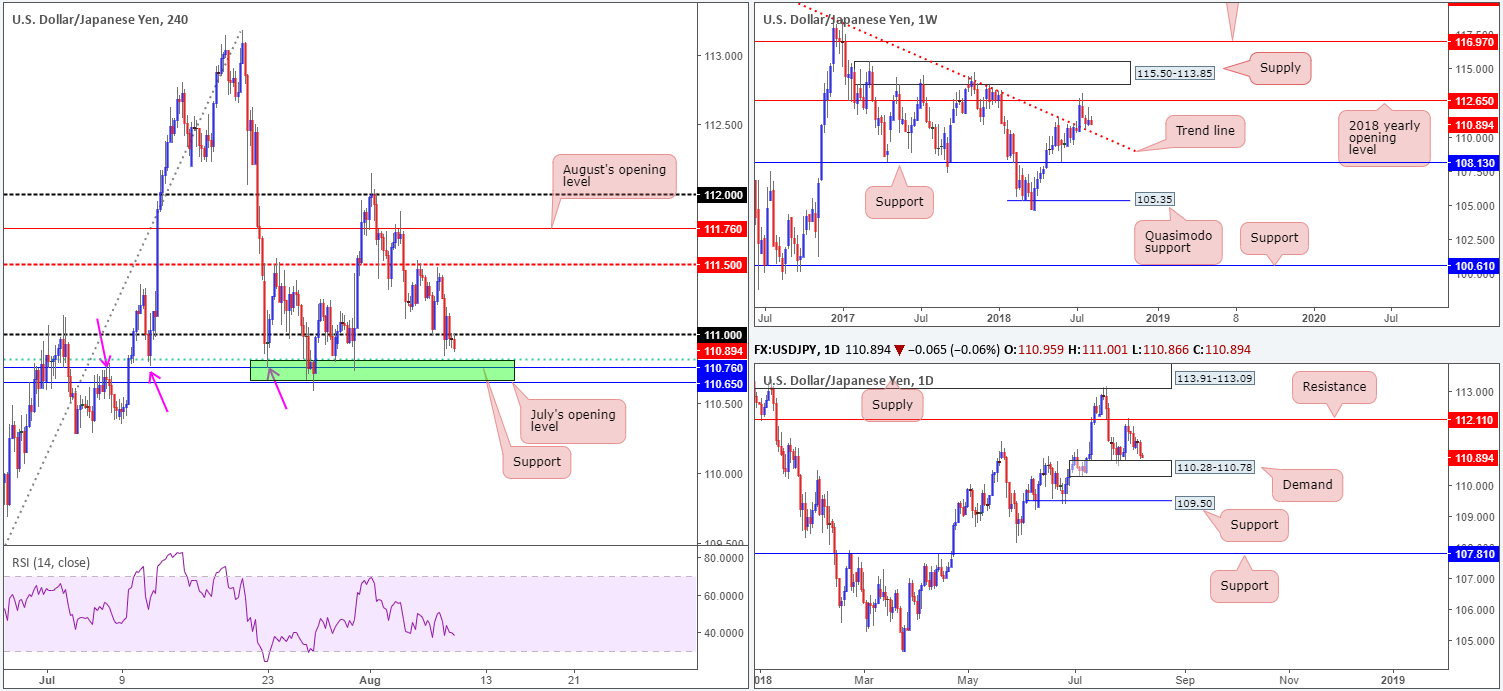
On Wednesday, China’s Commerce Ministry announced it will slap 25% tariffs on USD 16bln worth of US imports, and will begin collecting these tariffs from August 23rd. China said the moves were necessary counter-measures to US tariffs. Demand for the safe-haven yen pulled the USD/JPY beneath the 111 handle in recent trade, consequently exposing a green H4 support area marked below it at 110.65/110.81. We like this area for possible longs due its construction:
- July’s opening level at 110.65.
- H4 support at 110.76.
- 61.8% H4 Fib support at 110.81 (green line).
- Stop-loss orders below 111 will likely provide bigger players the liquidity needed to buy.
Also bear in mind the top edge of daily demand at 110.28-110.78 converges with 110.65/110.81, along with the current weekly trend line resistance-turned support (taken from the high 123.57) intersecting with the lower edge of the daily zone.
Areas of consideration:
On account of the above, 110.65/110.81 remains an area of interest for possible buy trades today (conservative stops can be placed around the 110.57 neighborhood). A H4 close back above 111 from this area would, in our view, be a solid cue to begin thinking about reducing risk to breakeven and taking partial profits off the table.
Today’s data points: US PPI m/m; US unemployment claims.
USD/CAD:
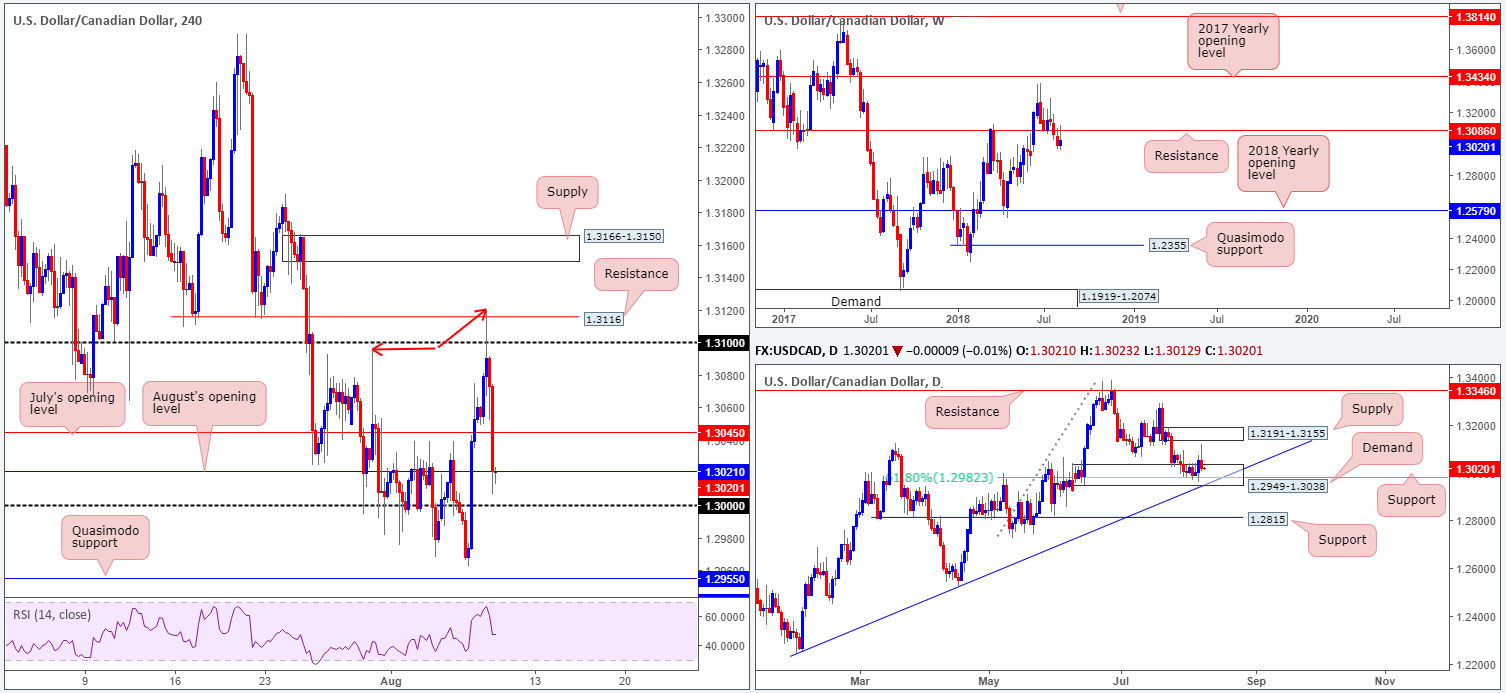
Kicking off with a look at the weekly timeframe, the market retested the underside of resistance coming in at 1.3086 in recent movement and has so far held its ground. Below this level, we see limited demand stopping this market from eventually reaching as far south as the 2018 yearly opening level at 1.2579.
Over on the daily timeframe, however, demand at 1.2949-1.3038 remains in the fold. As you can see, USD/CAD bulls went on the offensive in yesterday’s trade from this area, but failed to connect with nearby supply chalked up at 1.3191-1.3155. It’s also worth noting within the current daily demand, a 61.8% Fib support value at 1.2982 is seen, along with the daily zone intersecting with nearby trend line support (etched from the low 1.2247).
H4 resistance at 1.3116, as you can see, held beautifully going into the early hours of US trade on Wednesday, as price whipsawed through stop-loss orders around the 1.31 handle. The move from here, bolstered by an overall weaker USD, and weekly resistance mentioned above at 1.3086, the pair engulfed July’s opening level at 1.3045 and ended the day testing August’s opening level at 1.3021.
Areas of consideration:
Yesterday’s precipitous decline has placed the key figure 1.30 back in the firing range for possible longs. This psychological boundary will likely be even more attractive now, considering recent movement produced a higher high (see red arrows), as well as the number residing within the walls of current daily demand. To avoid being whipsawed on a fakeout through 1.30, conservative stops would be best placed beneath daily demand around 1.2949. Though a relatively large stop distance, let’s keep the overall picture in perspective – we could potentially reach the underside of daily supply from here at 1.3155: a 150-pip move.
The only drawback to buying this market, of course, is weekly action selling from resistance!
Today’s data points: US PPI m/m; US unemployment claims; CAD NHPI m/m.
USD/CHF:
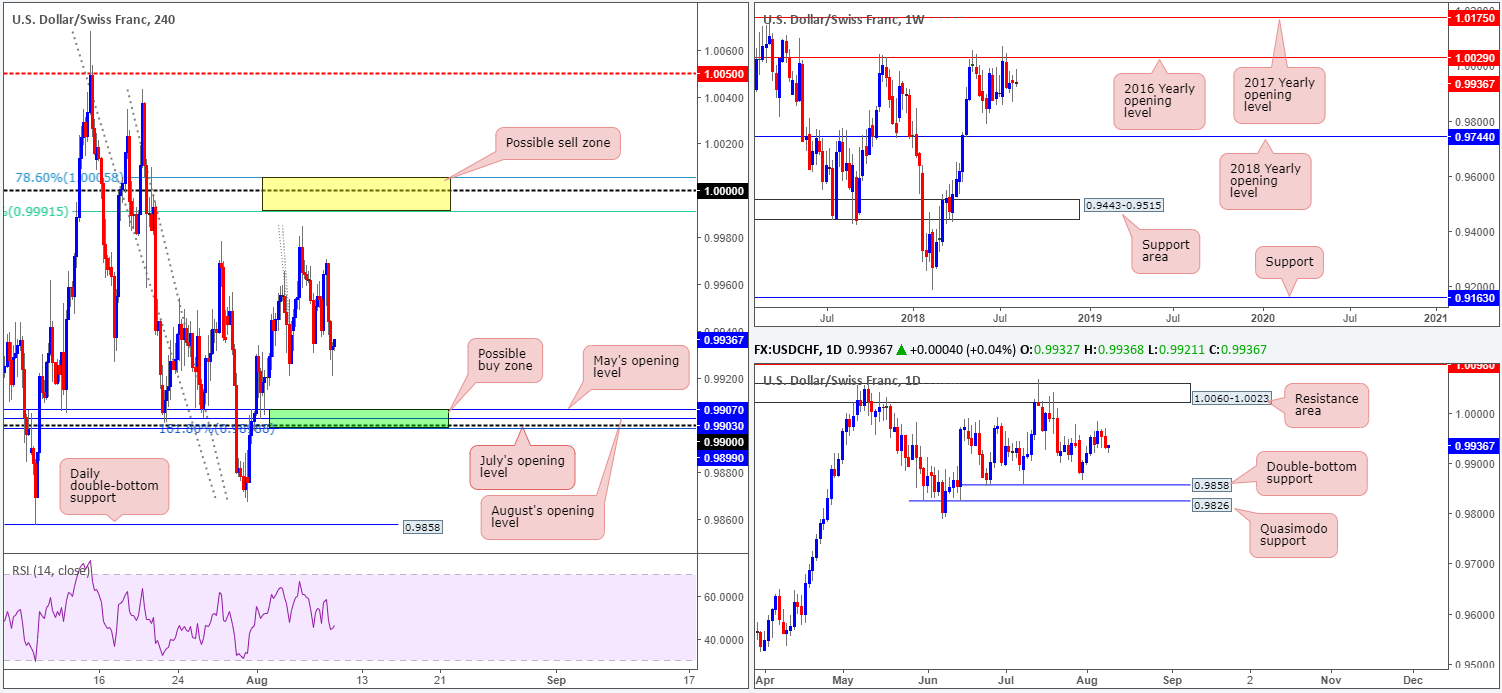
Across the board, greenback weakness was observed on Wednesday, consequently pressuring the USD/CHF to lower ground. Though H4 price is seen fading August 3rd lows at 0.9920 right now, focus remains on the green support zone seen below it at 0.9899/0.9907 (comprised of July’s opening level at 0.9899, a 161.8% Fib ext. point at 0.9899 [taken from the high 0.9984], the 0.99 handle, August’s opening level at 0.9903 and May’s opening level at 0.9907).
Turning our attention to the higher timeframes, weekly price continues to trade beneath key resistance at 1.0029: the 2016 yearly opening level. Holding price lower on two occasions in 2017, and twice already in 2018, this level commands attention! The story on the daily scale shows price action consolidating between 1.0060-1.0023 (a resistance area that encapsulates the 2016 yearly opening level mentioned above on the weekly timeframe at 1.0029), and a double-bottom support at 0.9858.
Areas of consideration:
On the whole, attention remains fixed on 0.9899/0.9907 for possible longs, given the above noted confluence. Before considering a long from this region, nonetheless, traders are urged to wait for additional H4 candle confirmation, preferably a full or near-full-bodied bullish candle. The reason being is round numbers tend to attract ‘stop runs’ (fakeouts).
Today’s data points: US PPI m/m; US unemployment claims.
Dow Jones Industrial Average:
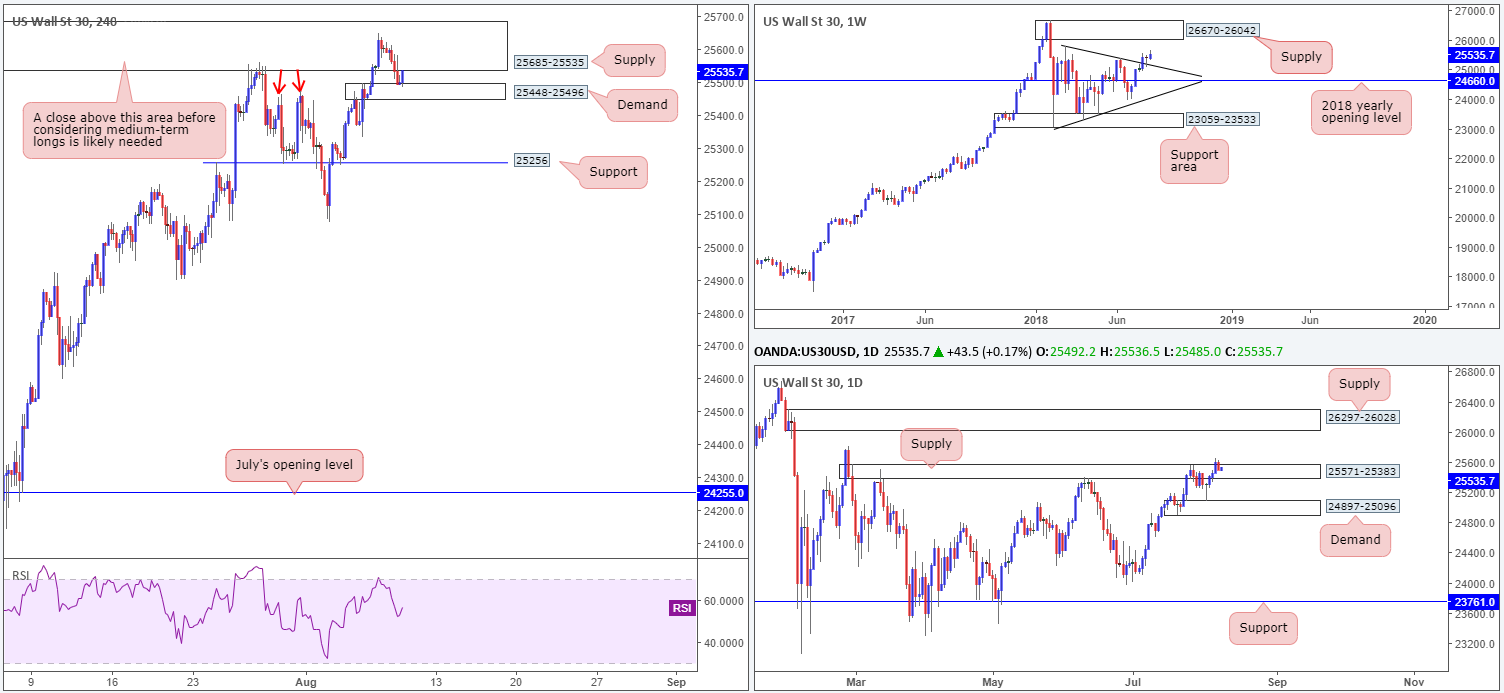
On Wednesday, China announced new 25% tariffs on $16 billion worth of U.S. goods as a retaliatory measure, consequently weighing on market sentiment. H4 supply at 25685-25535, as you can see, pushed lower once the index shook hands with the upper limits of the area. Nearby H4 demand at 25448-25496, however, is currently seen holding firm. This zone is of interest due to it forming on the break of previous resistance around the 25469 point (see red arrows).
In terms of weekly action, price recently retested trend line resistance-turned support (etched from the high 25807) in the shape of a reasonably nice-looking bullish pin-bar formation. From this point, a run up to supply coming in at 26670-26042 is a possible scenario to keep tabs on. Meanwhile, on the daily timeframe, supply at 25571-25383 remains in the fight, despite Tuesday’s break higher.
Areas of consideration:
With the current H4 demand zone mentioned above at 25448-25496 seen holding price higher, opposing H4 supply at 25685-25535 is likely to be challenged again today. This – coupled with a strong weekly picture – is likely enough to force the unit higher.
Technically speaking, waiting for H4 price to CLOSE above the current supply zone before considering longs in this market remains a logical route. A retest to the top edge of this zone that holds firm will likely be enough to draw in buyers and bring the unit towards the aforesaid weekly supply, and therefore remains a viable long setup to keep eyes on going forward.
Today’s data points: US PPI m/m; US unemployment claims.
XAU/USD (Gold)
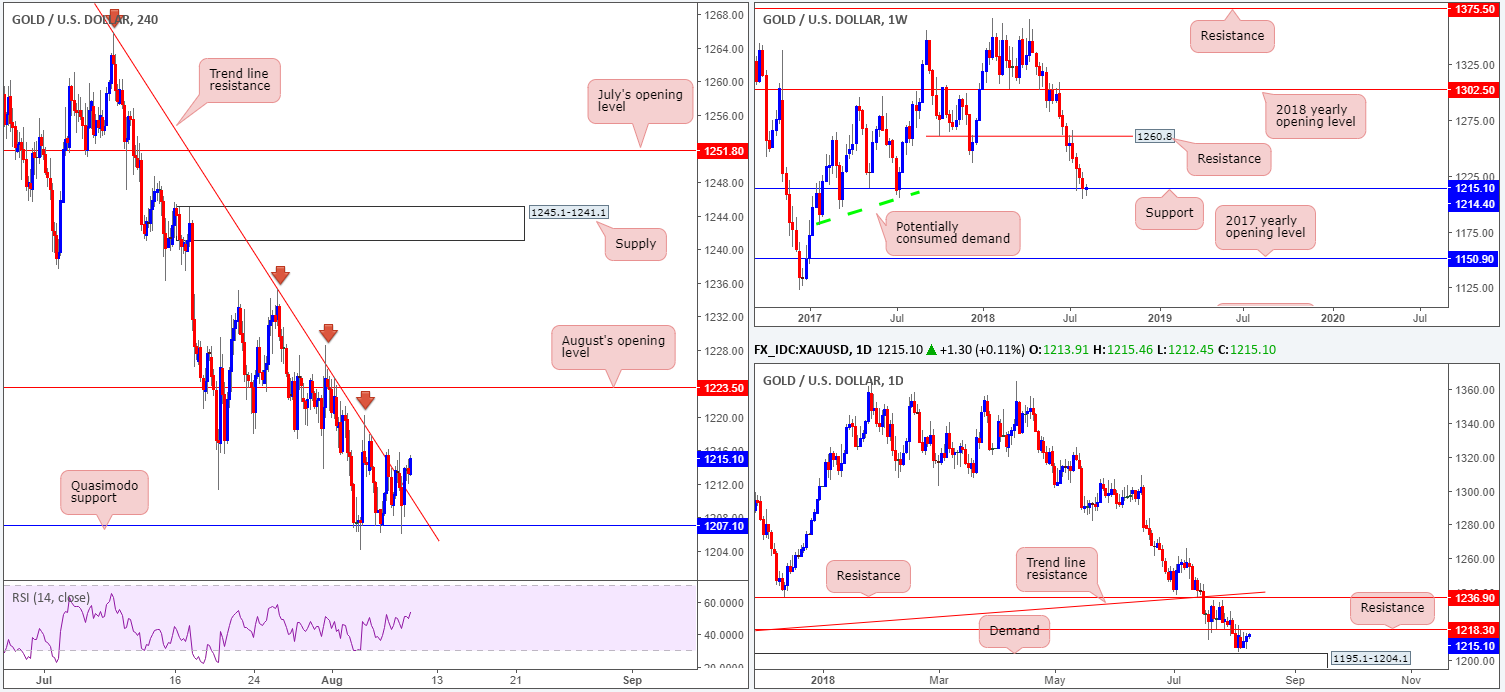
At mercy of the USD, the price of gold concluded Wednesday’s session on firm footing. H4 action witnessed a break of trend line resistance (taken from the high 1265.9). Beyond here, the view north appears clear for a run towards August’s opening level at 1223.5. Before we reach this far north, however, bear in mind we have daily resistance seen nearby at 1218.3! Therefore, for those considering longs based on the recent H4 trend break, do keep this in mind.
Bullion’s weekly support at 1214.4 remains in the fight, despite a number of attempts to push lower. A decisive close beneath here would, in our technical opinion, open up the possibility for further downside as far south as the 2017 yearly opening level at 1150.9. Note there’s limited active demand to the left of current price between these two levels.
Areas of consideration:
This remains a challenging market to trade right now. On the weekly timeframe we have a precarious support in play, while daily price closes in on resistance. Top this off with the fact H4 suggests further buying could be on the horizon.
As they say, sometimes the best position is no position. Under current conditions, remaining flat may be the better path to take.
The use of the site is agreement that the site is for informational and educational purposes only and does not constitute advice in any form in the furtherance of any trade or trading decisions.
The accuracy, completeness and timeliness of the information contained on this site cannot be guaranteed. IC Markets does not warranty, guarantee or make any representations, or assume any liability with regard to financial results based on the use of the information in the site.
News, views, opinions, recommendations and other information obtained from sources outside of www.icmarkets.com.au, used in this site are believed to be reliable, but we cannot guarantee their accuracy or completeness. All such information is subject to change at any time without notice. IC Markets assumes no responsibility for the content of any linked site. The fact that such links may exist does not indicate approval or endorsement of any material contained on any linked site.
IC Markets is not liable for any harm caused by the transmission, through accessing the services or information on this site, of a computer virus, or other computer code or programming device that might be used to access, delete, damage, disable, disrupt or otherwise impede in any manner, the operation of the site or of any user’s software, hardware, data or property.


