
EUR/USD:
The US dollar staged an impressive recovery on Wednesday after extending losses across the board in wake of the US mid-term election results, which saw the Republicans lose control of the House.
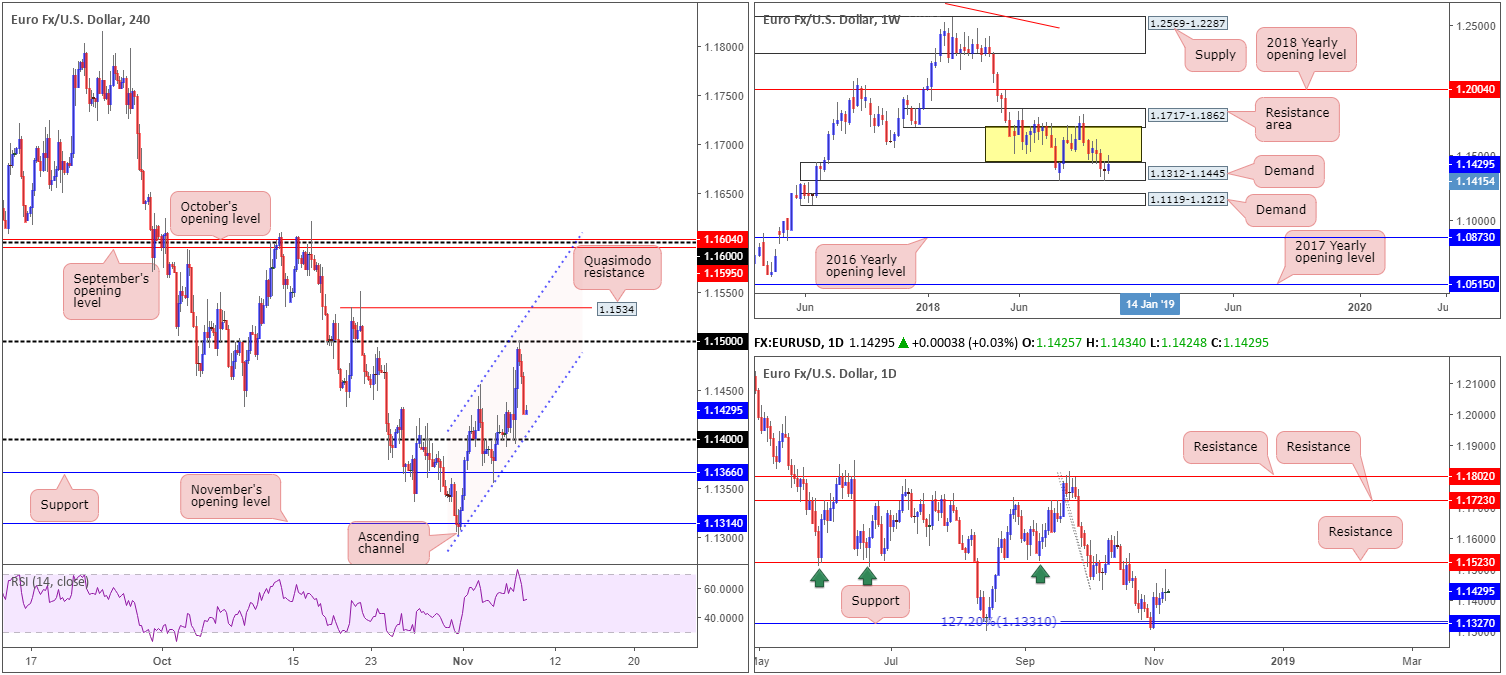
The EUR/USD market challenged its 1.15 handle and surrendered a large portion of recent gains. As the H4 candles appear poised to make a run for 1.14/channel support (extended from the low 1.1302), traders’ focus turn to today’s US Federal Reserve meeting.
Weekly movement, as you can see, is beginning to show some life out of its demand area at 1.1312-1.1445, though we have some way to go before shaking hands with its next upside target: a resistance area coming in at 1.1717-1.1862 (capped upside since early June 2018). On the whole, this timeframe is considered range bound (yellow zone). Areas outside of this border fall in at the 2018 yearly opening level drawn from 1.2004 and demand marked at 1.1119-1.1212. In terms of the daily timeframe, price action came within a stone’s throw away from connecting with notable resistance at 1.1532 yesterday, before retreating for lower ground. The next downside target on this scale rests at 1.1372, which happens to converge nicely with a 127.2% Fib extension point at 1.1331.
Areas of consideration:
With weekly price attempting to make a stand within demand, and daily price yet to connect with resistance, further buying within the H4 ascending channel formation may be in the offing today/tomorrow. With that in mind, traders are likely looking for price to test 1.14 and hold. As a fakeout may occur beyond this number to bring in buyers from nearby H4 support at 1.1366, waiting for additional candlestick confirmation to form before pulling the trigger is an option. As for an initial upside target, 1.15 appears a logical base, as of writing.
Today’s data points: FOMC statement and interest rate decision.
GBP/USD:
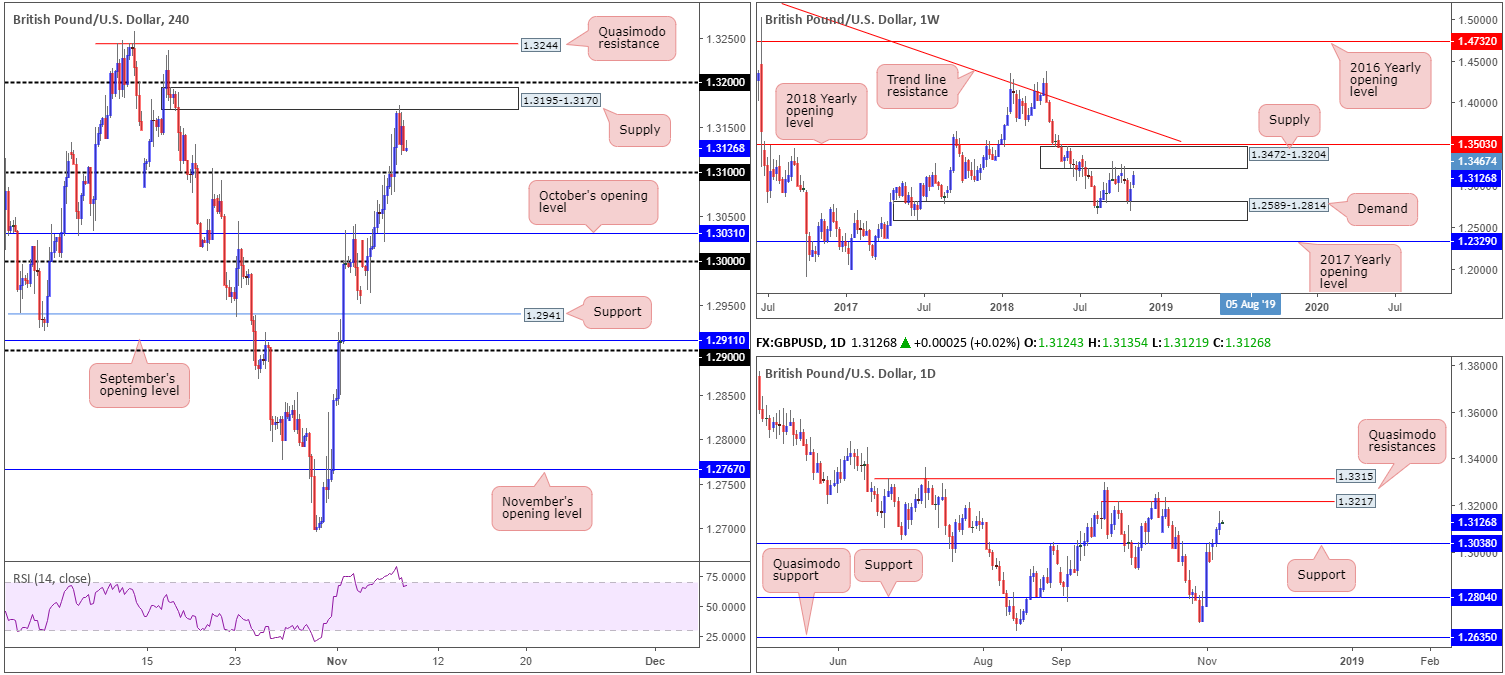
Despite mixed Brexit headers, market players are clearly bullish the pound right now as the currency advanced to fresh highs of 1.3174 Wednesday vs. its US counterpart. After conquering 1.31, the H4 candles engaged with nearby supply at 1.3195-1.3170, which, as you can see, is so far holding ground. Another point worth making is the RSI indicator is currently reporting a strong overbought reading.
Whether the market will observe a retest of 1.31 as support is difficult to judge at this point. Weekly price still shows room to push as far north as supply coming in at 1.3472-1.3204: the top limit of the weekly timeframe’s current range. What’s more, we can also see room for the unit to rally higher on the daily timeframe towards Quasimodo resistance at 1.3217.
Areas of consideration:
Should the market retest 1.31 as support, longs off of this base is an option, targeting 1.32ish. Given these psychological barriers are prone to fakeouts, however, waiting for additional candlestick confirmation to form before pulling the trigger is recommended (entry/stop parameters can be defined by the candlestick structure).
In regard to shorting opportunities, the team has noted the H4 Quasimodo resistance level at 1.3244. Located close by the daily Quasimodo resistance at 1.3217 (close in terms of the daily scale that is), and positioned within the lower limits of the weekly resistance area mentioned above at 1.3472-1.3204, this is considered a high-probability sell. Aggressive traders may simply enter short at 1.3244 and position stops above 1.3257 (the apex of the H4 Quasimodo). For conservative traders, waiting for additional candle confirmation is an alternative (entry/stop parameters can be defined by the candlestick structure).
Today’s data points: FOMC statement and interest rate decision.
AUD/USD:
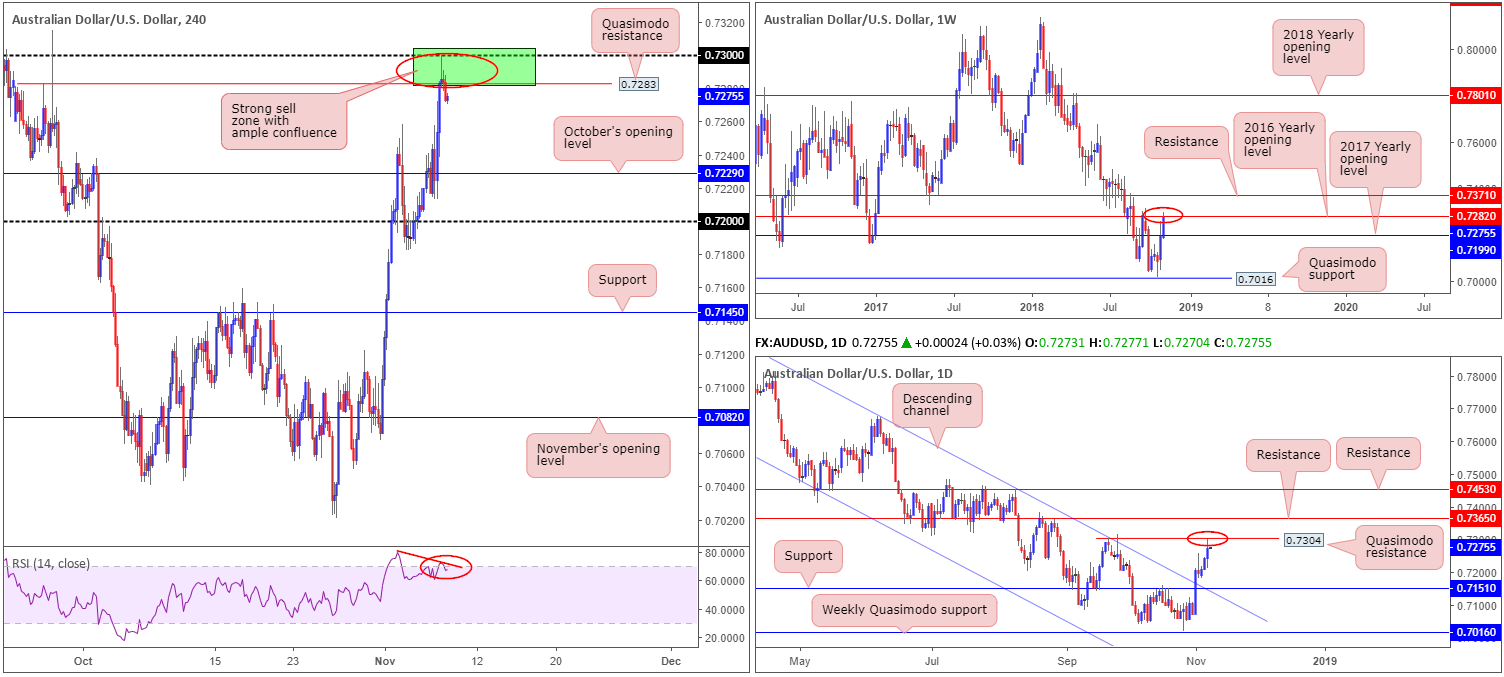
The AUD/USD found itself in 0.73 territory Wednesday, following a decline in the US dollar in wake of the US mid-term election results. For those who read Wednesday’s briefing, the piece drew the spotlight towards 0.7304/0.7282 as a possible sell zone: an area shaded green on the H4 timeframe.
Besides the H4 structure (the round number 0.73, Quasimodo resistance at 0.7283 and RSI divergence within overbought territory), having the 2016 yearly opening level at 0.7282 positioned nearby (weekly timeframe), and a daily Quasimodo resistance sited directly above 0.73 at 0.7304, added considerable weight, according to our technical reading. Well done to any of our readers who managed to jump aboard this move. In terms of take-profit targets, eyes will likely be on 0.7258 (Friday’s high) as possible support, followed then by October’s opening level mentioned above at 0.7229. Of course, price action could potentially push for a test of 0.72, as it merges with the next downside target on the weekly scale: the 2017 yearly opening level at 0.7199.
Areas of consideration:
Aside from the sell out of 0.7304/0.7282, there’s not really much else to hang our hat on at the moment.
Today’s data points: China trade balance; FOMC statement and interest rate decision.
USD/JPY:
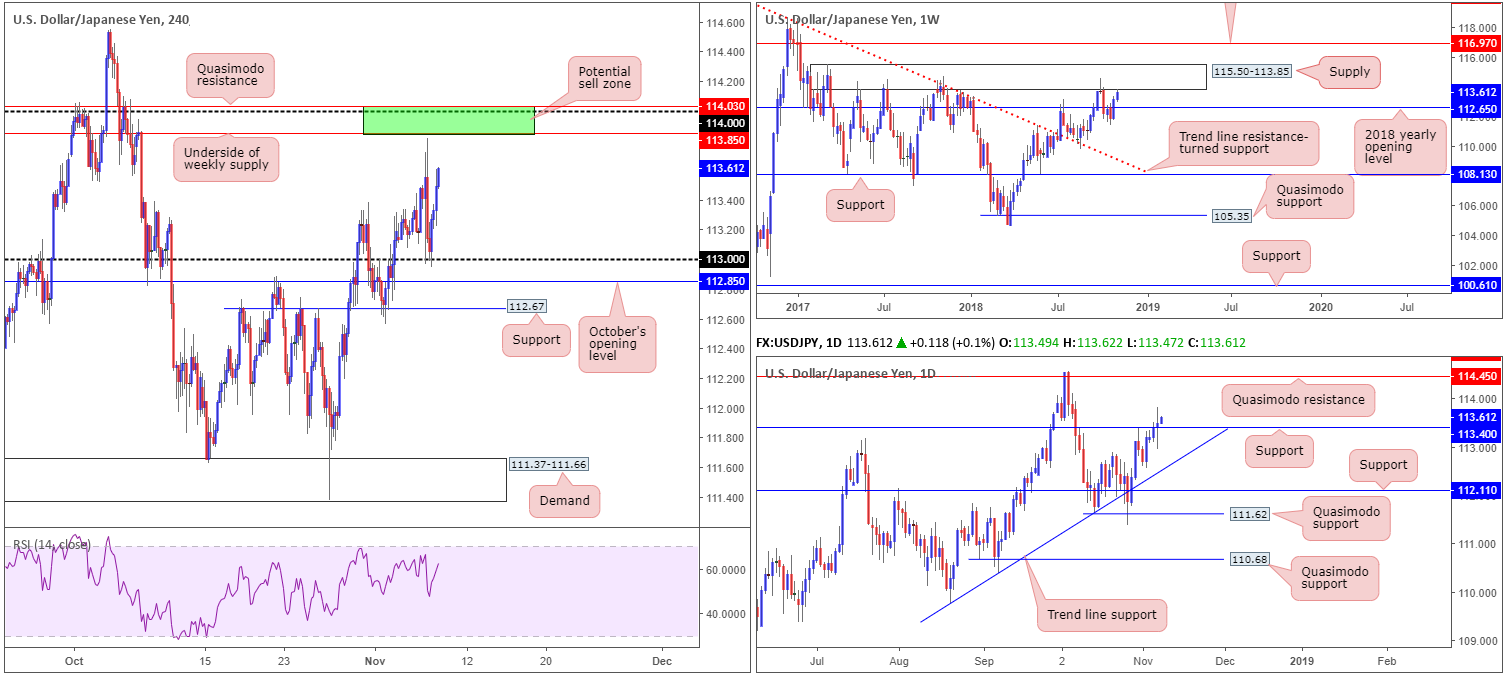
The US dollar concluded Wednesday’s session marginally higher against its Japanese counterpart, after reaching a peak of 113.81 amid the US mid-term election result
Recent buying brought weekly action within close proximity of supply at 115.50-113.85. Note this supply has incredibly strong history. Despite strong selling likely residing around the underside of this area, daily action overthrew resistance at 113.40, possibly clearing upside towards Quasimodo resistance at 114.45 (sited within the weekly supply).
In terms of Wednesday’s action on the H4 scale, the market found a floor of support off 113 and, at current price, appears poised to challenge 114.03/113.85. This area, shaded in green, is comprised of a Quasimodo resistance level at 114.03, a round number at 114 and the underside of the weekly supply zone at 113.85.
Areas of consideration:
On account of the above, the only area that stands out this morning is the H4 green zone marked at 114.03/113.85 for potential shorts. A H4 bearish candlestick pattern printed from within this region is a high-probability short in terms of the overall market picture (entry/stop parameters can be defined by the candlestick structure). Granted, a short from here does entail selling against possible daily buying, though do keep in mind weekly action generally takes precedence over daily flow.
The first take-profit target, as of writing, falls in around 113.40: the daily support.
Today’s data points: FOMC statement and interest rate decision.
USD/CAD:
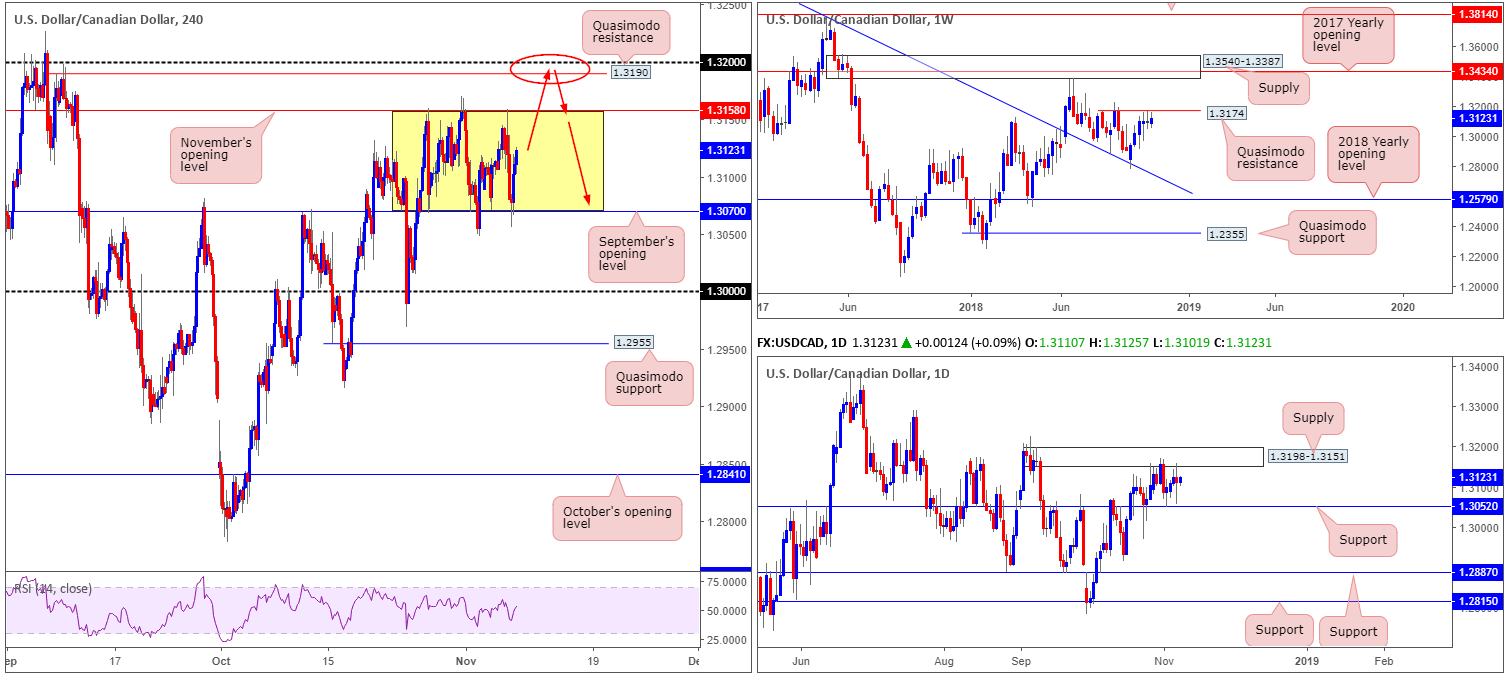
Since October 26 the H4 candles have been busy carving out a consolidation (yellow) between November’s opening level at 1.3158 and September’s opening level at 1.3070. Outside of this border, a Quasimodo resistance rests at 1.3190 (sited just south of the 1.32 handle), along with the key figure 1.30.
Supporting the H4 range, daily price is currently sandwiched between supply drawn from 1.3198-1.3151 and support coming in at 1.3052. Higher up on the curve, however, we have weekly price meandering beneath Quasimodo resistance plotted at 1.3174.
Areas of consideration:
Having seen weekly price hovering beneath a Quasimodo resistance, entering long is difficult. With that in mind, focus is drawn towards the H4 Quasimodo resistance at 1.3190 for possible shorting opportunities today (selling the top edge of the H4 range 1.3158 opens one up to a fakeout towards the weekly Quasimodo). Not only do we have the weekly Quasimodo resistance floating nearby, daily supply at 1.3198-1.3151 is in view as well (see above).
In terms of stop-loss order placement, above the daily supply edge (1.3198) appears a logical option, though do try to include the 1.32 handle here as well (conservative stops will likely be looking above the weekly Quasimodo apex [1.3226]). As for potential targets, November’s opening level mentioned above at 1.3158 appears a logical first step, followed by H4 support at 1.3070.
Today’s data points: FOMC statement and interest rate decision.
USD/CHF:
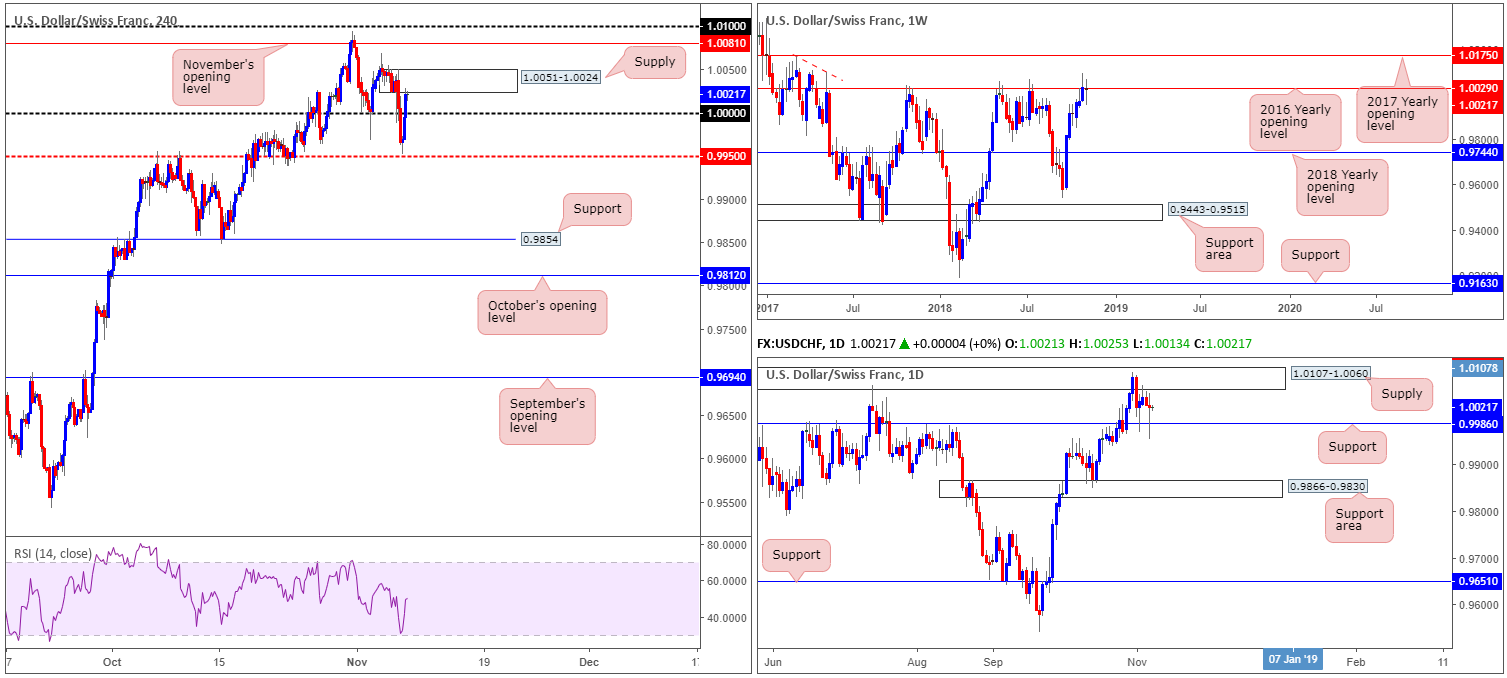
The results of the US midterm elections weighed heavily on the US dollar Wednesday, forcing the USD/CHF under parity (1.0000). Despite this, the move lower was short-lived. H4 action found active support just north of 0.9950 and reclaimed 1.0000+ status going into the close.
Currently in action, though, is a H4 supply zone drawn from 1.0051-1.0024, which could be enough to force price to retest 1.0000 today. The story on the weekly timeframe shows price action crossing swords with the 2016 yearly opening level at 1.0029. Note this level boasts incredibly strong history. In 2017 the base held price lower on two occasions and twice already in 2018. Therefore, a move lower from here should not come as much of a surprise. Daily flow, on the other hand, is crammed between supply at 1.0107-1.0060 and support coming in at 0.9986.
Areas of consideration:
Although weekly price portends lower prices, selling from the current H4 supply zone is a challenge. Aside from 1.0000 likely to offer support, a few pips south of here we have daily support at 0.9986 to contend with.
Based on the above reading, neither a long nor short seems attractive at this point. Irrespective of the direction one selects, considerable opposition is visible!
Today’s data points: FOMC statement and interest rate decision; (CHF) Gov board member Maechler speaks.
Dow Jones Industrial Average:
US equity indexes put in a solid performance following the outcome of the US mid-term elections yesterday, up over 2.00% on the day.
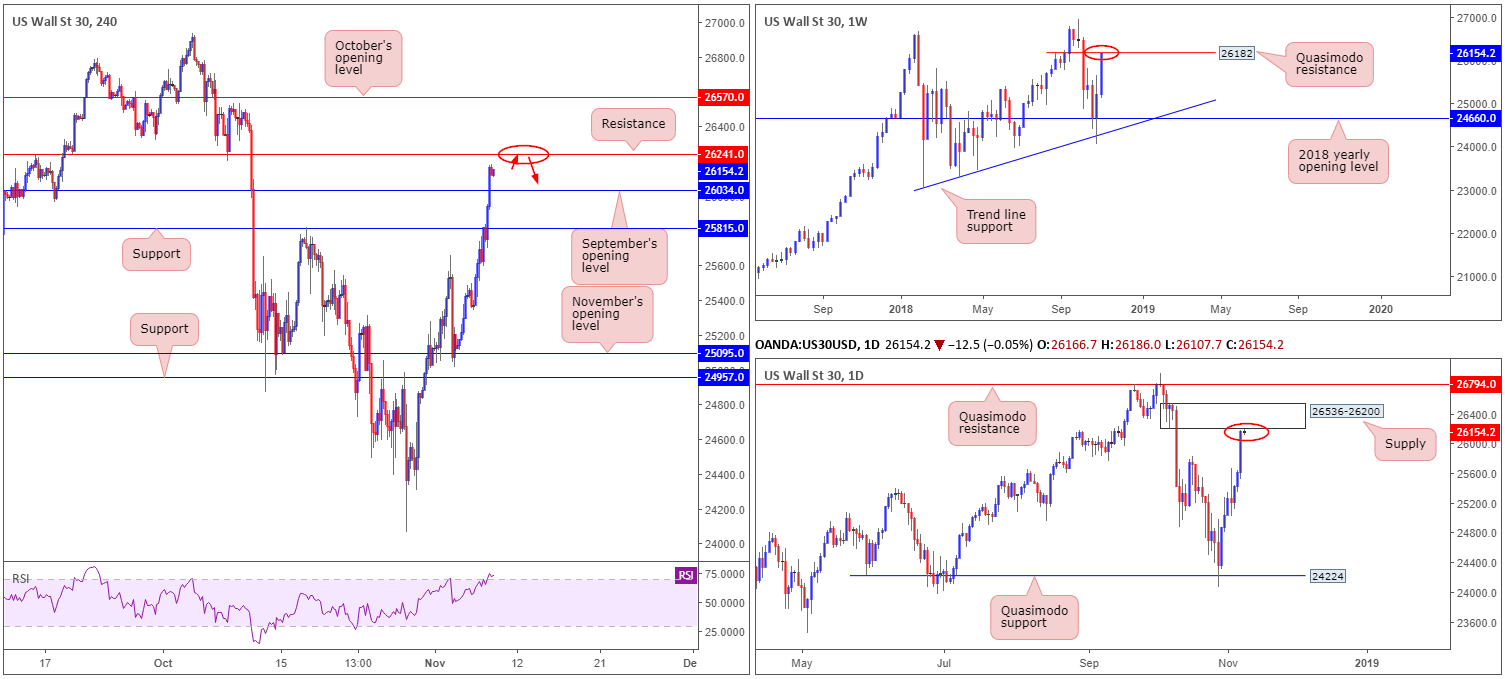
Recent buying lifted weekly price towards its Quasimodo resistance level at 26182. Overthrowing this barrier could eventually lead to fresh record highs being seen. Retreating to the daily timeframe, traders likely have their crosshairs fixed on supply coming in at 26536-26200. A break of this area has a Quasimodo resistance at 26794 to target.
Against the backdrop of higher-timeframe flows, H4 action is meandering between resistance at 26241 and September’s opening level at 26034. Above here, October’s opening level at 26570 is seen, whereas beneath 26034 nearby support rests at 25815. Also worth penciling in is the RSI indicator currently displaying a strong overbought reading.
Areas of consideration:
With higher timeframes displaying reasonably strong evidence the index may explore lower ground, a short from the H4 resistance mentioned above at 26241 is an option. Though given the possibility of a price faking above this to draw in more sellers within the current daily supply, traders might want to consider waiting for additional bearish candlestick confirmation to form prior to pressing the sell button (entry/stop parameters can be defined by the candlestick structure).
Today’s data points: FOMC statement and interest rate decision.
XAU/USD (Gold):
Despite the yellow metal ranging in excess of $13, the unit ended Wednesday’s segment all but unchanged. In view of this, much of the following piece will echo similar thoughts expressed in Yesterday’s report.
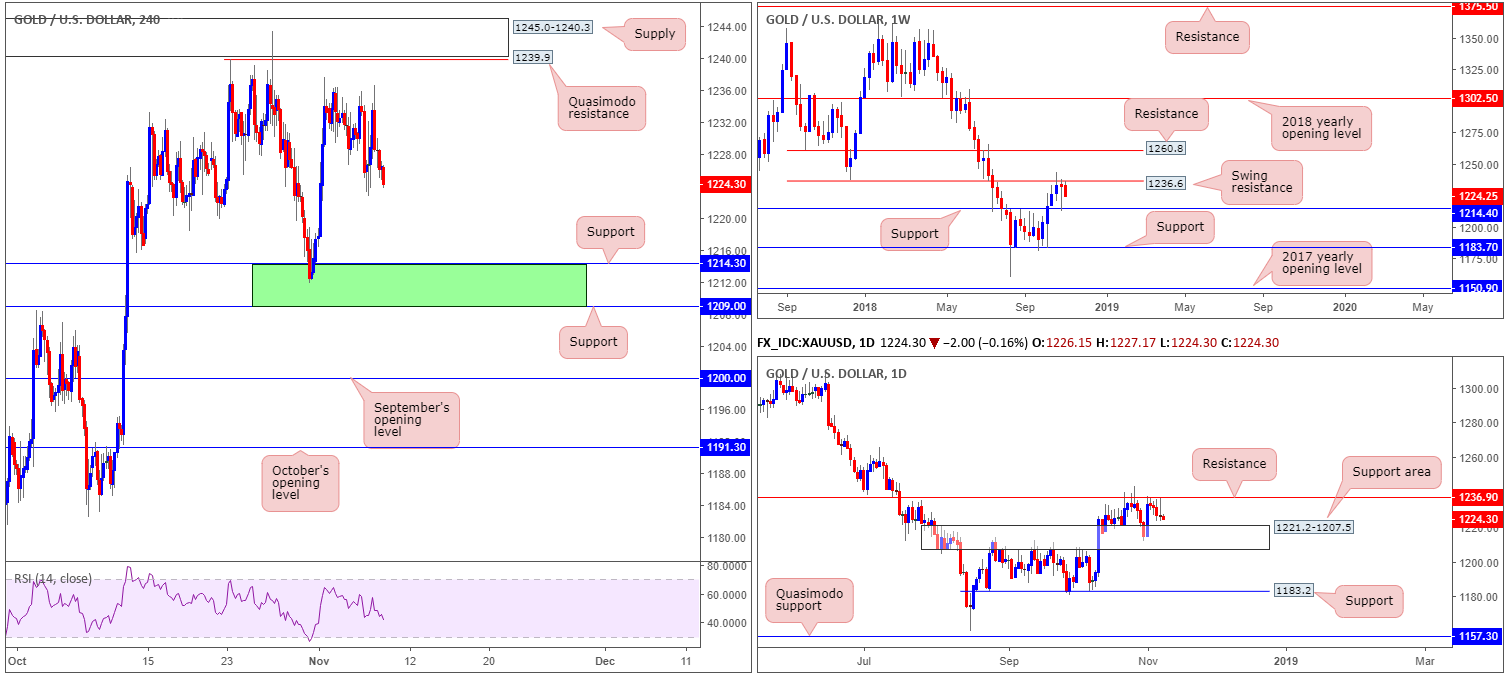
Bullion is seen moving lower off weekly swing resistance at 1236.9, with potential to decline as far south as support resting at 1214.4. A similar scenario is present on the daily timeframe. The yellow metal is seen consolidating between a support area at 1221.2-1207.5 (weekly support resides within this area) and resistance at 1236.9 (positioned a few pips above the weekly swing resistance level).
On the H4 timeframe, our technical reading shows the metal hovering between a Quasimodo resistance level at 1239.9/supply at 1245.0-1240.3 and two layers of support at 1214.3/ 1209.0.
Areas of consideration:
With hefty resistance observed on the higher timeframes around the 1236ish neighbourhood, and H4 price displaying room to push lower, all three timeframes suggest further downside may be in the offing.
Unfortunately, there’s limited structure to base a short from on the H4 timeframe. Therefore, focus turns to possible longs out of the green shaded zone on the H4 at 1209.0/1214.3: two H4 supports that have strong connections to the current higher-timeframe supports.
Aggressive traders looking to enter long at 1214.3 and place stops beneath 1209.0 should remain aware of the possibility of a fakeout into the daily support area, given its lower base is limited by 1207.5. For conservative traders, waiting for additional candle confirmation is an alternative (entry/stop parameters can be defined by the candlestick structure).
The use of the site is agreement that the site is for informational and educational purposes only and does not constitute advice in any form in the furtherance of any trade or trading decisions.
The accuracy, completeness and timeliness of the information contained on this site cannot be guaranteed. IC Markets does not warranty, guarantee or make any representations, or assume any liability with regard to financial results based on the use of the information in the site.
News, views, opinions, recommendations and other information obtained from sources outside of www.icmarkets.com.au, used in this site are believed to be reliable, but we cannot guarantee their accuracy or completeness. All such information is subject to change at any time without notice. IC Markets assumes no responsibility for the content of any linked site. The fact that such links may exist does not indicate approval or endorsement of any material contained on any linked site.
IC Markets is not liable for any harm caused by the transmission, through accessing the services or information on this site, of a computer virus, or other computer code or programming device that might be used to access, delete, damage, disable, disrupt or otherwise impede in any manner, the operation of the site or of any user’s software, hardware, data or property.


