
EUR/USD:
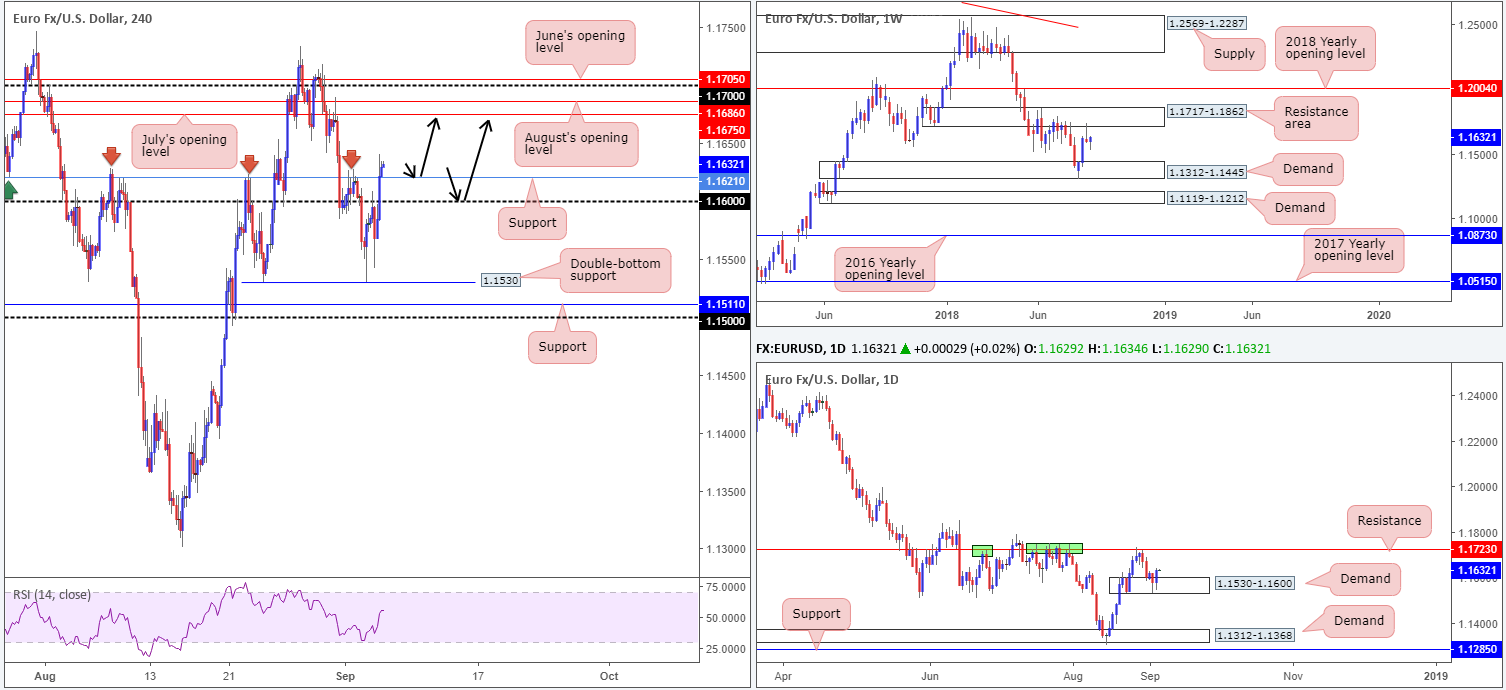
Demand for the single currency intensified on Wednesday amid headlines indicating Germany and the UK were said to have dropped key demands on Brexit in order to facilitate an agreement. The euro, which clocked lows of 1.1542 in early London trade, ended the segment shaking hands with highs of 1.1640 as the US dollar lost its safe-haven appeal.
According to the overall picture, the market may experience additional upside today. The H4 candles, currently seen trading firmly above a key H4 resistance (now acting support) at 1.1621, shows room to press as far north as 1.1675: July’s opening level, followed closely by August’s opening level at 1.1686, the 1.17 handle and then June’s opening level at 1.1705. Further adding to this, the RSI is seen trading above its center line, emphasizing a strong market at the moment.
On wider perspective, daily activity is establishing solid ground out of demand coming in at 1.1530-1.1600, poised to potentially challenge 1.1723: a key resistance. In terms of where we stand on the weekly timeframe, structure shows price meandering between a resistance area at 1.1717-1.1862 (holds the noted daily resistance level within its lower limits) and a demand zone penciled in at 1.1312-1.1445.
Areas of consideration:
Based on the above reading, a potential retest play may be in the offing today from either the H4 support at 1.1621 or the 1.16 handle (see black arrows). Aggressive traders will likely enter at market with stops tucked a few pips beneath their chosen support, whereas conservative traders may opt to enter on a bullish candlestick formation.
The initial upside target from either support stands at July’s opening level mentioned above at 1.1675, and has an ultimate target at 1.1723: the current daily resistance. By that time, active selling is expected to materialize since the unit will also be touching gloves with a weekly resistance zone at 1.1717-1.1862.
Today’s data points: US ADP non-farm employment change; US ISM non-manufacturing PMI; FOMC member Williams speaks.
GBP/USD:
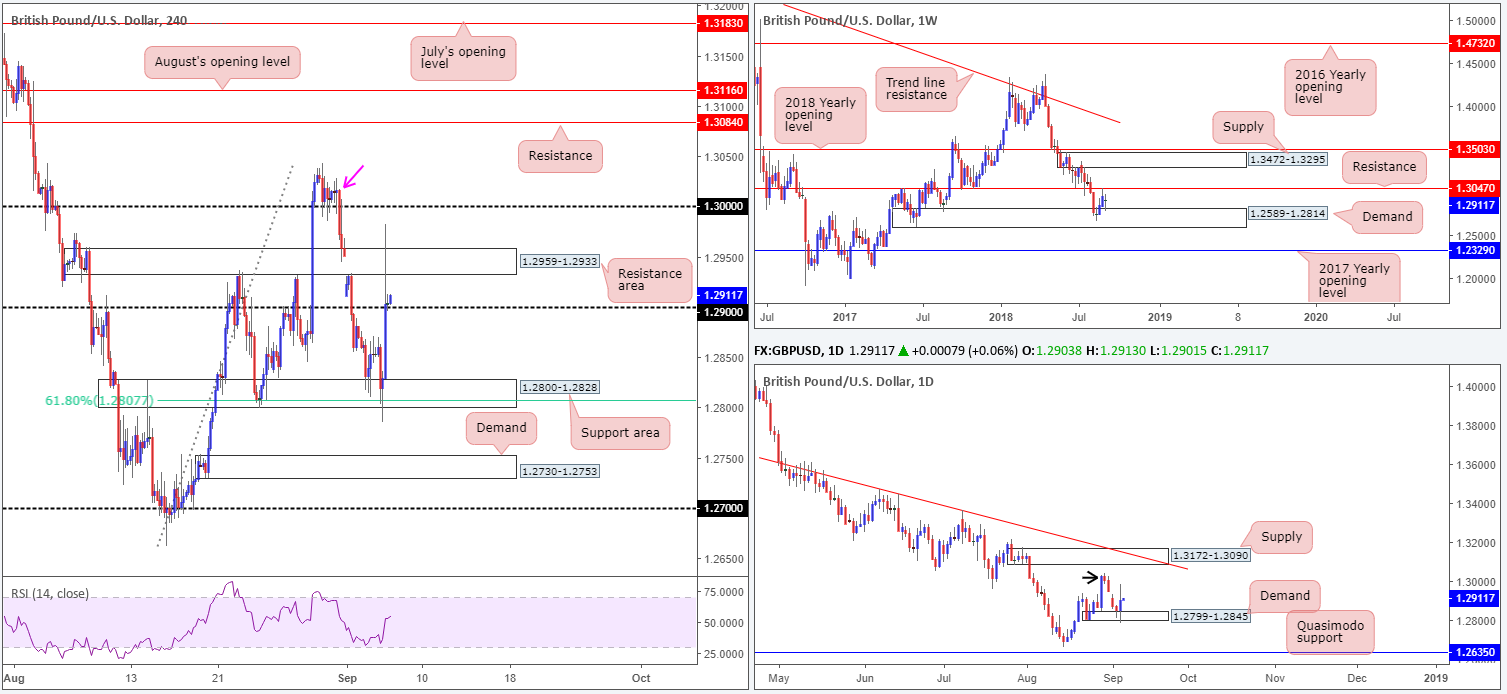
It was quite a day in the GBP/USD market on Wednesday amid seemingly positive Brexit-related news flow.
During London hours, the pair explored levels beneath a H4 support area at 1.2800-1.2828 as risk aversion dominated the markets. As US traders opened their doors for business, however, sterling recovered strongly as Germany and the UK were said to have dropped key demands on Brexit. Price reached highs of 1.2982 on the news, though failed to sustain gains as German officials lent back on the story, saying Berlin has not changed on Brexit and Germany has full trust in Chief European Union Negotiator Michel Barnier. The day ended with the unit retesting ground around the 1.29 handle.
On the technical front, weekly action is currently emphasizing an indecisive tone at the moment, as the unit loiters between resistance at 1.3047 and demand drawn from 1.2589-1.2814. Daily price, on the other hand, remains buoyant above demand at 1.2799-1.2845 (glued to the top edge of the current weekly demand). While we expect sellers to be interested in the August 30 high at 1.3042 (black arrow), the ultimate upside objective on this scale falls in around a supply zone at 1.3172-1.3090, which happens to converge with a trend line resistance (etched from the high 1.3472). Meanwhile, the H4 candles are, at the time of writing, defending 1.29. Intraday selling activity is expected to emerge from the nearby resistance area at 1.2959-1.2933, despite yesterday’s spike through it.
Areas of consideration:
Longer term, there is not much to really hang one’s hat on right now in regard to tradable levels.
Intraday (we’re referring to the H4 here), nevertheless, shines the spotlight on the key figure 1.30 given it converges with a strong H4 supply marked with a pink arrow at 1.3028-1.2992. This also happens to line up closely with the August 30 high at 1.3042 highlighted on the daily timeframe. As a result, it could be worth keeping an eyeball on 1.30 for possible shorting opportunities should price challenge this number.
Today’s data points: US ADP non-farm employment change; US ISM non-manufacturing PMI; FOMC member Williams speaks.
AUD/USD:
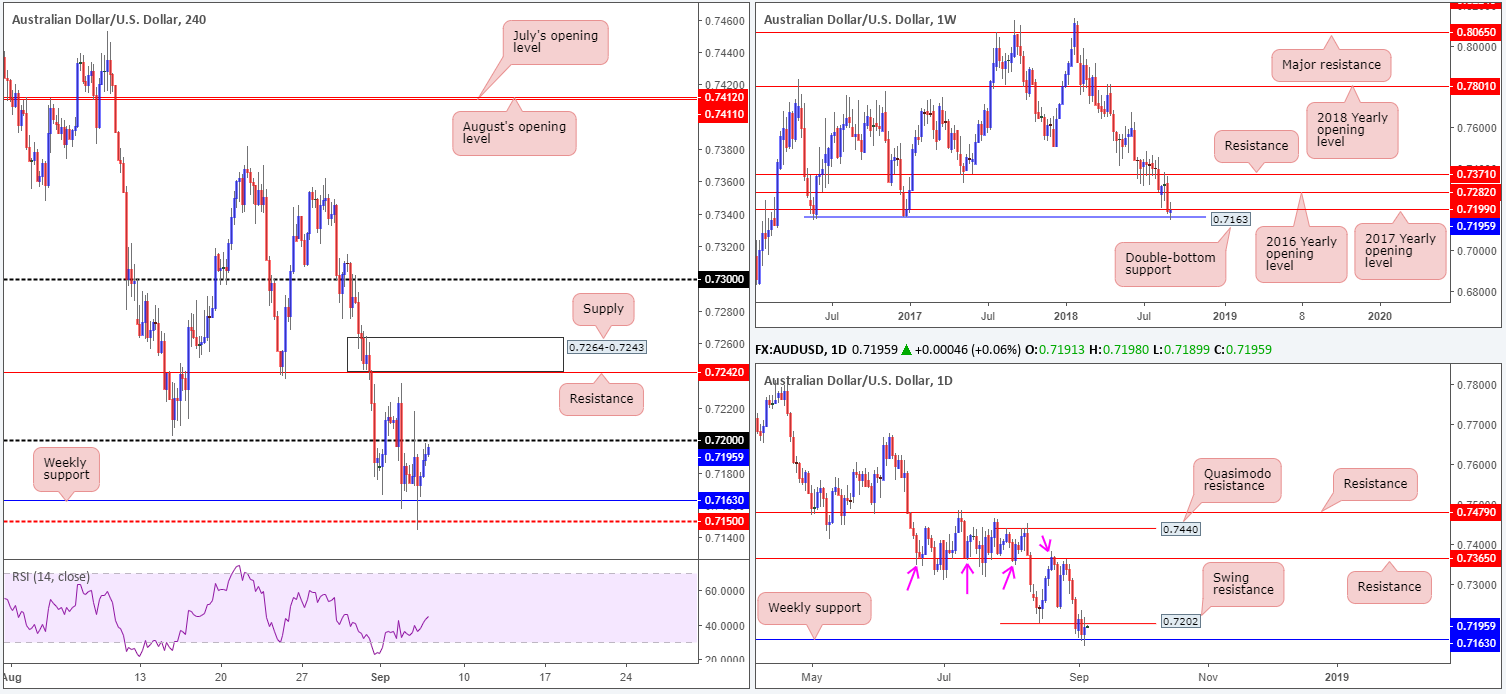
In the early hours of trade on Wednesday, Australian GDP for Q2 exceeded analyst expectations, consequently sending the commodity currency to higher ground. The move, however, was a short-lived one after Asian equities slid lower, and China’s PMIs came in soft.
The weekly double-bottom support at 0.7163, as you can see, continues to provide this market a floor to trade from. This is quite a level considering we have interested sellers from the 0.72 handle on the H4 timeframe, which happens to be bolstered by the 2017 yearly opening level on the weekly timeframe at 0.7199, and also a clear swing resistance on the daily timeframe at 0.7202.
Areas of consideration:
According to our technical reading, the AUD/USD pendulum could still potentially swing either way today!
To our way of seeing things, though, the sellers may have the upper hand here, despite an earnest attempt seen to hold the current weekly double-bottom support. Not only are we entrenched within a dominant downtrend at the moment, we know there are a number of key factors supporting the sellers (see 1-3 above).
Although the case for selling is strong, waiting for the weekly double-bottom support to be taken out before pulling the trigger would be the safer approach here – long term that is.
Intraday sellers could try their hand at shorting off 0.72 today, though waiting for additional bearish candle confirmation (think pin bars, engulfing candles etc.) will likely help avoid an unnecessary loss. The only downside target from here right now, of course, falls in at 0.7163.
Today’s data points: Australian trade balance; US ADP non-farm employment change; US ISM non-manufacturing PMI; FOMC member Williams speaks.
USD/JPY:
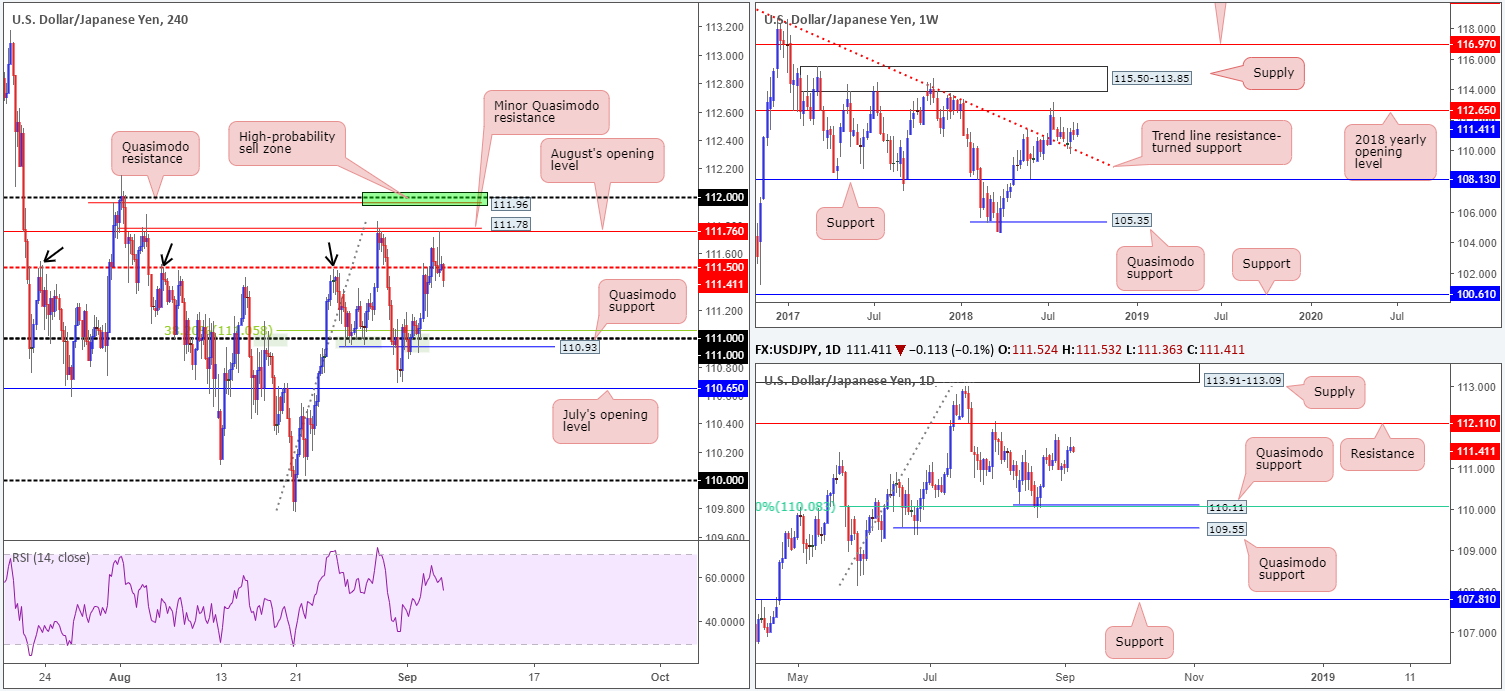
While the US dollar faded on recent Brexit headlines that triggered a sharp advance in both euro and GBP markets, the USD/JPY wrapped up the day in positive territory.
As shown on the H4 timeframe, price action crossed swords with the underside of August’s opening level at 111.76 and is currently trading marginally beneath 111.50. A decisive H4 close below here could set the stage for further selling, targeting the 111 handle, which, as you can see, has proven to be a notable support/resistance level since mid-August (grey boxes). Traders may have also noticed 111 is positioned nearby a Quasimodo support at 110.93 and a 38.2% Fib support at 111.05.
The story on the daily timeframe shows a clear-cut bearish pin-bar formation took shape yesterday, though appears to have formed in no man’s land on this scale. Up on the weekly timeframe, weekly flow remains in a dominant position, as far as we can see, poised to stretch as far north as the 2018 yearly opening level at 112.65.
Areas of consideration:
In the event sellers continue pressing lower sub 111.50 today, a bounce from the 111 handle (in light of its local confluence) is possible. Why only a bounce is expected simply comes down to the fact the H4 supports lack higher-timeframe confluence. Conservative traders will likely have stops planted beneath the H4 Quasimodo support apex at 110.68, while aggressive traders will look for a tighter range around the 110.84ish mark.
Today’s data points: US ADP non-farm employment change; US ISM non-manufacturing PMI; FOMC member Williams speaks.
USD/CAD:
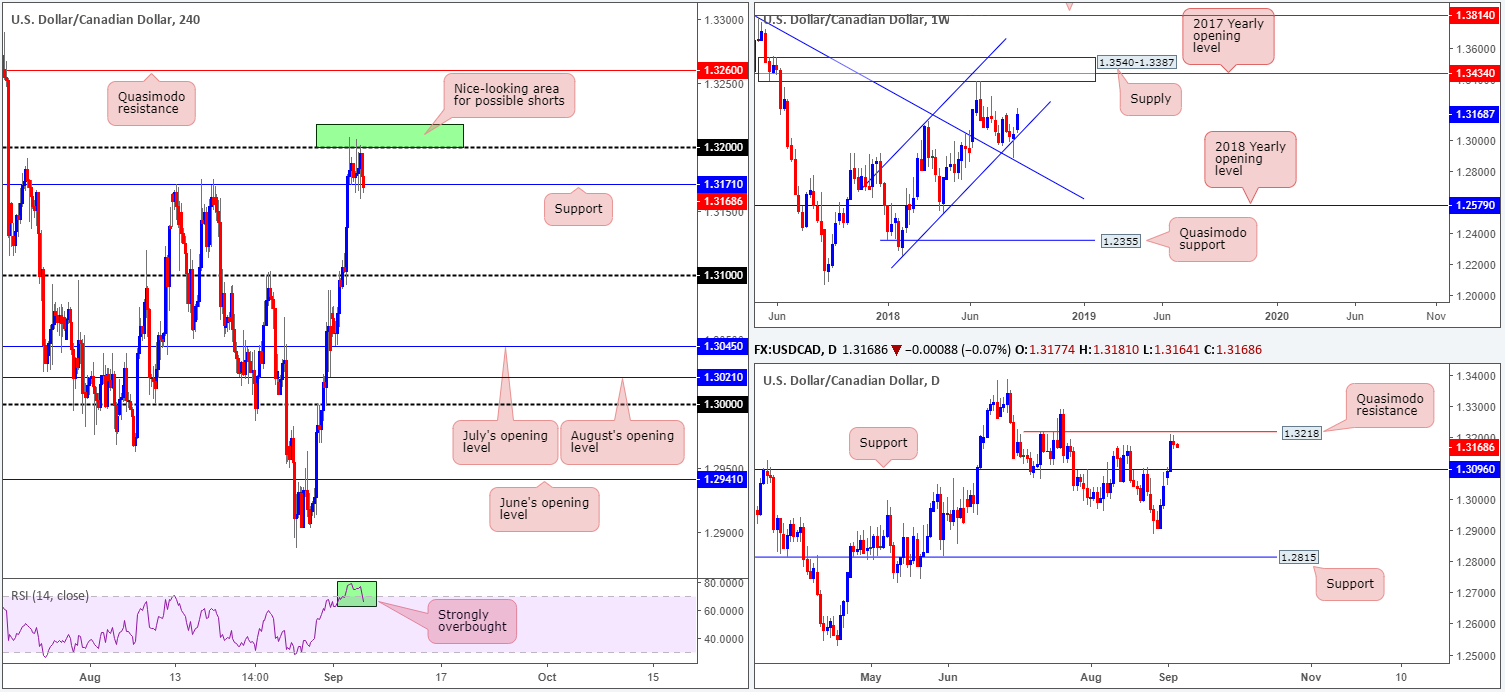
In similar fashion to the USD/JPY, the USD/CAD market was somewhat lackluster on Wednesday. There was some upside observed after the BoC stood pat on rates, though gains were fleeting.
For those who read Wednesday’s morning briefing you may recall the team highlighted the 1.3218/1.32 green H4 zone as a potential area for shorts (comprised of a daily Quasimodo resistance level and a round number). As we write, price is seen fading the aforementioned zone and appears to be on course to register a H4 close beneath nearby H4 support at 1.3171. A decisive close beneath this boundary will likely open the gates for a possible approach towards the 1.31 handle, followed closely by daily support at 1.3096.
The only drawback to shorting this market can be seen on the weekly scale: weekly price displays room to press as far north as supply coming in at 1.3540-1.3387, which happens to house the 2017 yearly opening level at 1.3434.
Areas of consideration:
In the event H4 price closes beneath the current H4 support level at 1.3171, and shortly after follows up with a retest as resistance in the shape of a bearish candlestick formation (stop-loss orders best placed above the rejecting candle’s wick), selling this market down to 1.31 could be an option. Constant monitoring is recommended, however, given where the market is trading from on the weekly timeframe.
Today’s data points: US ADP non-farm employment change; US ISM non-manufacturing PMI; FOMC member Williams speaks; CAD Gov. Council member Wilkins speaks; Crude oil inventories.
USD/CHF:
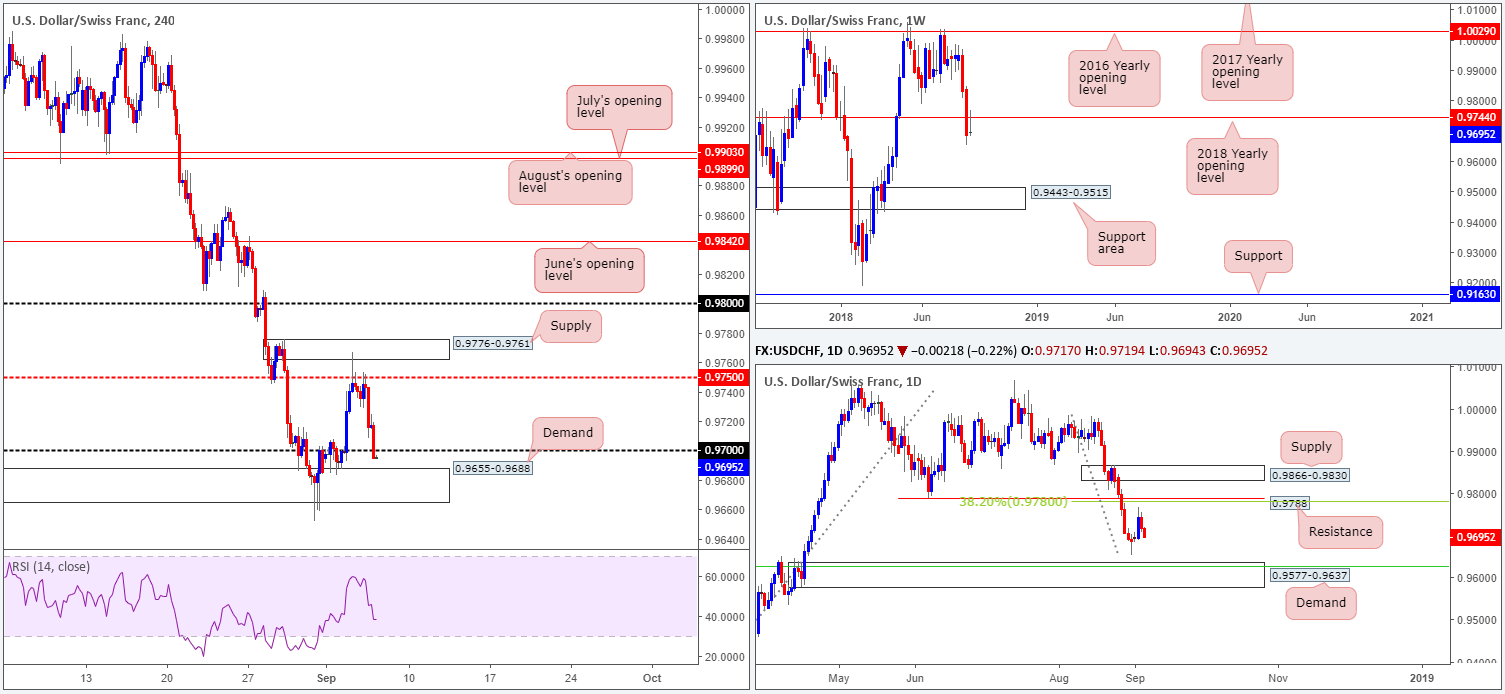
Broad-based dollar selling, as you can see, pressured the USD/CHF to lower ground on Wednesday. Following a retest of 0.9750, the pair drove south and finished the day closing just north of the 0.97 handle on the H4 timeframe. 0.9750 was a noted level to watch for shorts in yesterday’s morning briefing, so well done to any of our readers who managed to jump aboard this move!
In recent hours, however, the H4 candles crossed below the 0.97 handle and is now facing nearby demand at 0.9655-0.9688. Traders should note this demand base had its lower edge taken out last Friday in the shape of back-to-back buying tails, possibly weakening the area.
Turning our attention to the bigger picture, we can see weekly price retested the underside of the 2018 yearly opening level at 0.9744 in recent trade, following last week’s strong break to the downside. This is considered a strong barrier of resistance, so don’t make the mistake of overlooking it. In terms of daily movement, the next upside objective on the radar can be seen at a swing resistance drawn from 0.9788, which happens to be bolstered by a nearby 38.2% Fib resistance value at 0.9780, whereas a move lower has demand at 0.9577-0.9637 to target (fuses with a 50.0% support value at 0.9627 [green line]).
Areas of consideration:
In view of both weekly and daily timeframes suggesting further selling may be in the offing, along with a potentially fragile H4 demand base seen just beneath current price, selling from the underside of 0.97 could be something to consider today. Playing the retest conservatively is recommended, however. A retest of 0.97 in the form of a bearish candlestick formation (either on the H4 timeframe or lower) would, according to the overall picture, is likely be enough to indicate lower prices.
For those interested in selling 0.97, stops are best positioned according to the bearish candlestick formation. As for downside targets, reducing risk to breakeven on a H4 close below the lower edge of nearby H4 demand at 0.9655 could be an idea. Following this, eyes will likely be on the daily demand base mentioned above at 0.9577-0.9637.
Today’s data points: US ADP non-farm employment change; US ISM non-manufacturing PMI; FOMC member Williams speaks; CHF Gov. board member Zurbrugg speaks.
Dow Jones Industrial Average:
US equities failed to print anything meaningful on Wednesday, as traders remain hesitant amid uncertainty surrounding NAFTA negotiations and the US-China trade conflict.
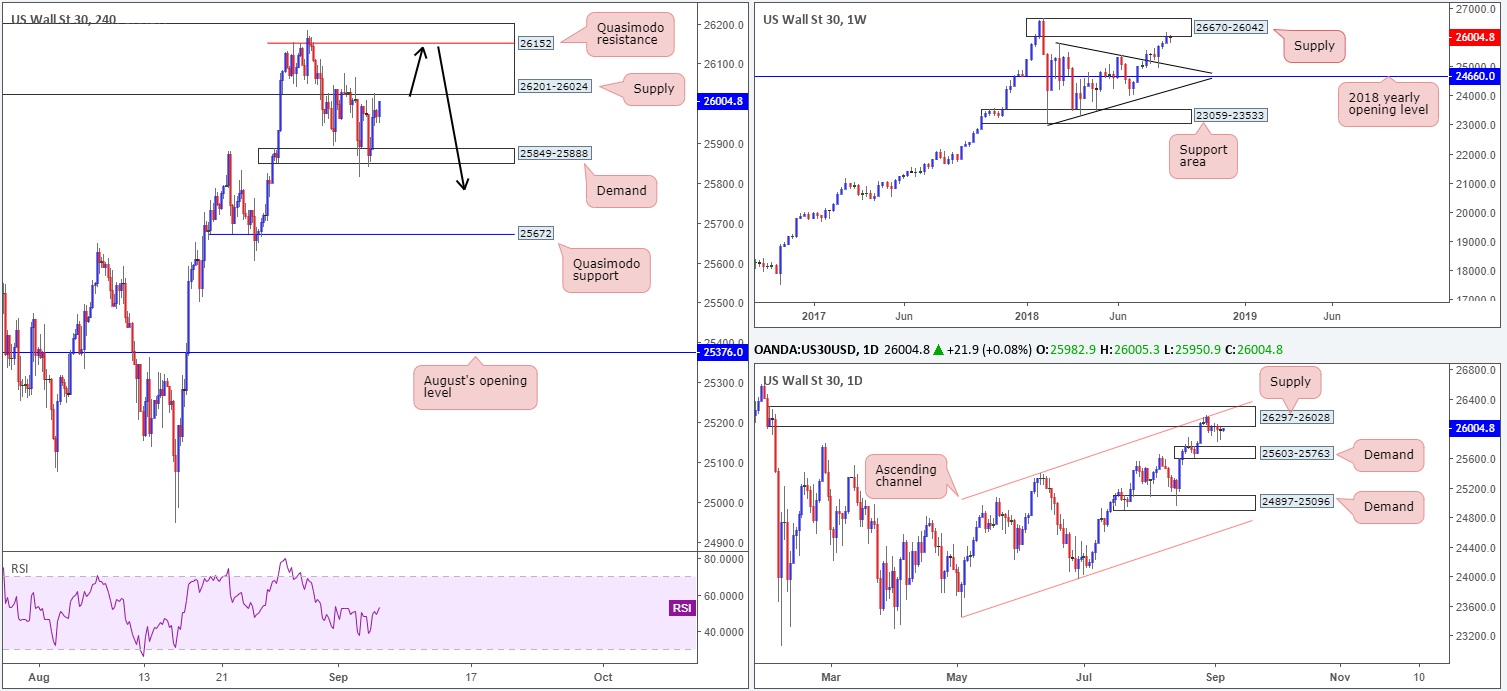
H4 price continues to loiter between a rather large supply area at 26201-26024 and a demand base coming in at 25849-25888. Also worth noting is the current H4 demand was taken out on Tuesday, potentially clearing the path south towards the H4 Quasimodo support level at 25672.
Meanwhile, higher up on the curve, the bigger picture remains pretty much unchanged. Although the DJIA registered its third consecutive weekly gain last week, traders may have noticed price recently engaged with the lower edge of a weekly supply at 26670-26042, following a strong retest off a weekly trend line resistance-turned support (etched from the high 25807) a few weeks back.
In terms of the daily timeframe, strong supply at 26297-26028 remains in the fold. What gives this area credibility comes down to the following:
- Downside momentum drawn from the base is incredibly strong.
- The zone intersects with a daily channel resistance (taken from the high 25399).
- Glued to the underside of the aforesaid weekly supply area.
Areas of consideration:
As the current H4 supply at 26201-26024 is enormous, entering short from the H4 Quasimodo resistance level seen within the upper limits of the area at 26152 could be something to consider (see black arrows). This gives traders the option of positioning stops above the overall H4 supply (while keeping risk/reward in check), targeting the H4 demand area mentioned above at 25849-25888 as the initial take-profit zone, followed then by the top edge of daily demand at 25603-25763 (next downside target on the daily scale) and then the aforementioned H4 Quasimodo support level.
Today’s data points: US ADP non-farm employment change; US ISM non-manufacturing PMI; FOMC member Williams speaks.
XAU/USD (Gold):
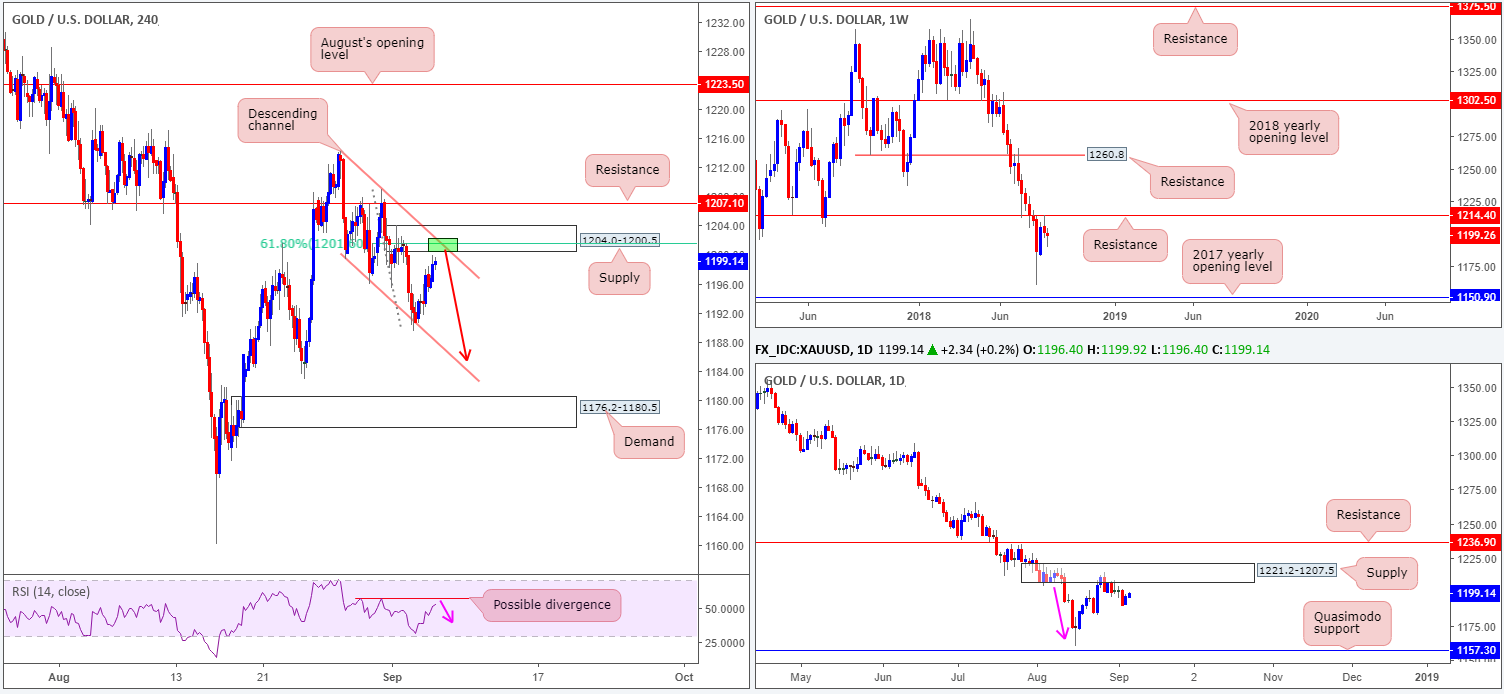
As the USD heads for lower ground, the price of gold recently stamped in a bottom off a H4 channel support (extended from the low 1199.4), and is now seen fast approaching a H4 supply zone at 1204.0-1200.5. What’s appealing about this area is the fact it converges with a H4 channel resistance (taken from the high 1214.3) and a 61.8% H4 Fib resistance value at 1201.5. In addition to this, the H4 RSI indicator is displaying a possible divergence play just ahead.
In terms of the higher timeframes, weekly price continues to hold beneath resistance at 1214.4, with room seen to press much lower. Also worth taking on board is the fact that we’re also coming from a daily supply zone at 1221.2-1207.5, which actually houses the noted weekly resistance within its walls. Overall, it’s unlikely to observe serious buying pressure enter the market on the bigger scale until we touch gloves with the August 16 low 1160.3, shadowed closely by the daily Quasimodo support at 1157.3.
Areas of consideration:
Keeping it simple this morning, the H4 supply area at 1204.0-1200.5 appears a reasonable location to be looking for shorting opportunities, according to the technicals. Ultimately, the point at where the H4 channel resistance and 61.8% Fib resistance intersect (green zone) is attractive.
Traders looking to take an aggressive approach here will likely set stop-loss orders above the H4 supply itself. Conservative traders, on the other hand, may opt to wait and see how candle action behaves once the area is in play, and enter on the back of a bearish candlestick formation. Regardless of the approach, though, the initial downside target from the current supply falls in at the noted H4 channel support.
The use of the site is agreement that the site is for informational and educational purposes only and does not constitute advice in any form in the furtherance of any trade or trading decisions.
The accuracy, completeness and timeliness of the information contained on this site cannot be guaranteed. IC Markets does not warranty, guarantee or make any representations, or assume any liability with regard to financial results based on the use of the information in the site.
News, views, opinions, recommendations and other information obtained from sources outside of www.icmarkets.com.au, used in this site are believed to be reliable, but we cannot guarantee their accuracy or completeness. All such information is subject to change at any time without notice. IC Markets assumes no responsibility for the content of any linked site. The fact that such links may exist does not indicate approval or endorsement of any material contained on any linked site.
IC Markets is not liable for any harm caused by the transmission, through accessing the services or information on this site, of a computer virus, or other computer code or programming device that might be used to access, delete, damage, disable, disrupt or otherwise impede in any manner, the operation of the site or of any user’s software, hardware, data or property.


