
Waiting for lower timeframe confirmation is our main tool to confirm strength within higher timeframe zones, and has really been the key to our trading success. It takes a little time to understand the subtle nuances, however, as each trade is never the same, but once you master the rhythm so to speak, you will be saved from countless unnecessary losing trades. The following is a list of what we look for:
- A break/retest of supply or demand dependent on which way you’re trading.
- A trendline break/retest.
- Buying/selling tails/wicks – essentially we look for a cluster of very obvious spikes off of lower timeframe support and resistance levels within the higher timeframe zone.
- Candlestick patterns. We tend to stick with pin bars and engulfing bars as these have proven to be the most effective.
We typically search for lower-timeframe confirmation between the M15 and H1 timeframes, since most of our higher-timeframe areas begin with the H4. Stops are usually placed 1-3 pips beyond confirming structures.
EUR/USD:
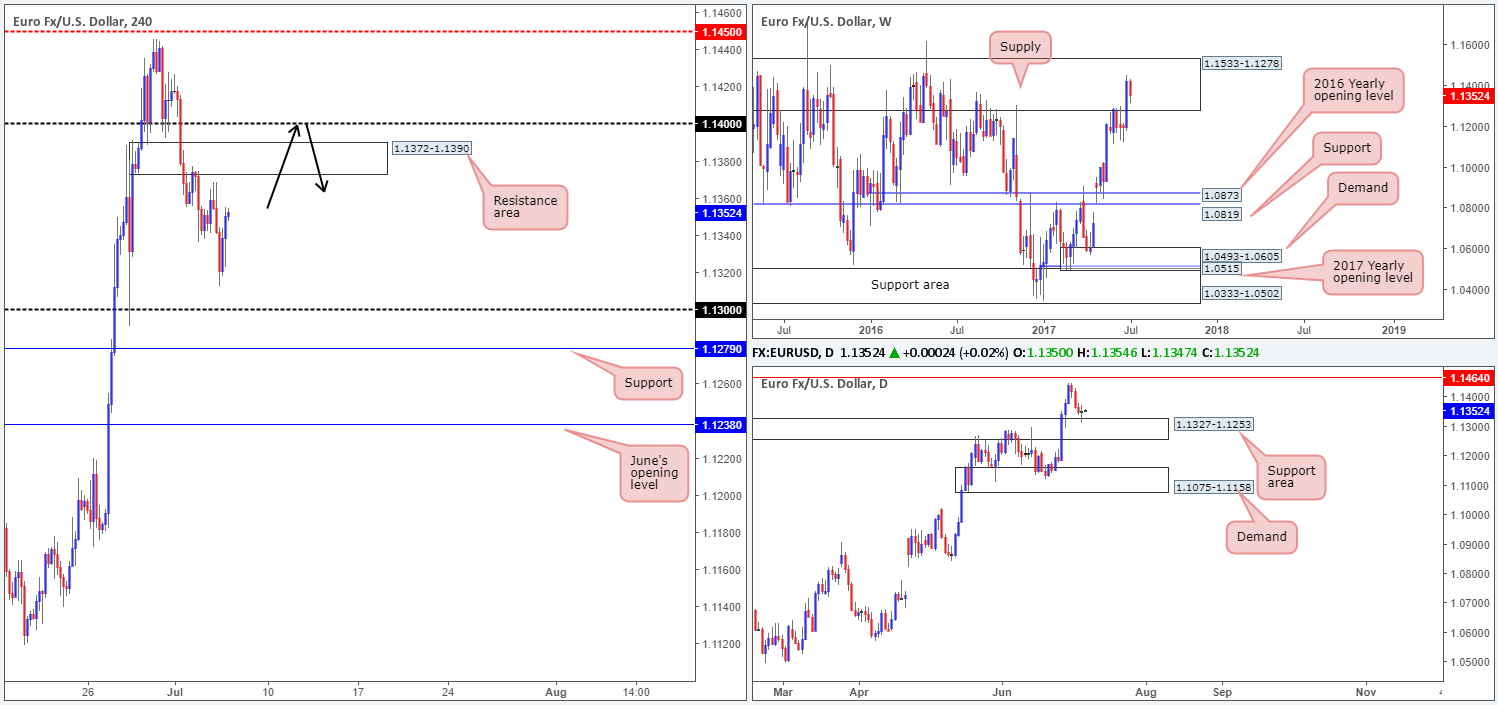
EUR/USD prices are little changed this morning. As such, weekly flow remains loitering within the walls of a major supply zone drawn from 1.1533-1.1278 that has capped upside since May 2015. Daily action on the other hand, shows that the major connected with the top edge of a support area drawn from 1.1327-1.1253 during yesterday’s trading, and chalked up a clear-cut indecision candle.
Having seen the daily candles recently challenge a support area, the likelihood of H4 price retesting the resistance area at 1.1372-1.1390 today is high. In addition to this, with the weekly chart suggesting that this market may continue to push lower, a trade from this H4 area may still be worthy of attention, even though we’re bouncing off a daily zone.
Our suggestions: Given daily bulls may come into the picture today; this could force H4 flow to fake above the resistance area and tag in offers positioned around the 1.14 handle lurking above. Therefore, we would not recommend placing limit orders around the zone.
In light of the circumstances, we would only trade this market short if H4 price whipsawed above 1.1372-1.1390, tapped 1.14, and then closed back within the said area (a pin-bar formation). This move would trigger stops/breakout buyers’ orders lurking above 1.1372-1.1390 and likely provide the big boys enough liquidity to short from 1.14, which is what we want to be a part of!
Data points to consider: US ADP non-farm employment change at 1.15pm, US Weekly unemployment claims and US trade balance figures at 1.30pm, US ISM non-manufacturing PMI and FOMC member Powell speaks at 3pm GMT+1.
Levels to watch/live orders:
- Buys: Flat (stop loss: N/A).
- Sells: 1.1372-1.1390 – Ideally looking for price to fake this area and connect with 1.14 before a sell is permitted (stop loss: beyond the fakeout candle’s wick).
GBP/USD:
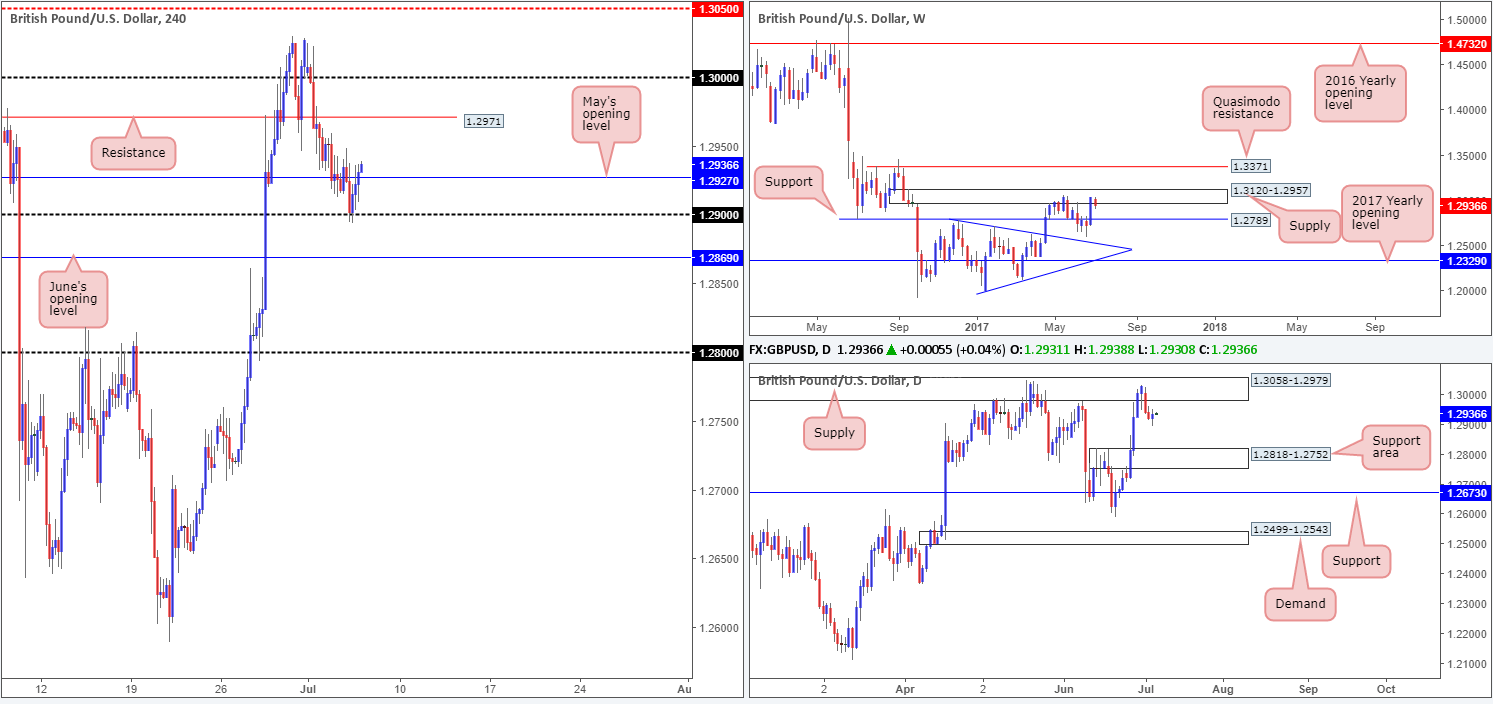
Despite yesterday’s bounce off the 1.29 handle, as well as a recent close back above May’s opening level at 1.2927, our team’s bias remains firmly tilted to the downside. Our reasoning largely comes from the higher-timeframe picture. The weekly timeframe reveals that price is seen trading from supply pegged at 1.3120-1.2957. In addition to this, the pair is also seen interacting with a daily supply zone at 1.3058-1.2979, which is essentially a partner supply to the aforementioned weekly area.
In spite of the bigger picture indicating that further selling may be at hand, selling this market at the moment would involve shorting into H4 supports at 1.2927/1.29/1.2869.Technically speaking, the path south would only be clear for selling once June’s opening level at 1.2869 is cleared. According to H4 structure, the 1.28 handle would then likely be the next hurdle on the hit list. Nevertheless, traders will need to be prepared for price to stall/reverse ahead of this number since let’s remember that the top edge of a daily support area is located at 1.2818.
Our suggestions: A H4 close beyond 1.2869, followed up with a retest as resistance and a lower-timeframe confirming sell signal (see the top of this report) would, in our opinion, be enough to justify a sell in this market, targeting 1.2818, followed closely by the 1.28 handle.
Data points to consider: US ADP non-farm employment change at 1.15pm, US Weekly unemployment claims and US trade balance figures at 1.30pm, US ISM non-manufacturing PMI and FOMC member Powell speaks at 3pm GMT+1.
Levels to watch/live orders:
- Buys: Flat (stop loss: N/A).
- Sells: Watch for H4 price to engulf 1.2869 and then look to trade any retest seen thereafter ([waiting for a lower-timeframe confirming sell signal to form following the retest is advised] stop loss: dependent on where one confirms the level).
AUD/USD:
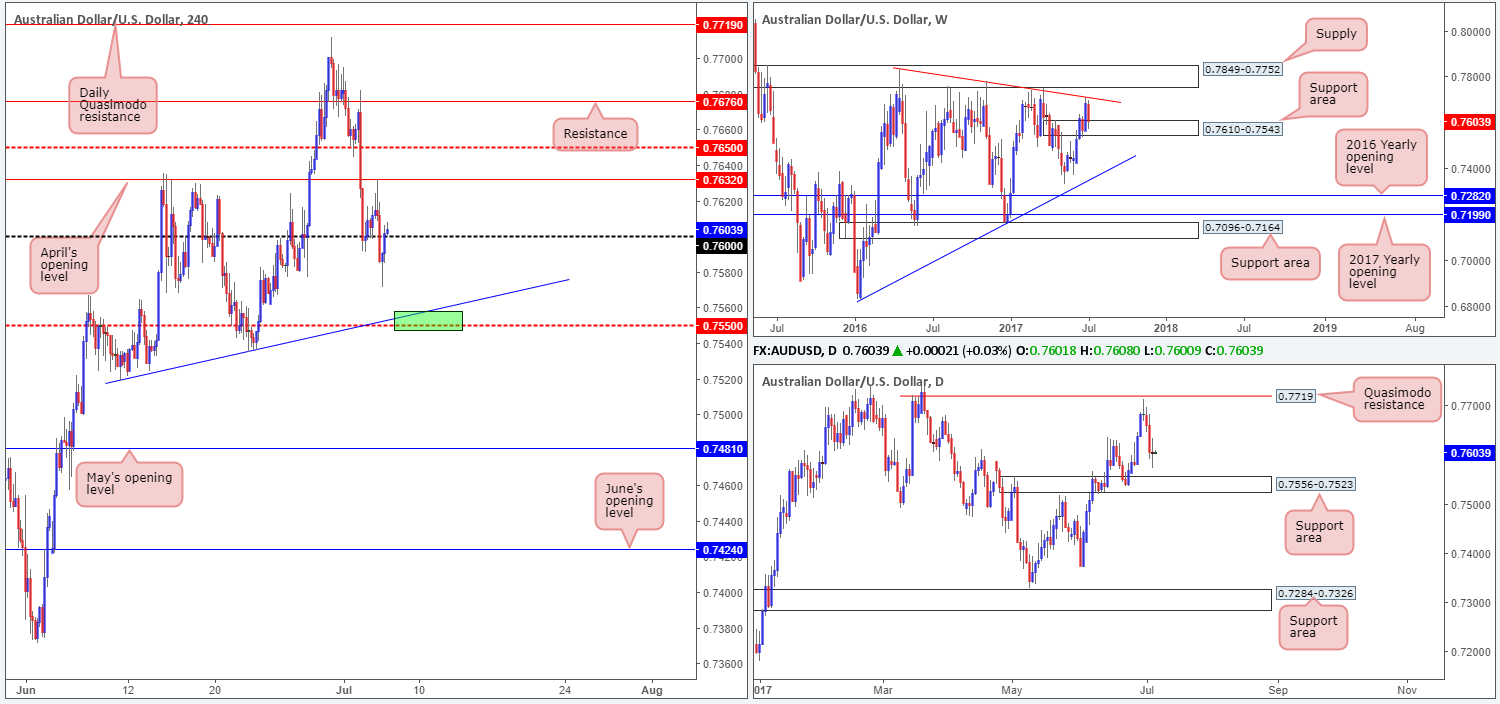
H4 bulls, as you can see, struggled to maintain a bullish presence above the 0.76 handle during the early hours of Wednesday’s trade. This was, technically speaking, largely thanks to April’s opening level at 0.7632, which sent the commodity currency aggressively lower going into the London segment, eventually taking out 0.76 and clocking a low of 0.7571.
Looking over to the bigger picture, however, it’s clear to see that weekly price is currently interacting with a support area at 0.7610-0.7543. Daily action on the other hand shows space for price to continue pushing lower until we reach the support area formed at 0.7556-0.7523, which happens to be glued around the lower edge of the current weekly support area.
Our suggestions: In essence, we have the following picture:
- H4 price now lurking back above 0.76. Can the bulls survive here?
- Weekly flow shaking hands with a support area.
- Daily movement showing room to push lower before support structure is in view.
Personally speaking, we’ll hold fire for the time being and see if H4 price can touch gloves with the mid-level support at 0.7550, which converges nicely with a trendline support etched from the low 0.7519 (green area), before considering longs. This way, both the weekly and daily support areas will be in play!
Data points to consider: Australian Trade balance at 2.30am. US ADP non-farm employment change at 1.15pm, US Weekly unemployment claims and US trade balance figures at 1.30pm, US ISM non-manufacturing PMI and FOMC member Powell speaks at 3pm GMT+1.
Levels to watch/live orders:
- Buys: 0.7550 region ([waiting for a H4 bull candle – preferably a full, or near full-bodied candle –to form is advised] stop loss: ideally beyond the candle’s tail).
- Sells: Flat (stop loss: N/A).
USD/JPY:
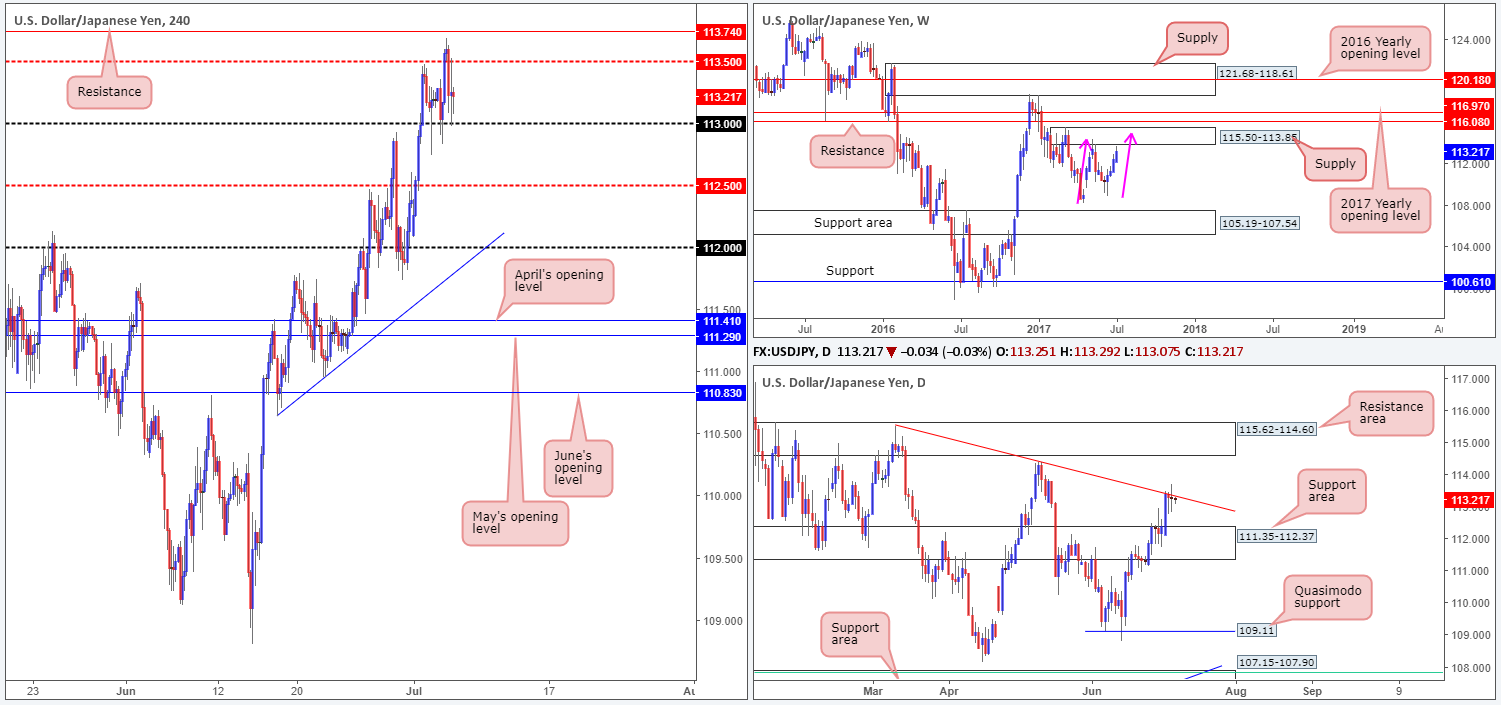
Recent developments on the USD/JPY show weekly price came within a cat’s whisker of connecting with the underside of supply pegged at 115.50-113.85. Assuming that the unit connects with this area, it could also form a possible AB=CD correction completing around 115 (see pink arrows). Sliding down to the daily timeframe, nonetheless, we can see that the candles remain capped by the trendline resistance taken from the high 115.50. What’s also notable from a technical perspective is yesterday’s trading formed a clear-cut indecision candle here.
Bouncing over to the H4 timeframe, price is seen capped between the mid-level resistance at 113.50 and the 113 handle. Directly above this area sits a resistance level drawn from 113.74, and below 113, we do not see much in the way of support until the mid-level number 112.50.
Our suggestions: We do not want to risk trading short until we know that the market is located within the aforementioned weekly supply. What would be ideal here, however, is for the said weekly AB=CD formation to complete!
Data points to consider: US ADP non-farm employment change at 1.15pm, US Weekly unemployment claims and US trade balance figures at 1.30pm, US ISM non-manufacturing PMI and FOMC member Powell speaks at 3pm GMT+1.
Levels to watch/live orders:
- Buys: Flat (stop loss: N/A).
- Sells: Flat (stop loss: N/A).
USD/CAD:
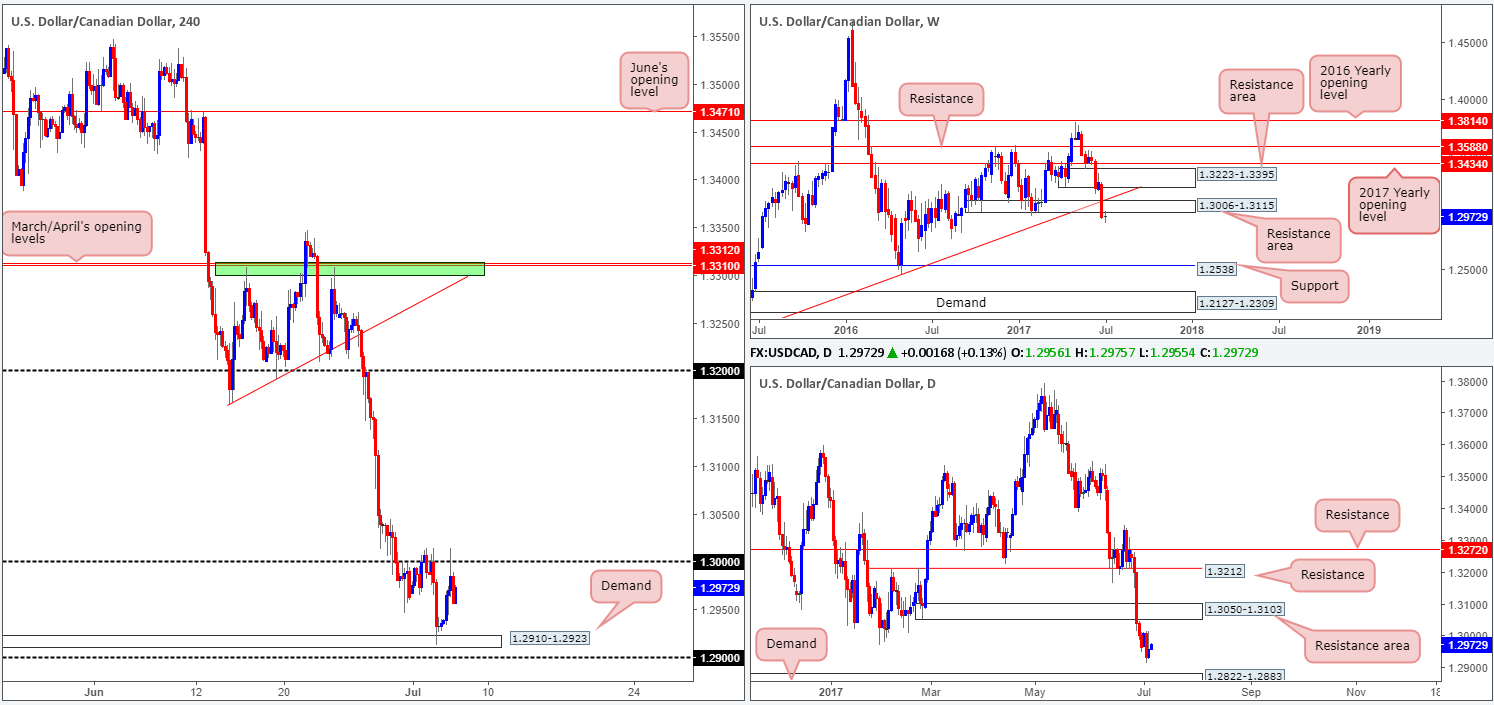
Trade update: remaining 30% of the short taken from 1.2989 was stopped out at breakeven.
Recent action shows that the USD/CAD pair extended its bounce from the H4 demand at 1.2910-1.2923 yesterday and ended the day challenging the large psychological number 1.30. Ultimately we do not expect the bulls to breach this level for a number of reasons. Firstly, this is a line watched by the majority of the market and seeing as it already held as resistance on Monday, we believe it is likely to continue holding firm. Secondly, 1.30 also denotes the underside of a recently broken weekly demand base at 1.3006 (now acting as a resistance area). In addition to this, the underlying trend is strongly pointing to the downside at the moment, and daily price shows space for the unit to continue lower until we reach demand pegged at 1.2822-1.2883.
Our suggestions: Put simply, our desk has come to a general consensus that 1.30 could, if retested for a third time today, be an area we may consider a sell from. To decide this, however, we would require a H4 bearish candle to form following the retest, preferably in the shape of a full, or near-full-bodied candle. The first take-profit target, assuming that a sell comes to fruition, would be the aforementioned H4 demand, followed closely by the 1.29 handle.
Data points to consider: US ADP non-farm employment change at 1.15pm, US Weekly unemployment claims and US trade balance figures at 1.30pm, US ISM non-manufacturing PMI and FOMC member Powell speaks at 3pm. Canadian Trade balance at 1.30pm GMT+1.
Levels to watch/live orders:
- Buys: Flat (Stop loss: N/A).
- Sells: 1.30 region ([waiting for a H4 bear candle – preferably a full, or near full-bodied candle –to form is advised] stop loss: ideally beyond the candle’s wick).
USD/CHF:
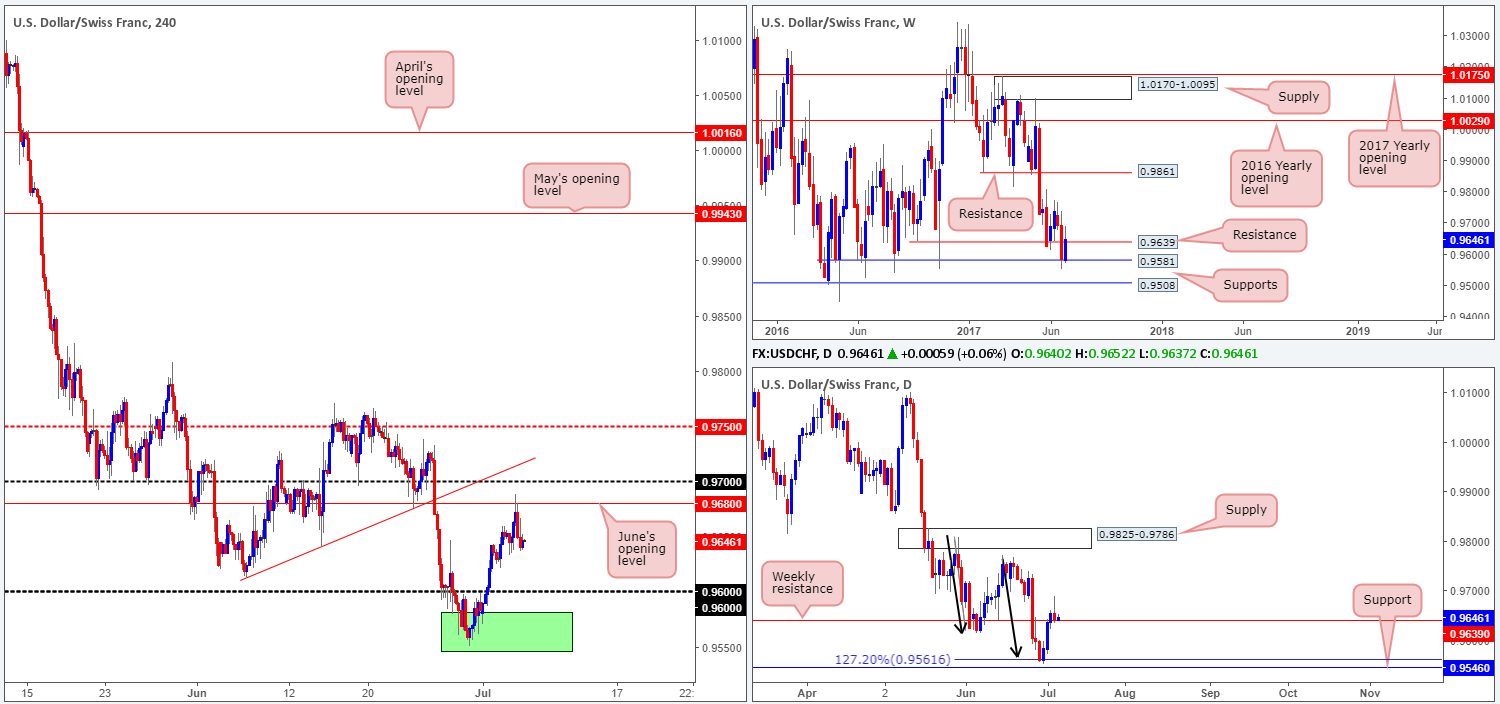
For those who have been following recent reports you may recall that our team was long from 0.9567. Our reasoning behind the position came down to the higher-timeframe picture. The green area shown on the H4 chart is comprised of a weekly support level at 0.9581 and a daily support level pegged at 0.9546. Initially, we had our stop beneath the green zone at 0.9544, but seeing as how the Swissy recently took off north, the stop was moved to breakeven. In addition to this, we also removed 70% of the position off the table once price struck weekly resistance at 0.9639.
The remaining 30% was held in the hope that H4 price would continue driving north and eventually shake hands with June’s opening level at 0.9680. As you can see, this came to fruition during yesterday’s sessions and we closed our position in full for a healthy profit. Well done to any of our readers who managed to stay on board with us here!
Our suggestions: With price now marginally trading above weekly resistance at 0.9639, along with daily price also printing a strong-looking selling wick yesterday, we are wary of trading this market at current price. Therefore, opting to stand on the sidelines may be the better path to take today.
Data points to consider: US ADP non-farm employment change at 1.15pm, US Weekly unemployment claims and US trade balance figures at 1.30pm, US ISM non-manufacturing PMI and FOMC member Powell speaks at 3pm GMT+1.
Levels to watch/live orders:
- Buys: Flat (stop loss: N/A).
- Sells: Flat (stop loss: N/A).
DOW 30:
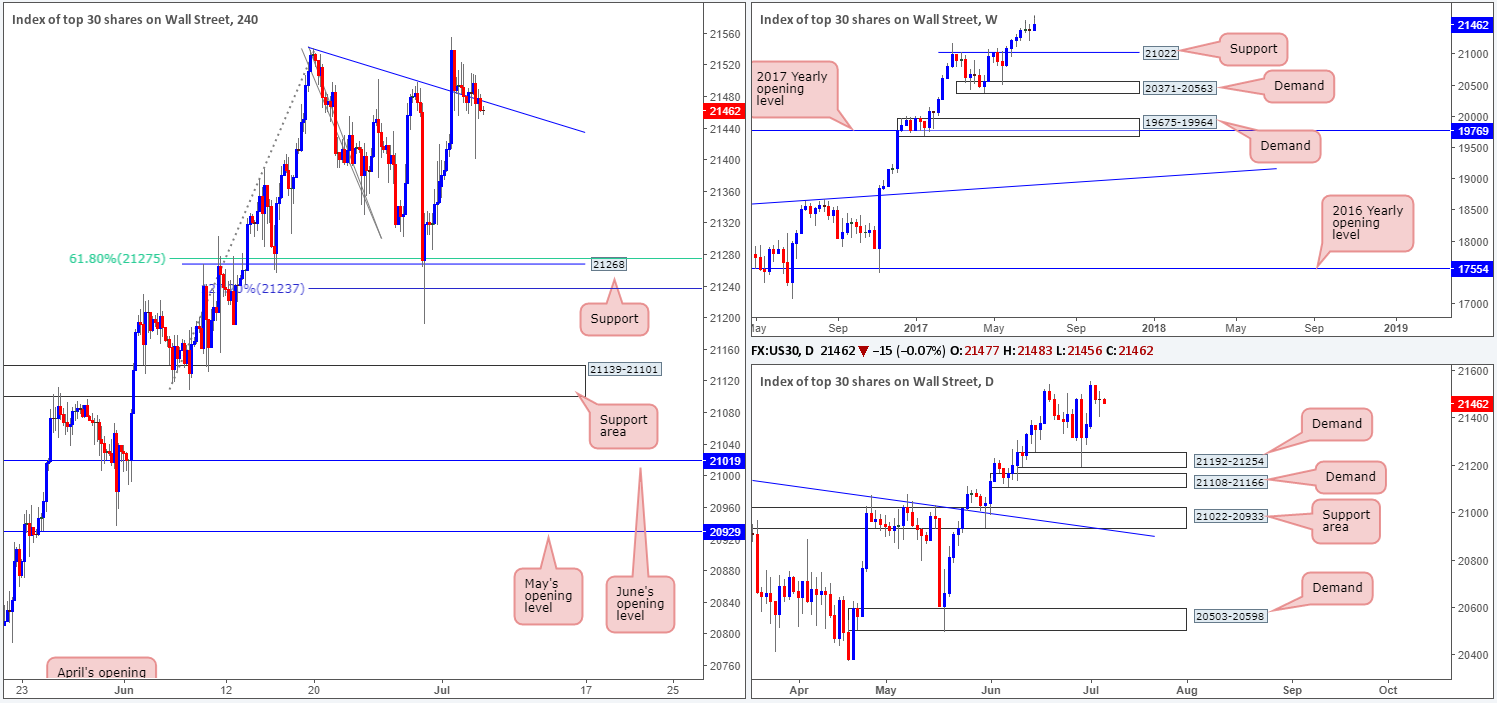
Once again, very little change was seen in the US equity market yesterday. The H4 candles continue to seesaw around the trendline support extended from the high 21541. So, with that in mind, much of the following analysis will be similar to Wednesday’s report…
In Friday’s report, we mentioned that our desk took a long trade at 21323, following the large H4 bull candle that formed off the H4 support level marked at 21268. What attracted us to this point was that the H4 level converged with a H4 61.8% Fib support level at 21275 taken from the low 21108 as well as a H4 127.2% Fib ext. point 21237 drawn from the high 21541 and also because of the daily demand at 21192-21254. Our stop-loss order has now been moved to breakeven and 50% of our position was taken off the table once price connected with the said H4 trendline. We have left the remaining 50% in the market to run as we believe that this index has the potential to punch much higher yet!
Our suggestions: Given our current long position, our desk is currently watching for the H4 trendline to show signs of strength. This could, given that the weekly, daily and H4 charts show absolutely no overhead resistance, also be a reasonable level to look for possible long opportunities.
Should price break into fresh highs today, however, we are going to move our stop-loss order up to the 21400 neighborhood.
Data points to consider: US ADP non-farm employment change at 1.15pm, US Weekly unemployment claims and US trade balance figures at 1.30pm, US ISM non-manufacturing PMI and FOMC member Powell speaks at 3pm GMT+1.
Levels to watch/live orders:
- Buys: 21323 ([live] stop loss: breakeven).
- Sells: Flat (stop loss: N/A).
GOLD:
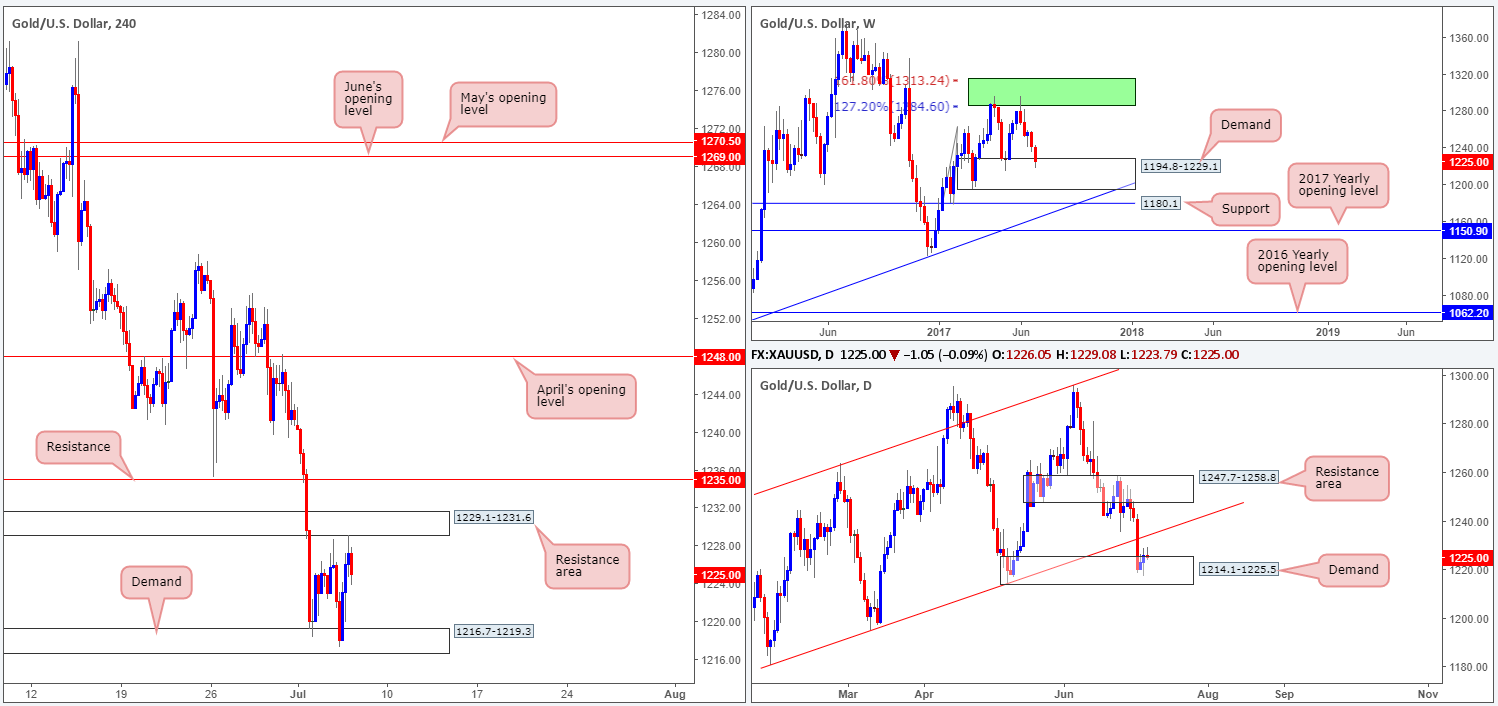
Over the last few sessions, we have seen H4 price put together a consolidation zone formed by a resistance area penciled in at 1229.1-1231.6 and a demand base coming in at 1216.7-1219.3. While traders who only focus on one timeframe may feel that this market is likely headed south due to the medium-term downtrend that we are currently in on the H4 timeframe, the higher-timeframe picture would suggest otherwise!
Scrolling over to the weekly timeframe, the buyers and sellers are seen battling for position around the top edge of a demand zone at 1194.8-1229.1. This demand has held price higher once already back in early May, so there’s a solid chance that history may repeat itself here. In conjunction with the weekly timeframe, daily price also shows the yellow metal trading from a demand at 1214.1-1225.5, which happens to be positioned within the said weekly demand area.
While the H4 candles could remain bouncing from the H4 range extremes this week, we do not believe this consolidation will give way to the downside for reasons stated above.
As mentioned in yesterday’s analysis, a level that has sparked some interest is the H4 resistance base penciled in at 1235.0, due to its connection with the daily trendline resistance seen extended from the low 1180.4. Still, shorting from this line would still entail one going against potential weekly buying power.
With that in mind, it would not be until a decisive H4 close above 1235.0 is seen, would our team consider buying as an option.
Our suggestions: Typically, we try to avoid trading against higher-timeframe flow. And selling 1235.0 would place us against potential weekly flow! Therefore, our desk is going to remain on the sidelines and wait and see if the H4 bulls can do us proud and close above 1235.0 for possible longs up to April’s opening level at 1248.0.
Levels to watch/live orders:
- Buys: Watching for 1235.0 to be consumed on the H4 chart before buying becomes an option.
- Sells: Flat (stop loss: N/A).


