
Waiting for lower timeframe confirmation is our main tool to confirm strength within higher timeframe zones, and has really been the key to our trading success. It takes a little time to understand the subtle nuances, however, as each trade is never the same, but once you master the rhythm so to speak, you will be saved from countless unnecessary losing trades. The following is a list of what we look for:
- A break/retest of supply or demand dependent on which way you’re trading.
- A trendline break/retest.
- Buying/selling tails/wicks – essentially we look for a cluster of very obvious spikes off of lower timeframe support and resistance levels within the higher timeframe zone.
We typically search for lower-timeframe confirmation between the M15 and H1 timeframes, since most of our higher-timeframe areas begin with the H4. Stops are usually placed 1-3 pips beyond confirming structures.
EUR/USD:
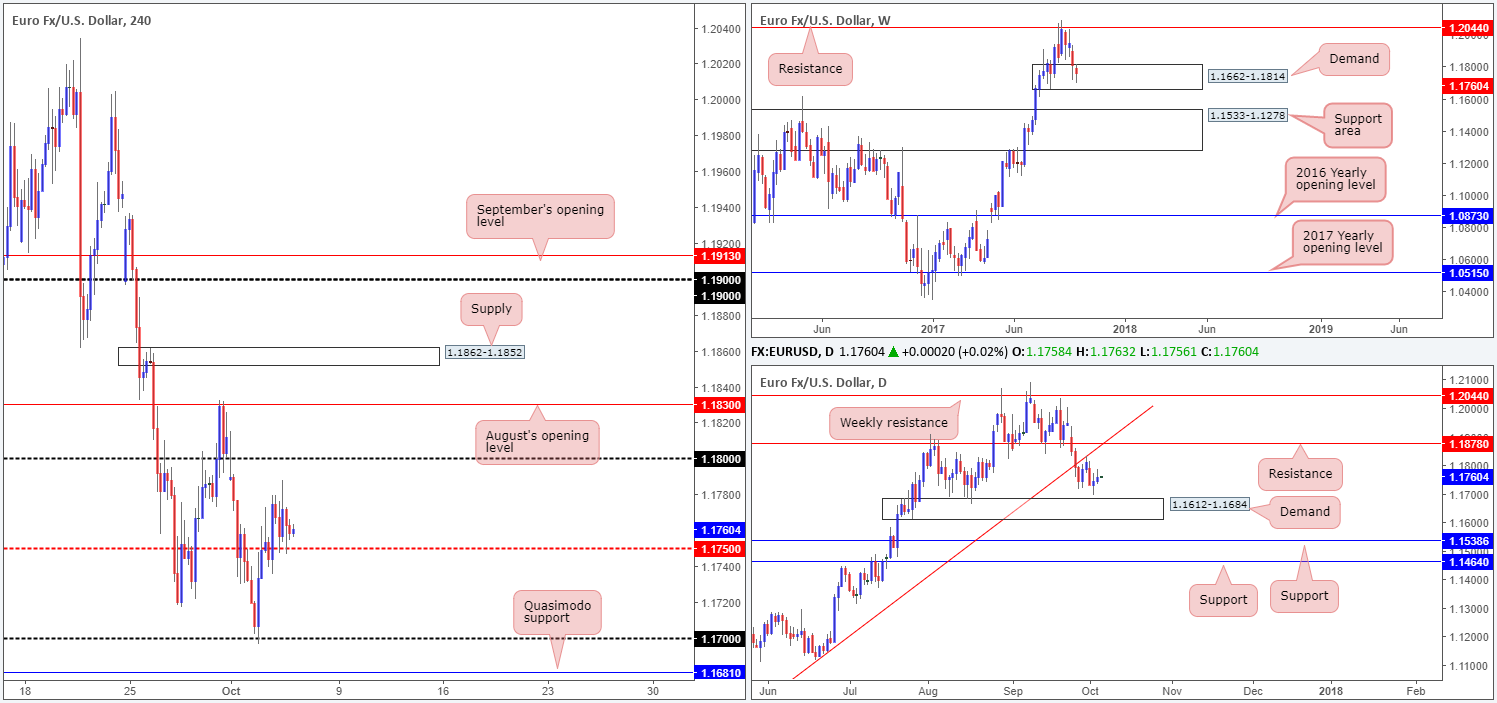
During the course of Wednesday’s segment, the pair largely ignored data and was confined to a tight range of 50 pips above the H4 mid-level support at 1.1750.
The single currency is, at least in our technical view, expected to remain bid from 1.1750 today and eventually advance up to the 1.18 handle, followed closely by August’s opening level at 1.1830. This is primarily due to weekly price trading within the confines of a demand base coming in at 1.1662-1.1814, along with daily flow showing price hovering above demand at 1.1612-1.1684. What’s more, we can also see that there’s room for the unit to gravitate north up to daily resistance pegged at 1.1878, which happens to merge nicely with a daily trendline resistance extended from the low 1.0839.
Suggestions: Drill down to the lower timeframes and look for an entry north from 1.1750. When using lower-timeframe action as a means of entry, we typically look for the following to take shape as a way of approving a higher-timeframe area (this will help get you in using a smaller stop loss and ultimately increase risk/reward up to 1.18 [the first take-profit level]):
- A break of supply followed up with a retest as demand.
- A trendline break/retest.
- A collection of well-defined buying tails off of lower-timeframe support.
As highlighted above, we usually search for lower-timeframe confirmation between the M15 and H1 timeframes, since most of our higher-timeframe areas begin with the H4. Stops are typically placed 1-3 pips beyond confirming structures.
Data points to consider: ECB Monetary policy meeting accounts at 12.30pm; US weekly unemployment claims along with trade balance at 1.30pm; FOMC members Powell and Harker take to the stage at 2.10-3pm; US Factory orders m/m at 3pm GMT+1.
Levels to watch/live orders:
- Buys: 1.1750 region ([waiting for lower-timeframe confirming action to take shape from here is advised before pulling the trigger] stop loss: dependent on where one confirms the area).
- Sells: Flat (stop loss: N/A).
GBP/USD:
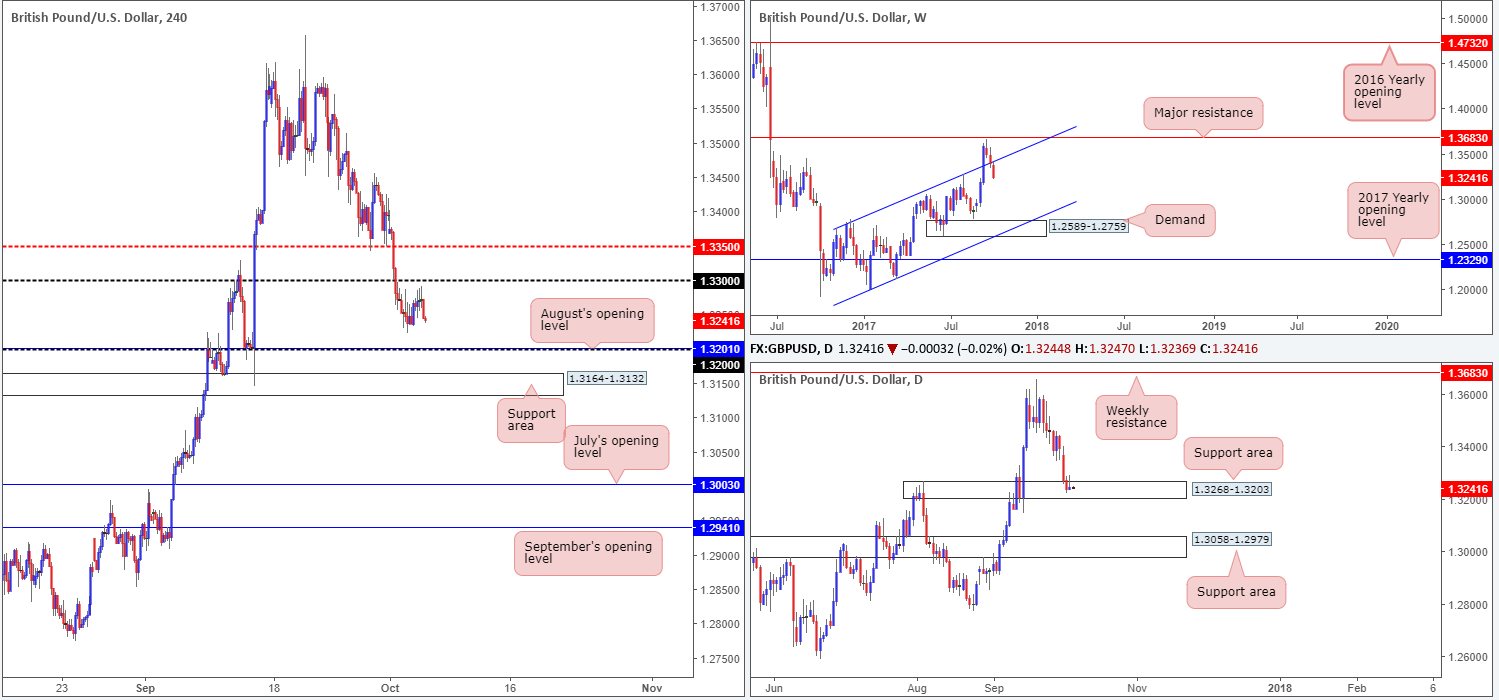
GBP/USD prices are little changed this morning, despite a better-than-expected UK services PMI. As you can see, the H4 candles remain loitering between the 1.33 handle and August’s opening level at 1.3201/1.32 handle. A quick look over at the bigger picture shows weekly price recently re-entered the ascending channel formation (1.1986/1.2673). We know there’s a lot of ground to cover here but this move could have potentially opened up downside to as low as the demand area positioned at 1.2589-1.2759. On the flip side, daily activity is currently seen trading within the walls of a support area coming in at 1.3268-1.3203, which forced price to chalk up an inverted pin bar yesterday (a bullish candlestick signal). A violation of this area, however, will possibly clear the river south down to as far as the support area positioned at 1.3058-1.2979.
Suggestions: In a similar fashion to Wednesday’s analysis, neither a long nor short seems attractive at the moment. No matter which direction one chooses in this market, you’ll have to contend with potential higher-timeframe opposition! For that reason, we’ll remain on the sidelines for now and wait for further developments.
Data points to consider: MPC members McCafferty and Haldane take the stage at 5/6.30pm; US weekly unemployment claims along with trade balance at 1.30pm; FOMC members Powell and Harker take to the stage at 2.10-3pm; US Factory orders m/m at 3pm GMT+1.
Levels to watch/live orders:
- Buys: Flat (stop loss: N/A).
- Sells: Flat (stop loss: N/A).
AUD/USD:
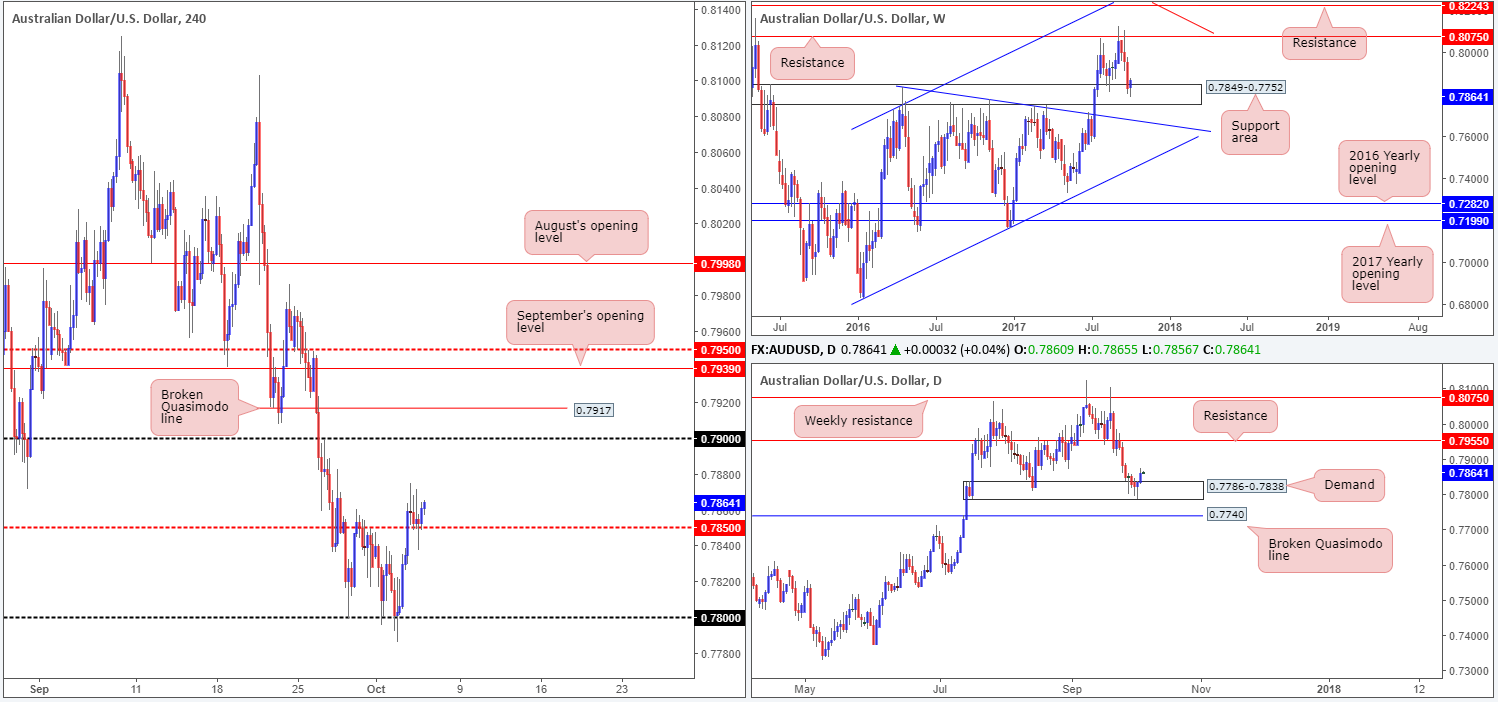
The commodity currency closed marginally higher on Wednesday, breaching the H4 mid-level resistance at 0.7850 and shortly after retesting it as support. This should not really come as too much of a surprise to tech traders who keep an eye on the bigger picture.
Weekly action is seen finding refuge at a major support area drawn from 0.7849-0.7752. This zone has a strong history and held well as support during the month of August, thus there’s a good chance that we may see history repeat itself here. In conjunction with the current weekly zone, a strong daily demand base logged at 0.7786-0.7838 is seen painted within its boundaries. Should the currency remain bid from this demand, the next port of call on the daily scale will likely be the resistance level located at 0.7955.
Technically speaking, we see absolutely no reason why the Aussie will not continue to press north. From a fundamental standpoint, nevertheless, Australian retail and trade balance figures are scheduled to be released in an hour (as of writing), and therefore could alter the technical structure somewhat.
Suggestions: In light of looming Au. News, we’d strongly advise tech traders to stand down for now, and reassess post-news. Getting caught on the wrong side of a high-impacting event will not do your account any favors!
Data points to consider: Australian Retail sales m/m and Trade balance figures at 1.30am; US weekly unemployment claims along with trade balance at 1.30pm; FOMC members Powell and Harker take to the stage at 2.10-3pm; US Factory orders m/m at 3pm GMT+1.
Levels to watch/live orders:
- Buys: Flat (stop loss: N/A).
- Sells: Flat (stop loss: N/A).
USD/JPY:
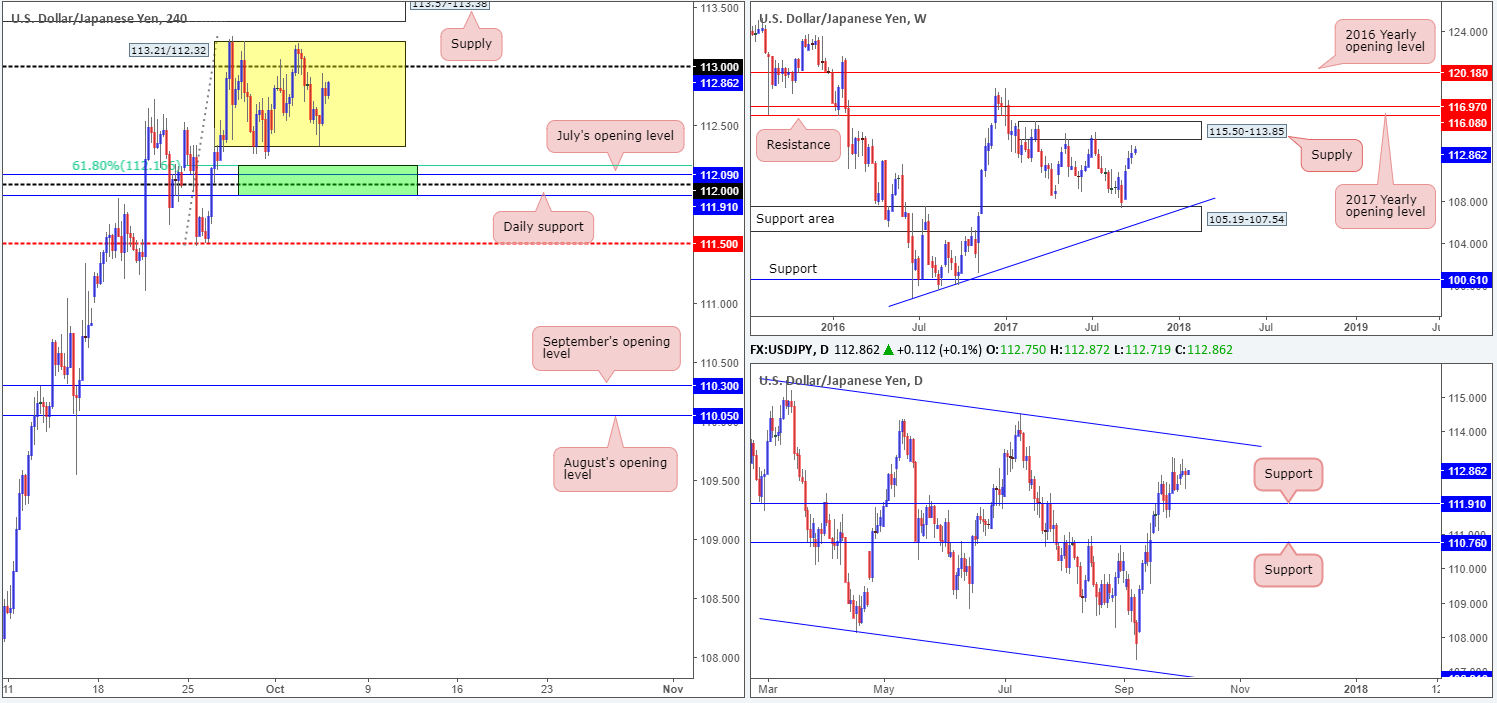
Since the 27th September, the USD/JPY has been entrenched within a H4 range at 113.21/112.32 (see yellow box). In spite of this, we maintain an optimistic outlook for the pair overall. Our reasoning lies within the higher-timeframe structures. Weekly price shows room to push up to nearby supply coming in at 115.50-113.85, as well as daily price up to a trendline resistance extended from the high 115.50, which happens to merge nicely with the noted weekly supply.
In light of the above, we still have an eyeball on the 112 handle for potential longs due to the following confluence:
- Positioned directly above daily support at 111.91.
- Located just below July’s opening level at 112.09.
- Nearby a 61.8% H4 Fib support at 112.16 taken from the low 111.47.
Suggestions: With space seen for both weekly and daily action to push higher, coupled with the 112 handle’s surrounding confluence mentioned above, a long from the green H4 buy zone is still worthy of attention. As psychological levels are prone to fakeouts, however, you may want to wait for H4 price to confirm buyer intent before pulling the trigger. For us, this would simply be a full or near-full-bodied bullish candle formed within the green zone, which would, in our view, provide enough evidence to hold the position up to at least 113/H4 supply at 113.57-113.38.
Data points to consider: US weekly unemployment claims along with trade balance at 1.30pm; FOMC members Powell and Harker take to the stage at 2.10-3pm; US Factory orders m/m at 3pm GMT+1.
Levels to watch/live orders:
- Buys: 111.91/112.16 ([waiting for a reasonably sized H4 bullish candle to form – preferably a full, or near-full-bodied candle – is advised] stop loss: ideally beyond the candle’s tail).
- Sells: Flat (stop loss: N/A).
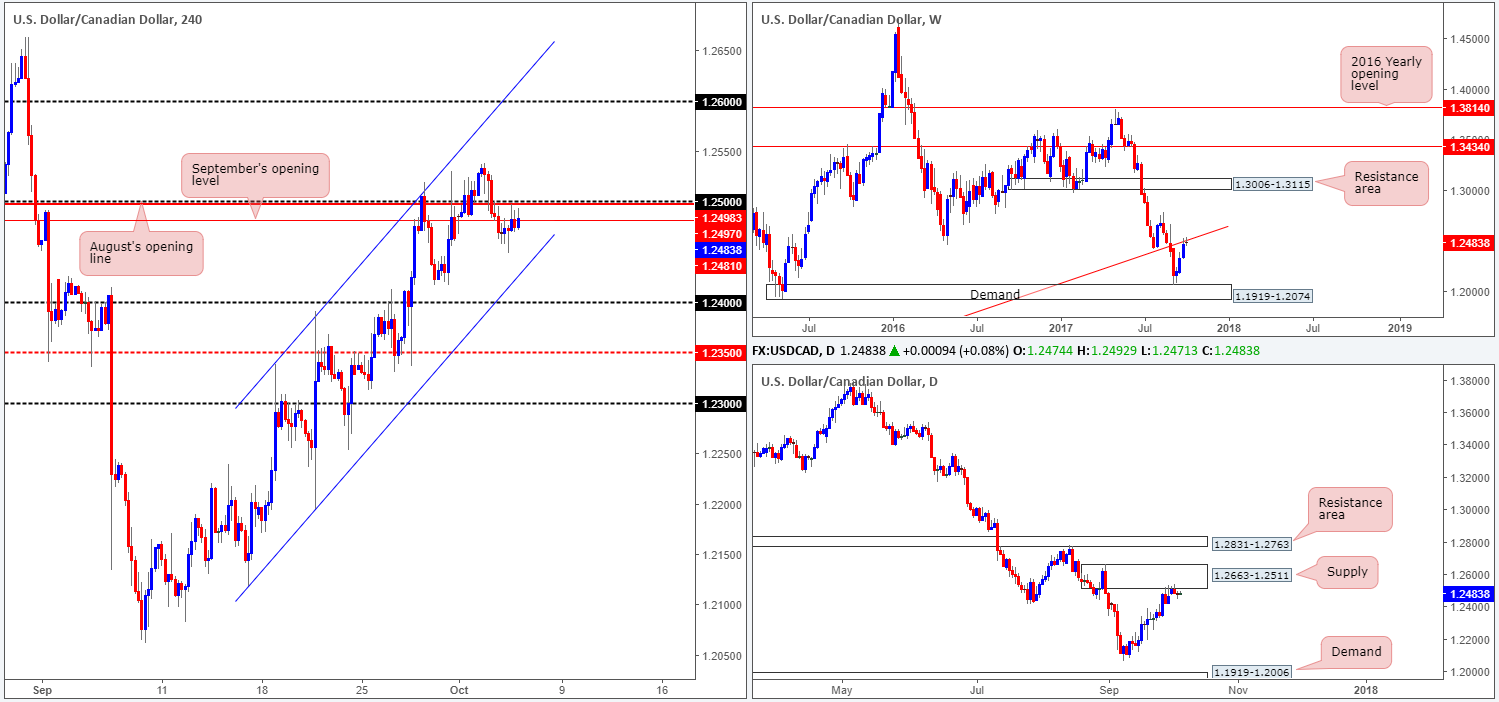
USD/CAD:
For those who read Wednesday’s report you may recall our desk mentioning that if a full or near-full-bodied H4 bearish candle closed below September’s open level at 1.2481, this would be considered a strong sell signal to short down to at least 1.24. We entered at 1.2468 shortly after we wrote this report, and placed a stop-loss order a few pips above the 1.25 handle at 1.2503. As you can see, the trade is still active but looks vulnerable to the upside at the moment.
Despite our sell trade struggling, our overall bias remains focused to the downside. A strong underlying downtrend, coupled with weekly price kissing the underside of a trendline resistance taken from the low 0.9633 and the daily candles loitering at the underside of supply carved from 1.2663-1.2511, echoes overbought conditions, in our view.
Suggestions: In the event that our short trade turns lower, we will have to contend with the nearby H4 channel support etched from the low 1.2118. Ultimately, we want to see this line engulfed and price head on to the 1.24 handle where we’ll look to begin taking profits.
Data points to consider: US weekly unemployment claims along with trade balance at 1.30pm; FOMC members Powell and Harker take to the stage at 2.10-3pm; US Factory orders m/m at 3pm; Canadian Trade balance at 1.30pm GMT+1.
Levels to watch/live orders:
- Buys: Flat (stop loss: N/A).
- Sells: 1.2468 ([live] stop loss: 1.2503).
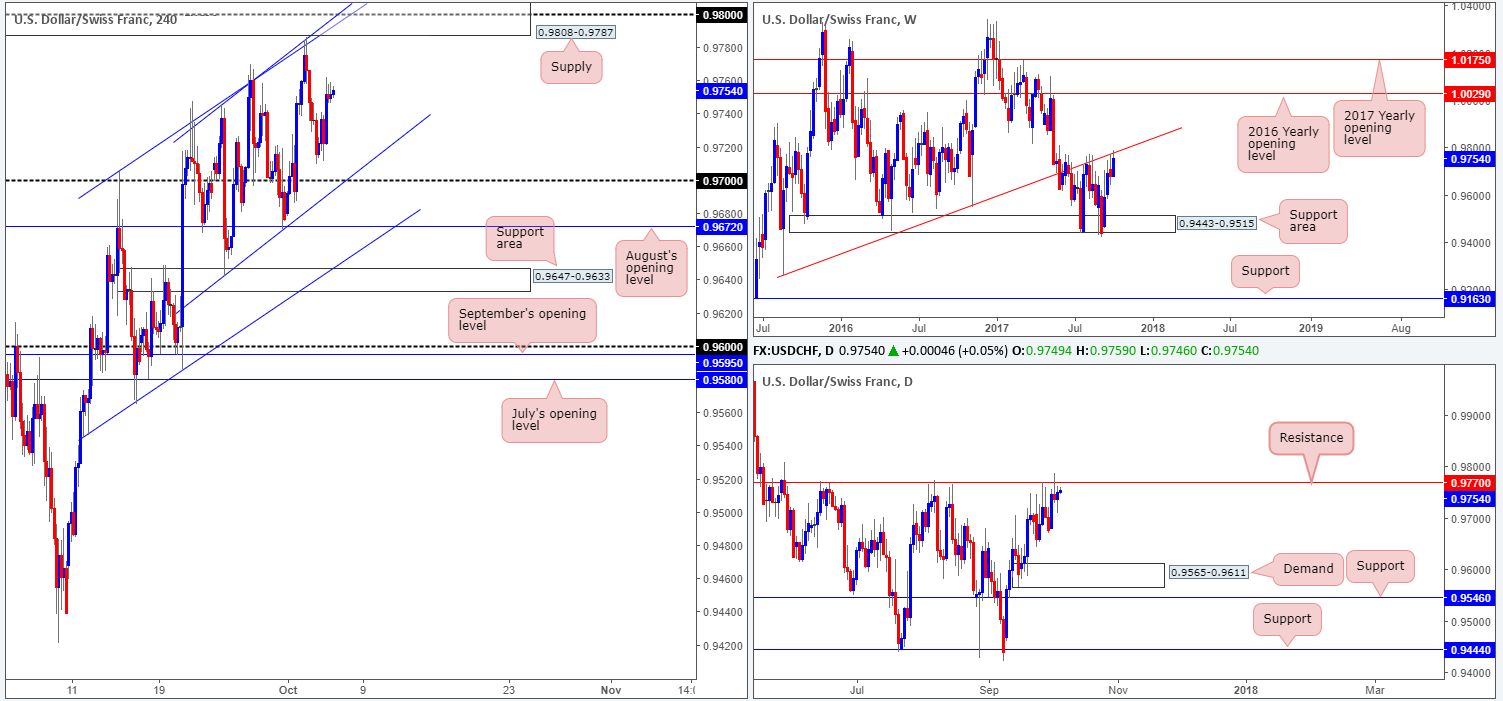
USD/CHF:
Influenced by Wednesday’s better-than-expected US ISM non-manufacturing print, the USD/CHF managed to print a nice-looking daily buying tail and erase Tuesday’s losses. While the bulls look to reassert their dominance, we maintain a fairly pessimistic outlook for the Swissie pair at the moment, due to the following reasons:
- High on the curve, the weekly candles are seen bumping heads with the underside of a trendline resistance extended from the low 0.9257.
- A closer look at price action on the daily timeframe shows the unit trading within striking distance of resistance coming in at 0.9770.
- Over on the H4 timeframe, supply at 0.9808-0.9787 is seen lurking nearby, along with the 0.98 handle and two converging channel resistances etched from highs of 0.9705/0.9746.
Suggestions: Owing to the collective resistances seen on the weekly, daily and H4 timeframes, a short from the H4 supply could be an option today (pending sell order at 0.9790 – stop loss at 0.9810).
Data points to consider: US weekly unemployment claims along with trade balance at 1.30pm; FOMC members Powell and Harker take to the stage at 2.10-3pm; US Factory orders m/m at 3pm GMT+1.
Levels to watch/live orders:
- Buys: Flat (stop loss: N/A).
- Sells: 0.9790 ([pending order] stop loss: 0.9810).
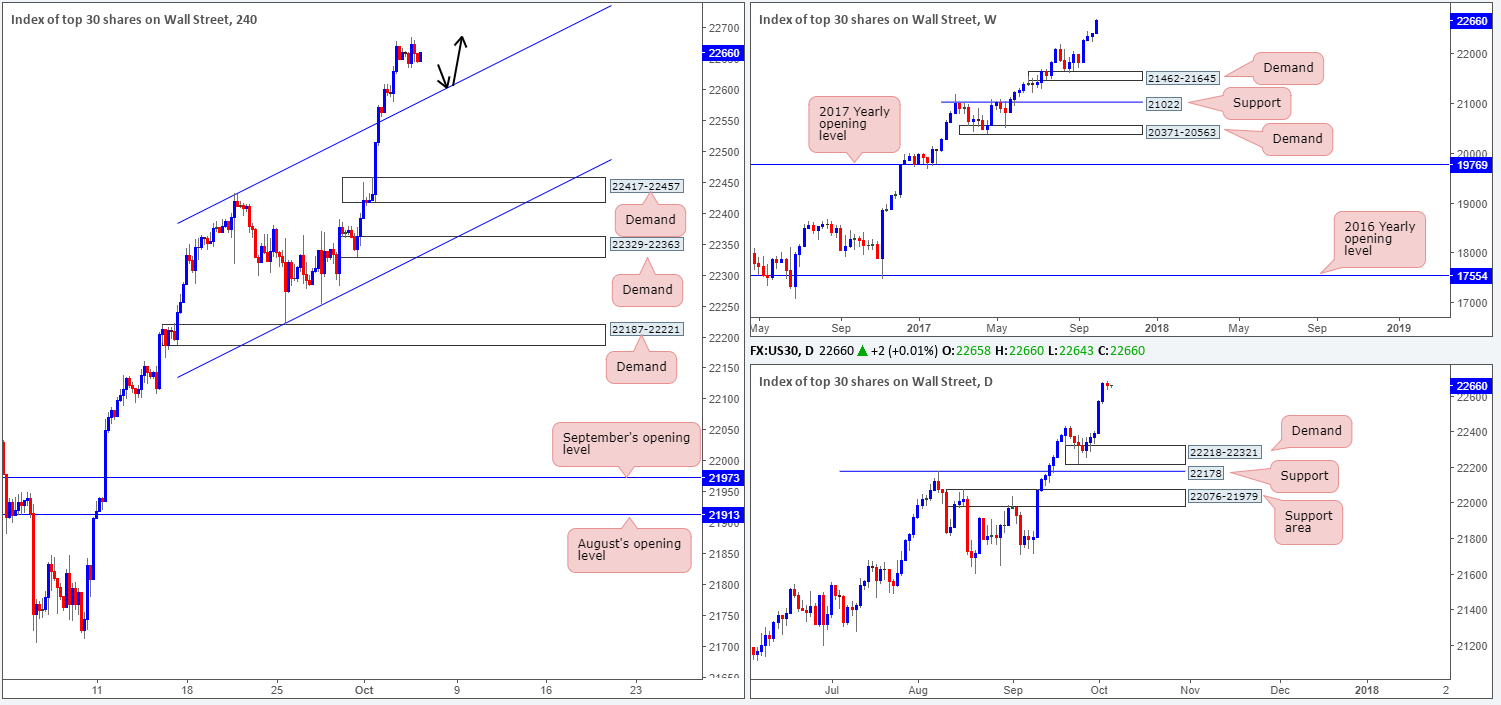
DOW 30:
Wall Street, as you can see, took a breather on Wednesday, following two record-hitting days. The H4 candles were confined to a tight range of 50 points, hovering just above a recently broken H4 channel resistance extended from the high 22431 (now acting support). In a similar fashion to yesterday’s report, we see little reason why the index will not continue to punch higher given the strength of the underlying trend – just look at the weekly chart!
Suggestions: With H4 price now trading proud above the channel support, this is, in our view, an ideal line to buy from should the unit dip lower (see black arrows). Nevertheless, we would strongly recommend waiting for a reasonably sized H4 bull candle (a full or near-full-bodied candle) to form following the retest, before pulling the trigger. This is simply to help avoid any fakeout that may take place.
Data points to consider: US weekly unemployment claims along with trade balance at 1.30pm; FOMC members Powell and Harker take to the stage at 2.10-3pm; US Factory orders m/m at 3pm GMT+1.
Levels to watch/live orders:
- Buys: Watch for H4 price to retest channel support ([waiting for a reasonably sized H4 bullish candle to form – preferably a full, or near-full-bodied candle – following the retest is advised] stop loss: ideally beyond the candle’s tail).
- Sells: Flat (stop loss: N/A).
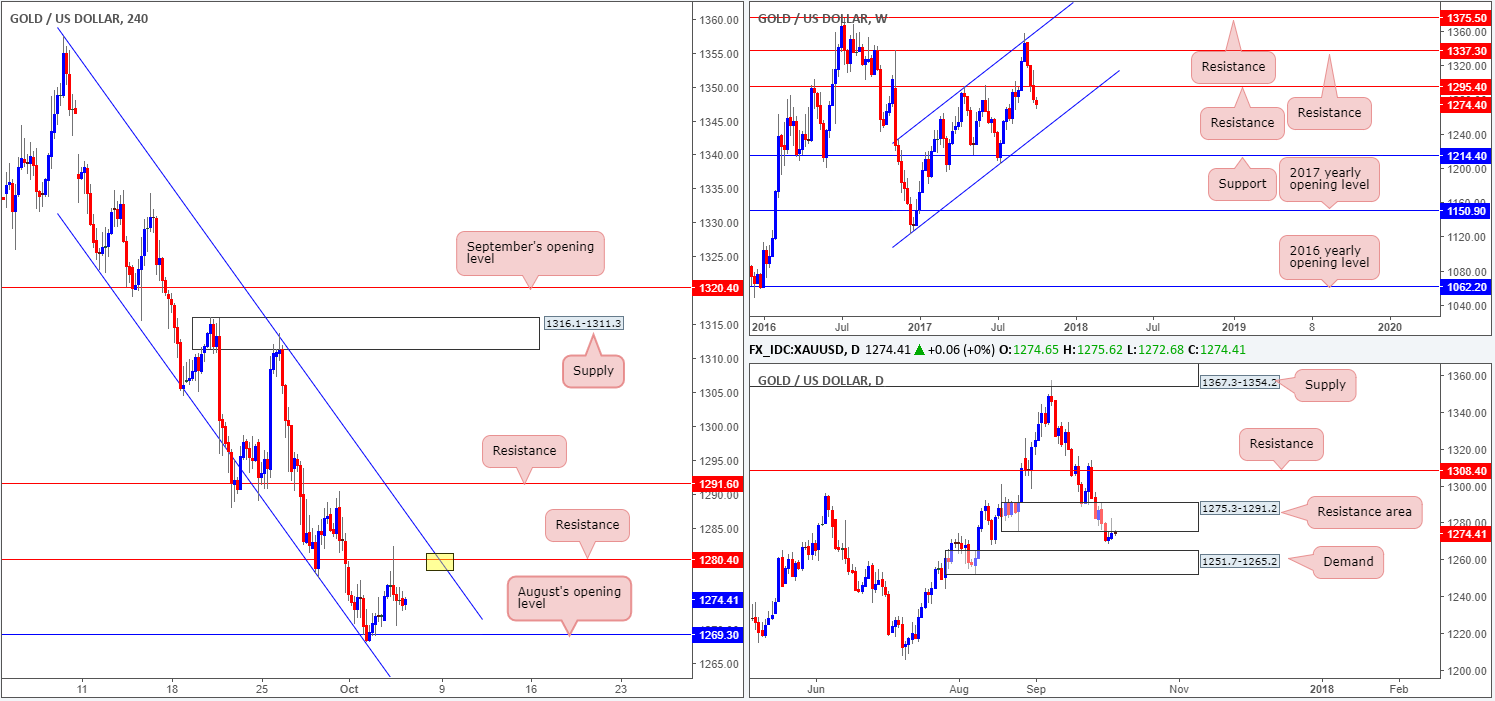
GOLD:
In recent trading, we can see that gold aggressively challenged the H4 resistance at 1280.4 going into the early hours of the US segment. In our previous report, we highlighted this level, along with the H4 channel resistance extended from the high 1357.5 (yellow marker), as being a potential sell zone. Given 1280.4 effectively proved itself as a worthy resistance yesterday, the yellow area now carries more weight, in our humble view. Alongside this, we also have the following in favor:
- Weekly price showing little support in view until we reach channel support extended from the low 1122.8.
- Daily action continuing to chomp at the underside of a resistance area pegged at 1275.3-1291.2.
- Steep downtrend.
Suggestions: On account of the above, we would be surprised to see H4 price trade beyond the noted channel resistance. With that being the case, the yellow marker on the H4 timeframe remains the place to be for shorts!
Levels to watch/live orders:
- Buys: Flat (stop loss: N/A).
- Sells: 1280.4 region ([waiting for a reasonably sized H4 bearish candle to form – preferably a full, or near-full-bodied candle – following the retest is advised] stop loss: ideally beyond the candle’s wick).


