
EUR/USD:
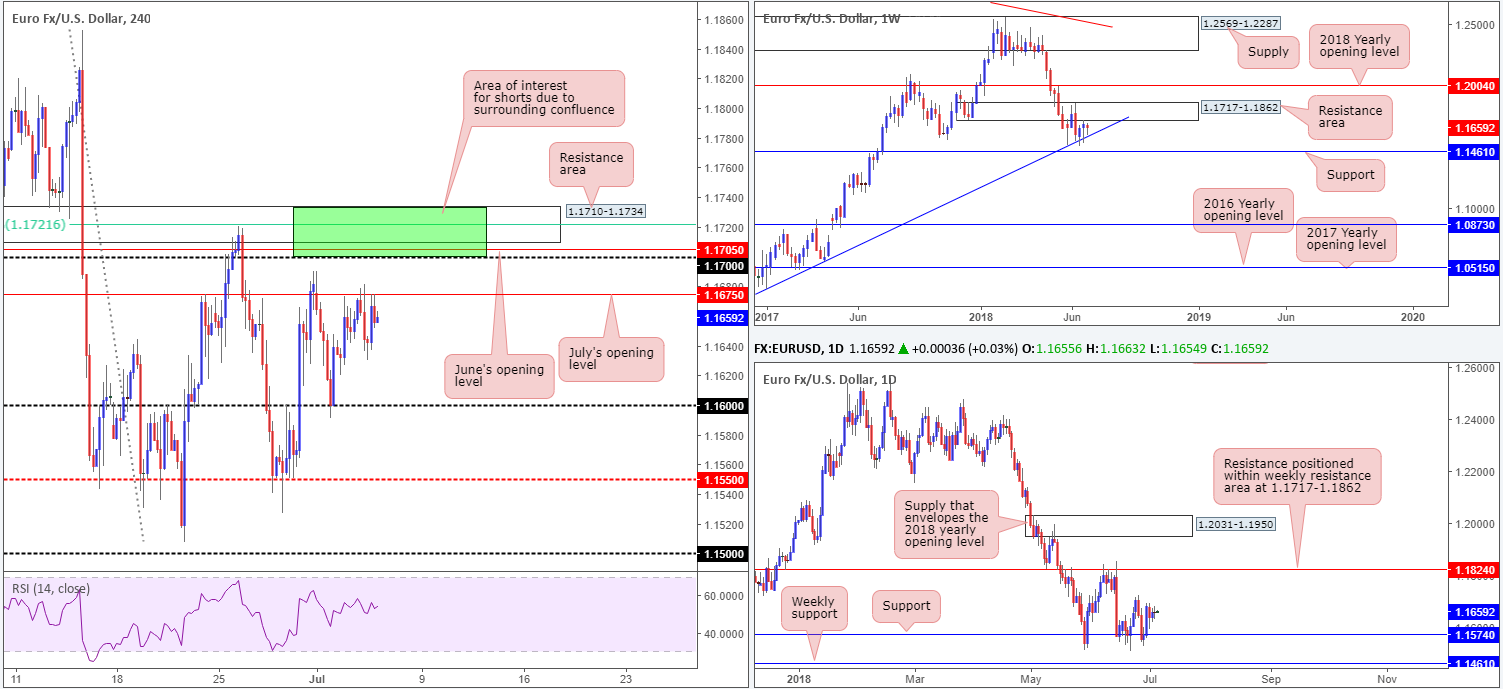
Limited action was seen across the markets on Wednesday, thanks largely to US banks closing their doors in observance of Independence Day. EUR/USD traders also struggled to find concrete direction amid a lack of economic data, hence the daily indecision candle.
In Wednesday’s report, the team highlighted July’s opening level seen on the H4 timeframe at 1.1675. We also shone the spotlight on an area for potential shorts sited a few pips above here (green) at 1.1734/1.17 (comprised of June’s opening level at 1.1705, a 61.8% H4 Fib resistance value at 1.1721 and a H4 resistance area at 1.1710-1.1734). What struck a note with us at this area, though, was the fact that the zone houses the lower edge of a weekly resistance base within at 1.1717-1.1862.
The only sore point regarding the green H4 zone is the daily timeframe. Daily support seen at 1.1574, as you can see, continues to bolster this market. Further upside from this point would likely call for a test of daily resistance placed at 1.1824 (positioned within the noted weekly resistance area).
Areas of consideration:
While July’s opening level may hold price action lower today, this base remains secondary. Technicians likely have their crosshairs fixed on the H4 area noted above in green at 1.1734/1.17. Should H4 movement connect with this area today, waiting and seeing if price can chalk up a full or near-full-bodied bearish candle is advised. This will help avoid an unnecessary loss should daily buyers enter the fray and lift the unit higher.
Today’s data points: German Buba President Weidmann speaks; US ADP non-farm employment change; US unemployment claims; US ISM non-manufacturing PMI; FOMC meeting minutes.
GBP/USD:
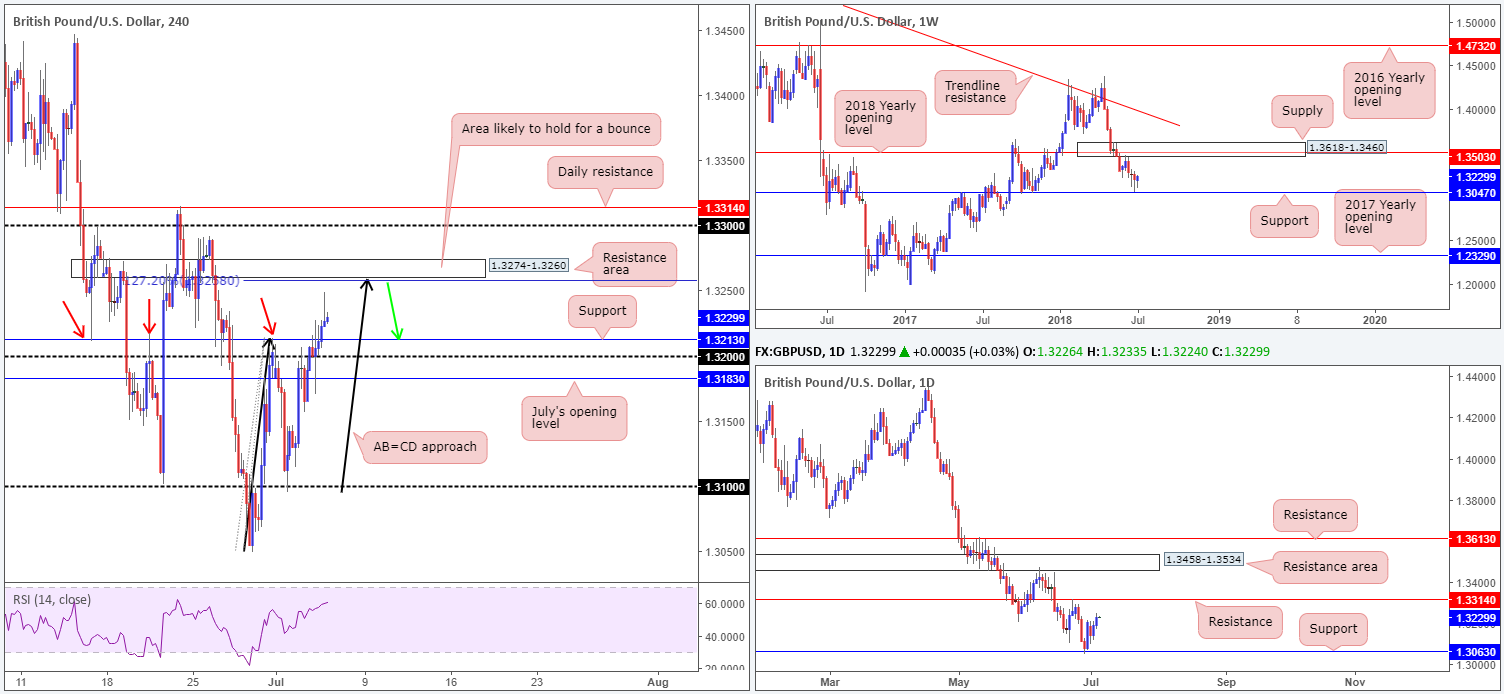
Solid macroeconomic data out of the UK on Wednesday helped the GBP/USD reclaim the 1.32 handle in strong fashion. Though price action found difficulty extending these gains at nearby H4 resistance drawn from 1.3213, the pair eventually overpowered the obstacle amid thin US trade and clocked a fresh weekly high of 1.3249.
Recent movement has placed the H4 resistance area at 1.3274-1.3260 in the limelight. In the event H4 price continues to punch higher today, it’ll also complete an AB=CD approach (see black arrows). Unfortunately, though, the base boasts limited connection to the higher timeframes. Daily flow displays room to probe as high as resistance coming in at 1.3314, as well as weekly price eyeing supply as far north as 1.3618-1.3460.
Areas of consideration:
Though higher-timeframe flows suggest a push higher may be on the cards, the H4 resistance zone mentioned above at 1.3274-1.3260 will still likely produce a bounce back towards 1.3213 which should now act as support. To give yourself some room here, placing stops around the 1.3284 mark could be an idea (24-pip stop). This equates to two times one’s risk, should you target the H4 support highlighted above at 1.3213 (47 pips). As a result, risk/reward argues this setup is a worthwhile consideration.
Today’s data points: BoE Gov. Carney speaks; US ADP non-farm employment change; US unemployment claims; US ISM non-manufacturing PMI; FOMC meeting minutes.
AUD/USD:
AUD/USD bulls caught a favorable wind in early trade on Wednesday on the back of better-than-expected Aussie retail sales. Though highs of 0.7424 were achieved, price failed to sustain gains above July’s opening level seen on the H4 timeframe at 0.7411. London’s open witnessed a cloud of sellers enter the fray, paring earlier gains and reclaiming the 0.74 handle. The H4 demand zone marked with a green arrow at 0.7371-0.7388 has so far managed to hold ground, despite the area producing marginal upside momentum from its base.
Weekly demand at 0.7371-0.7442 remains in the fray, but appears to be hanging on by a thread. Last week’s push below this area likely tripped stops and cleared the path south to nearby weekly support in the shape of the 2016 yearly opening level at 0.7282. Daily action, on the other hand, found support at 0.7314, which happens to be bolstered by additional confluence in the form of a nearby daily channel support taken from the low 0.7758.
Areas of consideration:
Longer term, the bulls are struggling to find solid earth. Regardless, though, the team will not consider buyer exhaustion until a daily close below daily support at 1.3314 is seen.
Intraday, a break of the current H4 demand is likely judging by its construction. H4 mid-level support at 0.7350 will be the next support hurdle in play. This level held firm in late June (red arrows), so we may well see history repeat itself here. A failure of this level opens downside to H4 Quasimodo support at 0.7323, followed closely by the 0.73 handle.
As you can see, structure is somewhat tighter on the lower timeframes, with little indication as to which level has the higher probability of reacting.
Today’s data points: US ADP non-farm employment change; US unemployment claims; US ISM non-manufacturing PMI; FOMC meeting minutes.

USD/JPY:
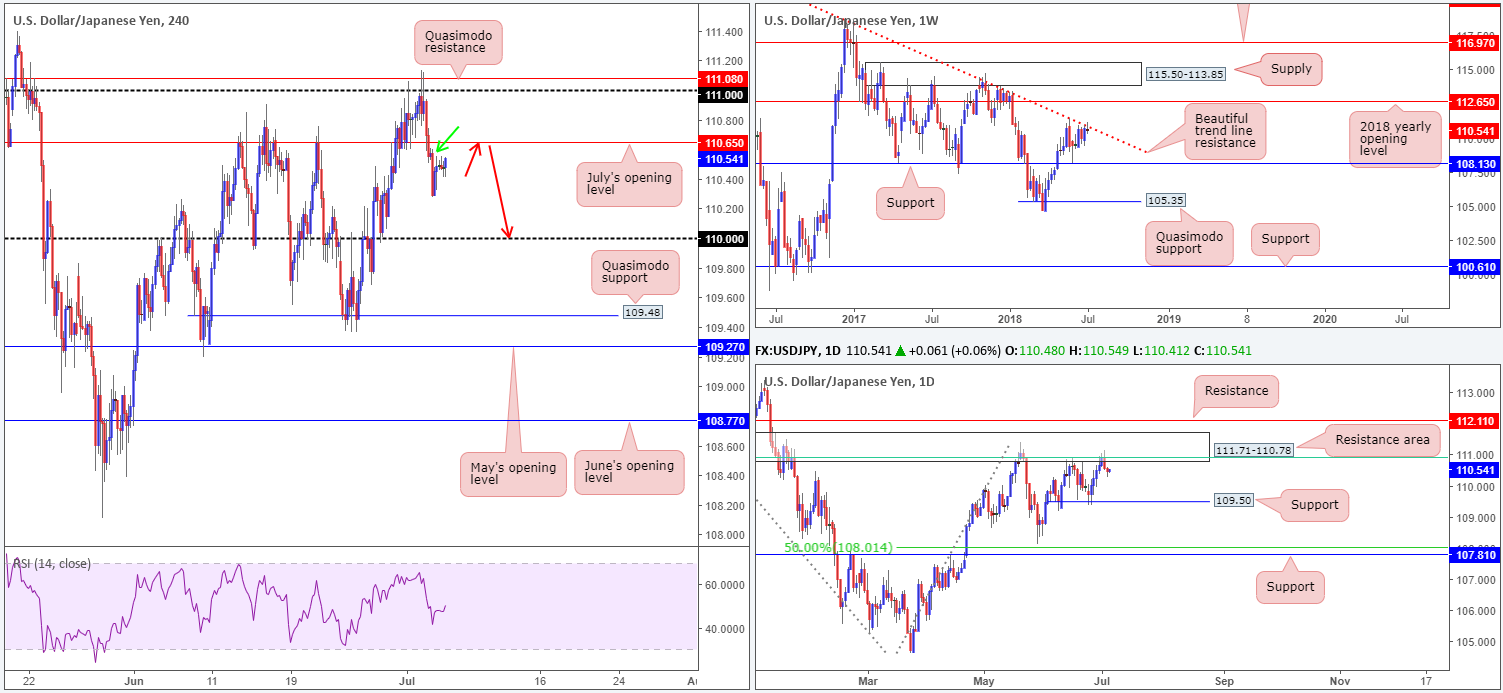
Aside from a brief push to session lows of 110.28, market movement was limited on Wednesday as US banks closed their doors in observance of Independence Day. In consequence, much of the following report will echo thoughts put forward in yesterday’s analysis.
Following a strong push north last week, weekly price engaged with a trend line resistance taken from the high 123.57. Thus far, the sellers remain in the driving seat here and, in turn, could lead to a test of weekly support coming in at 108.13. Bolstering this weekly barrier is a daily resistance area seen at 111.71-110.78, which happens to house a 61.8% daily Fib resistance value at 110.91 (green line) within its limits. Note that the next downside target on this scale does not come into view until we reach the 109.50ish mark.
A closer look at price action on the H4 timeframe saw Quasimodo resistance at 111.08 (and its closely associated 111 handle) brought into play in recent trade. Following lower US equities, along with US Treasury yields drifting beneath 2.85%, the H4 candles wiped out July’s opening level at 110.65. With little in terms of support seen until reaching the 110 handle, coupled with higher-timeframe resistances in play, lower levels are likely in the firing range today/this week.
Areas of consideration:
An ideal sell setup would be for H4 price to retest the underside of July’s opening level at 110.65. Note that should this scenario come to fruition, stop-loss orders positioned above the minor H4 supply marked with a green arrow at 110.61-110.50 would be triggered. Once these stops are filled, they become buy orders, thus providing liquidity to sell from July’s opening level! A H4 full or near-full-bodied bear candle printed off 110.65 would likely be enough evidence to suggest 110 may be the next level brought into play.
Today’s data points: US ADP non-farm employment change; US unemployment claims; US ISM non-manufacturing PMI; FOMC meeting minutes.
USD/CAD:
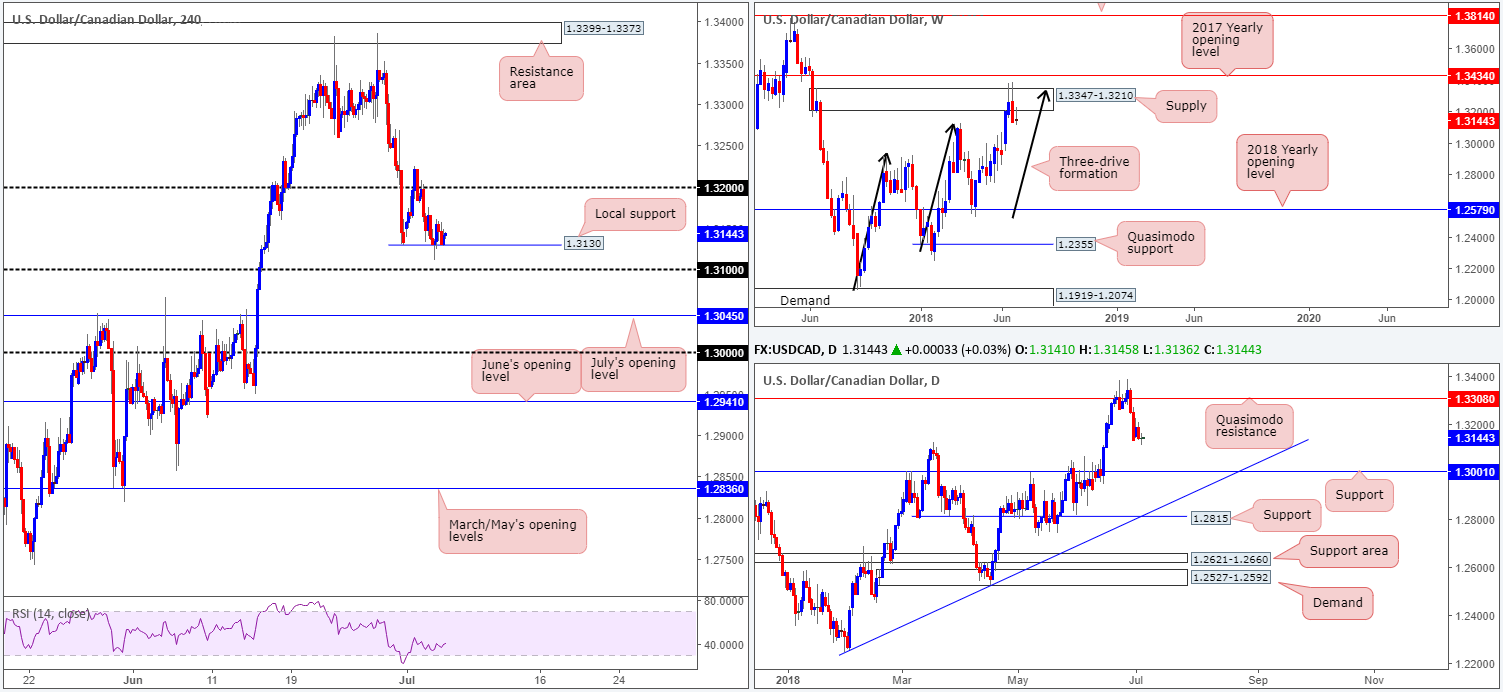
USD/CAD prices are effectively unchanged this morning, largely brought about on US banks closing their desks in observance of Independence Day. Intraday, local H4 support at 1.3130 continued to provide a floor in this market on Wednesday, despite a dip to lows of 1.3111 amid Asia trade. A violation of this level today would likely place the 1.31 handle in the firing range. Continued support, on the other hand, has the 1.32 handle to target.
The story on the bigger picture, however, places the market in a somewhat bearish setting. After slicing through the top edge of a weekly supply at 1.3347-1.3210 and completing a three-drive formation (see black arrows), further selling is a strong possibility. In addition to this, daily price shows the next support target does not come into view until 1.3001 – effectively the key figure 1.30.
Areas of consideration:
Having seen the higher-timeframe structure imply selling, buying off the local H4 support mentioned above at 1.3130 is chancy. The most traders should expect off this level is 1.32.
To the downside, selling beneath 1.3130 places one in an uncomfortable position owing to the 1.31 handle seen nearby. As such, shorts would only be considered valid on a H4 close beneath 1.31, targeting July’s opening level at 1.3045, followed then by 1.30 handle, which, as we already know, also represents daily support.
Today’s data points: US ADP non-farm employment change; US unemployment claims; US ISM non-manufacturing PMI; FOMC meeting minutes.
USD/CHF:
As expected, traders struggled to find direction amid Wednesday’s session as volume thinned out on the back of limited fundamental drivers and the US holiday.
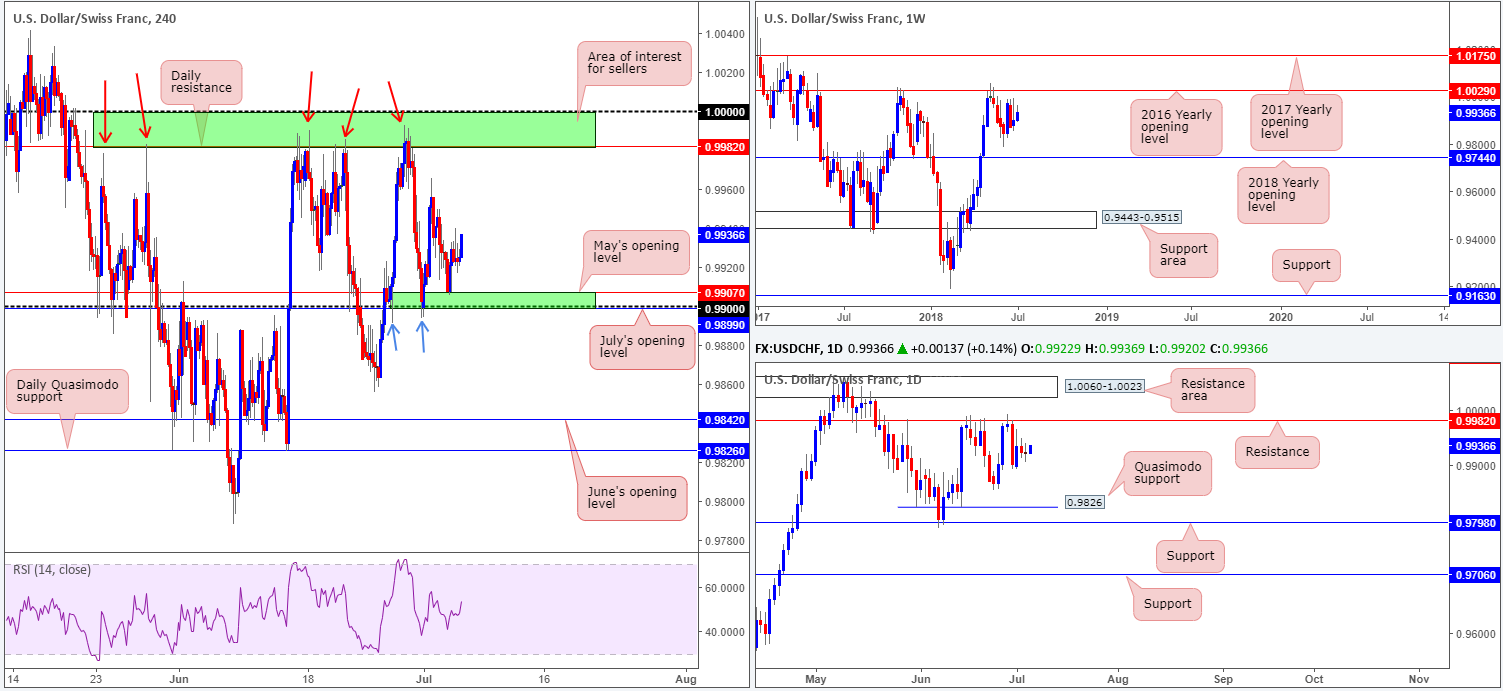
In spite of this, we witnessed a to-the-pip test of May’s opening level on the H4 timeframe at 0.9907, lifting price action to session highs of 0.9939. Beyond May’s opening level, traders may want to note the 0.99 handle, which happens to also converge with July’s opening level at 0.9899. To the upside, we do not see a whole lot to write home about until we reach 0.9982: a daily resistance located just south of the key figure 1.0000 (parity).
Areas of consideration:
In view of the history surrounding the green H4 zone at 1.0000/0.9982 (parity/daily resistance – see red arrows), this is likely an area of interest for sellers. We would, however, strongly recommend waiting for H4 price to confirm bearish intent (a full or near-full-bodied bearish candle would suffice) before pulling the trigger, as weekly bulls could enter the fray and head towards its next upside level at 1.0029: the 2016 yearly opening level.
Another area to take into account is the lower green H4 zone at 0.99/0.9907 (round number/May open level) for a possible bounce higher. As the zone covers only a small area, though, traders should prepare themselves for a possible fakeout lower (similar to what we’ve already seen [blue arrows]). With this being the case, it might be best to wait for H4 price to confirm intent before pressing the buy button (a full or near-full-bodied bullish candle).
Today’s data points: US ADP non-farm employment change; US unemployment claims; US ISM non-manufacturing PMI; FOMC meeting minutes.
Dow Jones Industrial Average:
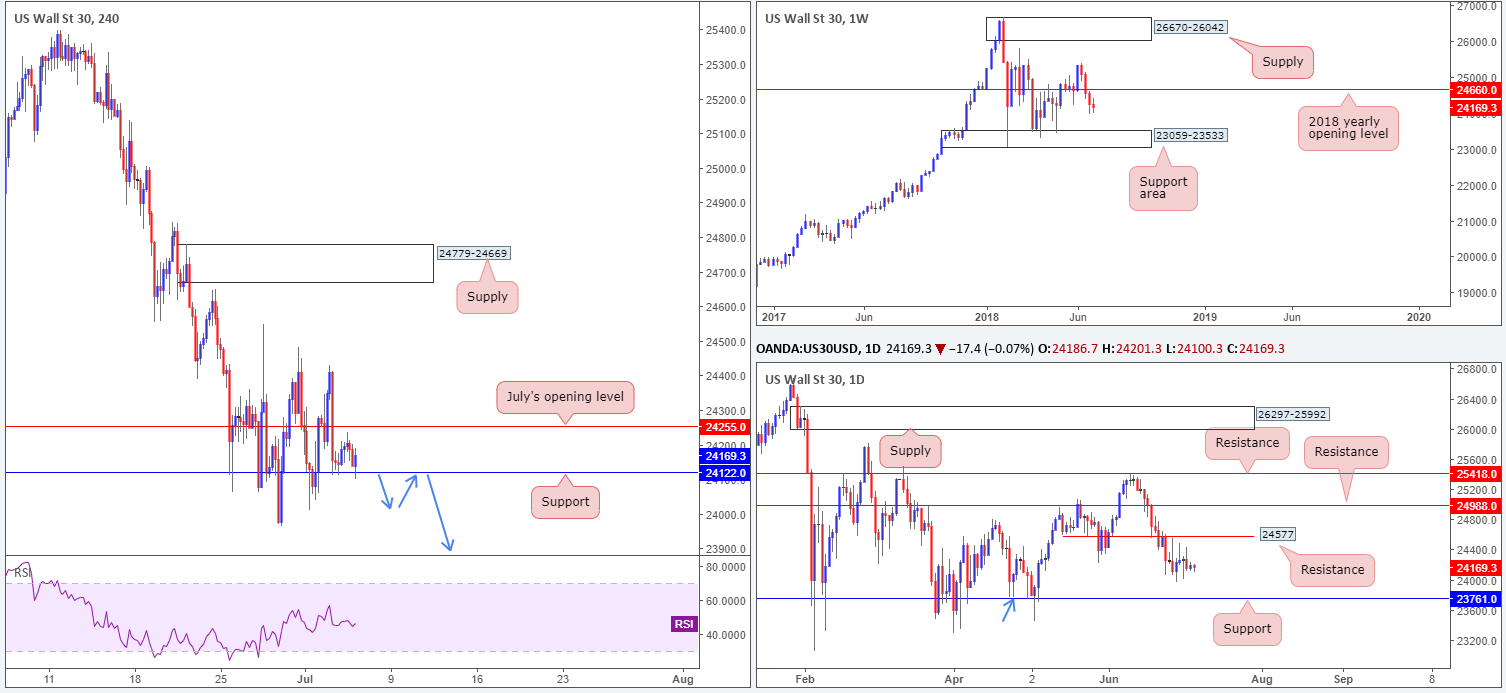
Tackling this market from the top this morning, we can see the sellers are clearly in the driving seat at the moment. After crossing below the 2018 yearly opening level at 24660 in strong fashion, and remaining defensive beneath this number, we see little structure stopping weekly price from tagging the support area at 23059-23533.
Daily movement, on the other hand, continues to linger between resistance at 24577 and support coming in at 23761. Note this support base also represents a daily Quasimodo support shown marked with a blue arrow.
H4 support at 24122, as you can see, is in play right now. Resistance is seen close by in the form of July’s opening level at 24255. A decisive push beyond the current support level (strong possibility given higher-timeframe structure) could potentially provide an early cue to a move down to daily support mentioned above at 23761.
Areas of consideration:
Seeing as there’s space to probe lower on the higher timeframes, a H4 close beneath the current H4 support level is of interest. Assuming this comes to fruition and price retests the underside of this level as resistance in the shape of a full or near-full-bodied H4 bearish candle, the odds of a move down to the daily support level at 23761 is high, according to the technicals.
Today’s data points: US ADP non-farm employment change; US unemployment claims; US ISM non-manufacturing PMI; FOMC meeting minutes.
XAU/USD (Gold):
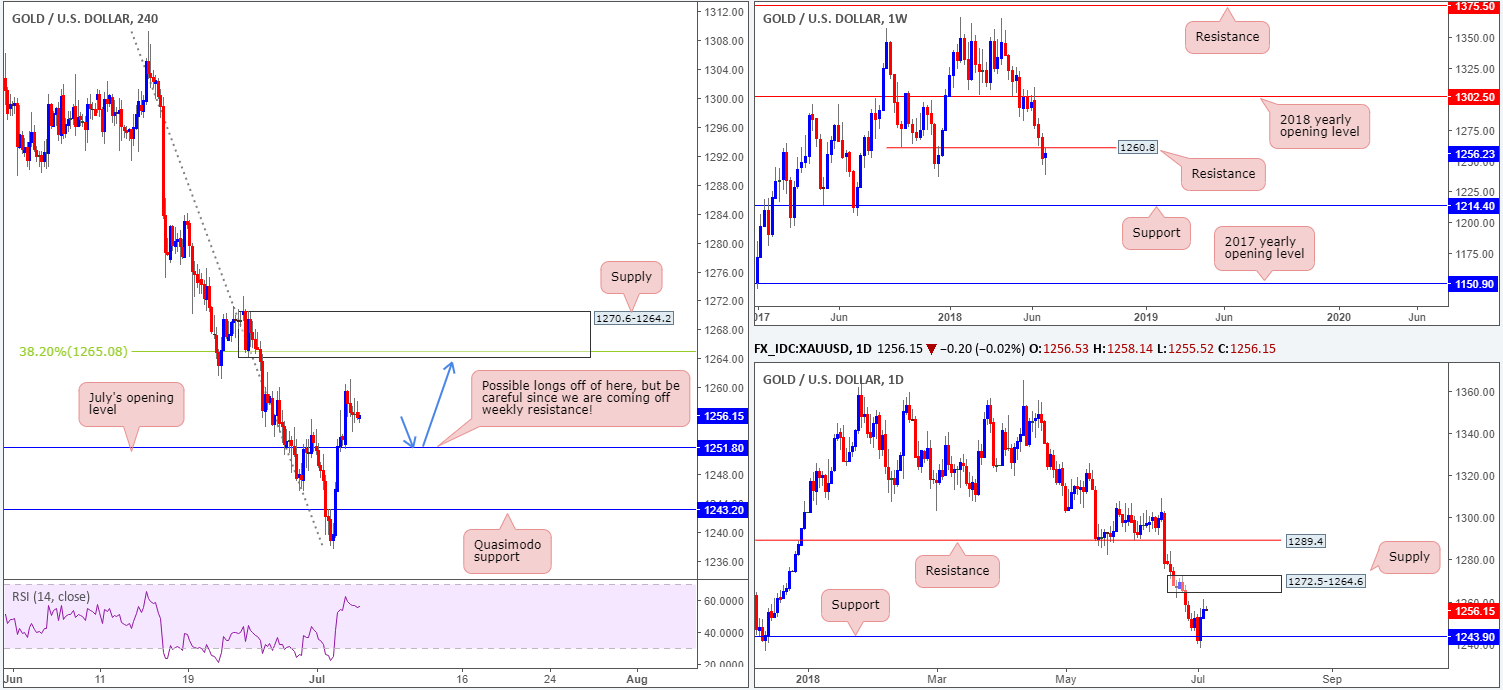
Printing its second consecutive daily gain on Wednesday, bullion tested the underside of a recently broken weekly Quasimodo support at 1260.8 (now marked as resistance). Not only was the upside move bolstered by daily buyers extending gains off daily support at 1243.9, the recent USD decline also likely had a part to play here.
According to H4 structure, a retest of July’s opening level at 1251.8 could be something to keep eyes on today, targeting H4 supply marked at 1270.6-1264.2. The other key thing to note regarding this H4 supply is it houses a 38.2% H4 Fib resistance value at 1265.0 within, and is encapsulated within daily supply at 1272.5-1264.6 – the next upside target on the daily scale.
Areas of consideration:
Without analyzing the weekly timeframe, traders will likely be unaware of weekly resistance in play right now. This is particularly dangerous for those looking to buy at market on any retest off July’s opening level on the H4 timeframe at 1251.8. To be safe, we would strongly recommend waiting for H4 price to print a full or near-full-bodied bull candle off 1251.8, before pulling the trigger. Yes, this will get you in at a less favorable price, but it will get you in AFTER buyers have shown possible INTENT (which is valued given where we are coming from on the weekly timeframe). Stops can be positioned beyond the rejection candle’s tail, with the initial take-profit target set at 1264ish – essentially the underside of both H4 and daily supplies mentioned above.
The use of the site is agreement that the site is for informational and educational purposes only and does not constitute advice in any form in the furtherance of any trade or trading decisions.
The accuracy, completeness and timeliness of the information contained on this site cannot be guaranteed. IC Markets does not warranty, guarantee or make any representations, or assume any liability with regard to financial results based on the use of the information in the site.
News, views, opinions, recommendations and other information obtained from sources outside of www.icmarkets.com.au, used in this site are believed to be reliable, but we cannot guarantee their accuracy or completeness. All such information is subject to change at any time without notice. IC Markets assumes no responsibility for the content of any linked site. The fact that such links may exist does not indicate approval or endorsement of any material contained on any linked site.
IC Markets is not liable for any harm caused by the transmission, through accessing the services or information on this site, of a computer virus, or other computer code or programming device that might be used to access, delete, damage, disable, disrupt or otherwise impede in any manner, the operation of the site or of any user’s software, hardware, data or property.


