
EUR/USD:
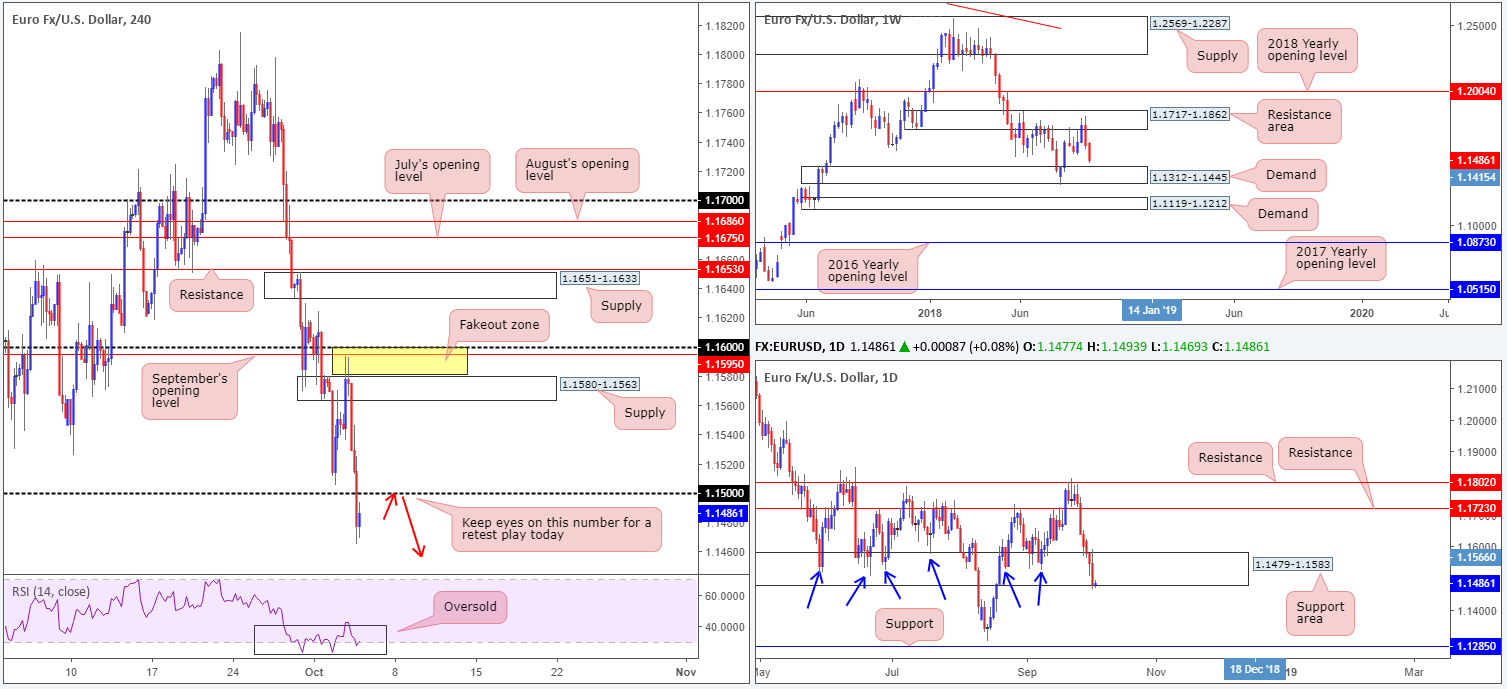
Despite staging a modest recovery just north of the 1.15 handle on the H4 timeframe, the single currency whipsawed through supply at 1.1580-1.1563 (likely devouring stops) and fell sharply just ahead of September’s opening level at 1.1595 during Wednesday’s sessions. Italian budget headlines, coupled with disappointing macroeconomic data releases out of Europe and upbeat US numbers, collectively weighed on the EUR/USD pair. US ADP surprised investors reporting a 230k jump in private payrolls last month. US ISM non-manufacturing PMI also leaped last month indicating economic activity has strengthened in the US, hitting a 21-year high at 61.6 (prev. 60.4).
Well done to those who managed to jump aboard yesterday’s precipitous decline. A fakeout of the current H4 supply zone to bring in sellers from September’s opening level at 1.1595/round number 1.16 was a highlighted move to keep eyeballs on in Wednesday’s briefing.
With 1.15 likely to act as resistance, and the trail south likely cleared towards H4 demand plotted at 1.1394-1.1423 (not seen on the screen), the unit may be gearing up for additional selling today. In conjunction with H4 flow, the daily support area at 1.1479-1.1583, as you can see, suffered a marginal breach to its lower edge on Wednesday, potentially setting the stage for a continuation move south towards the top edge of weekly demand at 1.1312-1.1445.
Areas of consideration:
A visibly weakened daily support area, along with a gap to push south on the weekly timeframe, will likely tug the unit lower today. On account of this, a retest play to the underside of 1.15 in the shape of a H4 bearish candlestick formation would be considered a reasonably solid sell signal, with an initial target objective set at 1.1445: the top edge of weekly demand, followed closely by the top edge of H4 demand mentioned above at 1.1423.
Today’s data points: FOMC member Quarles speaks.
GBP/USD:
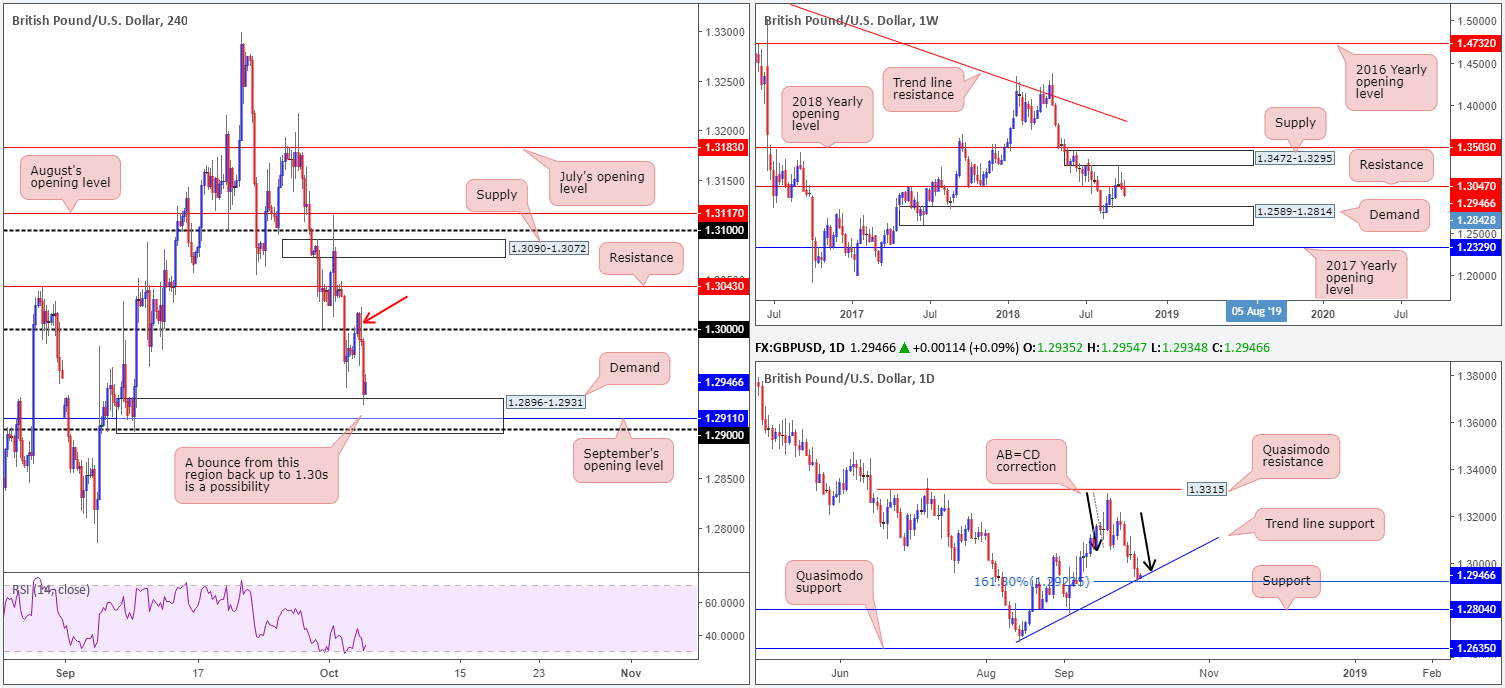
A slightly sub-forecast UK services PMI as well as an upbeat greenback witnessed H4 price take a run at the underside of 1.30 on Wednesday. Despite an earnest effort from the buyers, price failed to sustain gains beyond highs of 1.3022 before piling lower and testing the top edge of demand at 1.2896-1.2931 into the close. The H4 bearish pin-bar formation marked with a red arrow was an ideal sell signal to bring price action lower. In fact, the team highlighted this as a possible setup in Wednesday’s report. Well done to any of our readers who managed to board this train!
The current H4 demand, aside from being a take-profit target for shorts, is also a zone worthy of longs today. Not only does it house September’s opening level at 1.2911 and the 1.29 handle, it also converges with a daily AB=CD termination point at 1.2927: its 161.8% Fib ext. (also labelled an alternate AB=CD pattern as per Scott Carney). Collectively, this is likely enough confluence to produce a bounce, at the very least. The only grumble here, however, is the weekly timeframe indicating further downside may be on the cards towards demand at 1.2589-1.2814.
Areas of consideration:
A H4 bullish configuration out of the H4 demand today would, according to where we are positioned on the daily timeframe, likely be considered a relatively strong buy signal with the potential to at least bring the unit back up to the 1.30s. The reason for requiring additional candlestick confirmation is simply due to weekly flow (see above).
Today’s data points: FOMC member Quarles speaks.
AUD/USD:
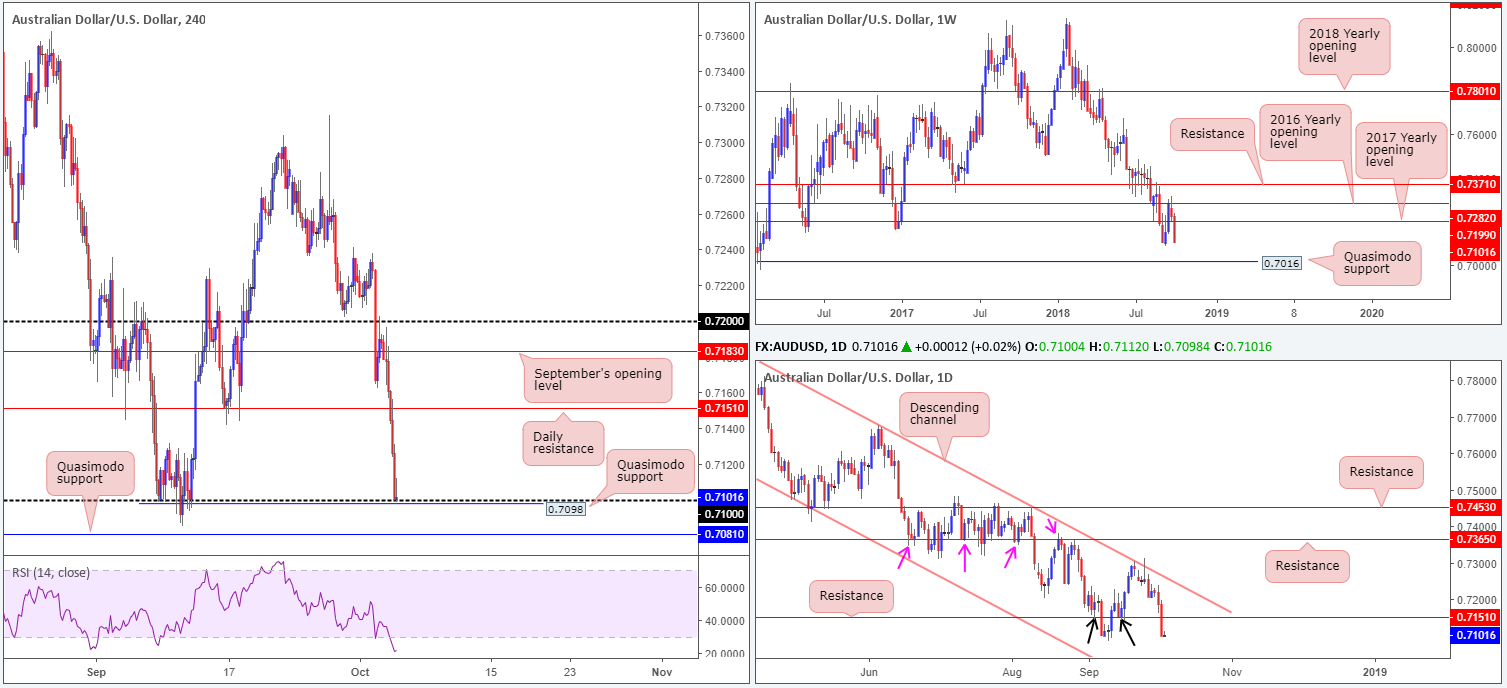
By way of a near-full-bodied daily bearish candle, Wednesday saw the commodity currency extend recent losses in strong fashion as the US dollar continued to rise against the majority of G10 currencies. A combination of weak Aussie data and an increasingly hawkish US Federal Reserve, dragged the pair down to within striking distance of 2018 lows.
From a technical perspective, weekly price has little to cheer about. Aside from 2018 lows of 0.7085, limited support is seen in this market until reaching a Quasimodo base at 0.7016. Unfortunately the daily timeframe is in the same boat, with the next downside target on this scale also not surfacing until 0.7016.
H4 price, on the other hand, is seen grappling with its 0.71 handle, as we write. Reinforced by a Quasimodo support at 0.7098, this number could offer some respite today. In the event we continue to press lower, however, another layer of Quasimodo support is visible at 0.7081 taken all the way back from February 2016!
Areas of consideration:
Although a recovery from the aforementioned H4 supports will take place, it’s likely to be feeble given seller strength at the moment. Therefore, passing on any long signals printed from these areas is worth considering.
Should the market observe a decisive H4 break of Quasimodo support at 0.7081, followed up with a retest (preferably in the shape of a H4 bearish configuration), this would be a strong cue to begin thinking about joining the sellers, targeting the noted higher-timeframe support.
Today’s data points: Australian trade balance; FOMC member Quarles speaks.
USD/JPY:
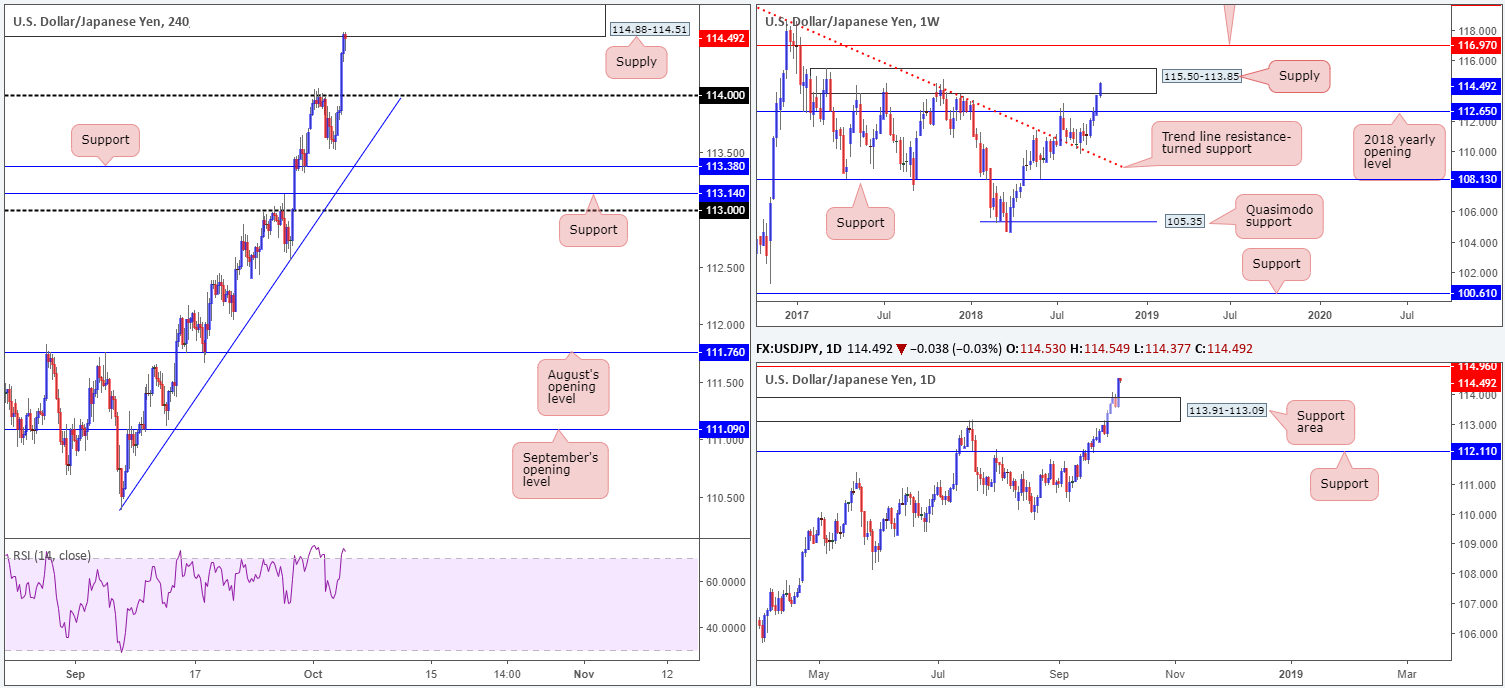
After devouring its 114 handle on the H4 scale, the US dollar advanced to fresh 2018 highs against its Japanese counterpart on Wednesday. Fuelled by broad US dollar strength and rising US treasury yields, we can also see yesterday’s move higher broke through the top edge of daily supply at 113.91-113.09 (now an acting support area).
While USD/JPY bulls are in fine form, do bear in mind what’s on the horizon. Weekly price is seen crossing swords with a major supply zone at 115.50-113.85. Note this area has capped upside since May of 2017. Against the backdrop, market structure also highlights a daily Quasimodo resistance level at 114.96 as the next upside hurdle on this scale (seen at the top of the screen). Further adding to this, H4 supply at 114.88-114.51, positioned just south of the 115 handle, is also in play.
Areas of consideration:
Although a pullback may occur from the current H4 supply zone, a more favourable area for shorts may be at the daily Quasimodo resistance level mentioned above at 114.96. By entering short from this angle, traders have the option of positioning stops above the weekly supply at 115.50-113.85, and the consumption of stop-loss orders above the noted H4 supply will likely provide pro money part of the liquidity it needs to sell (the daily Quasimodo resistance is positioned a few pips above here).
While we understand a short from 114.96 with a stop placement of 115.52 is rather large, do keep in mind that a 56-pip move on the weekly timeframe is nothing more than a blip. The risk/reward from 114.96, therefore, could be substantial if we get back to its 2018 yearly opening level at 112.65.
Today’s data points: FOMC member Quarles speaks.
USD/CAD:
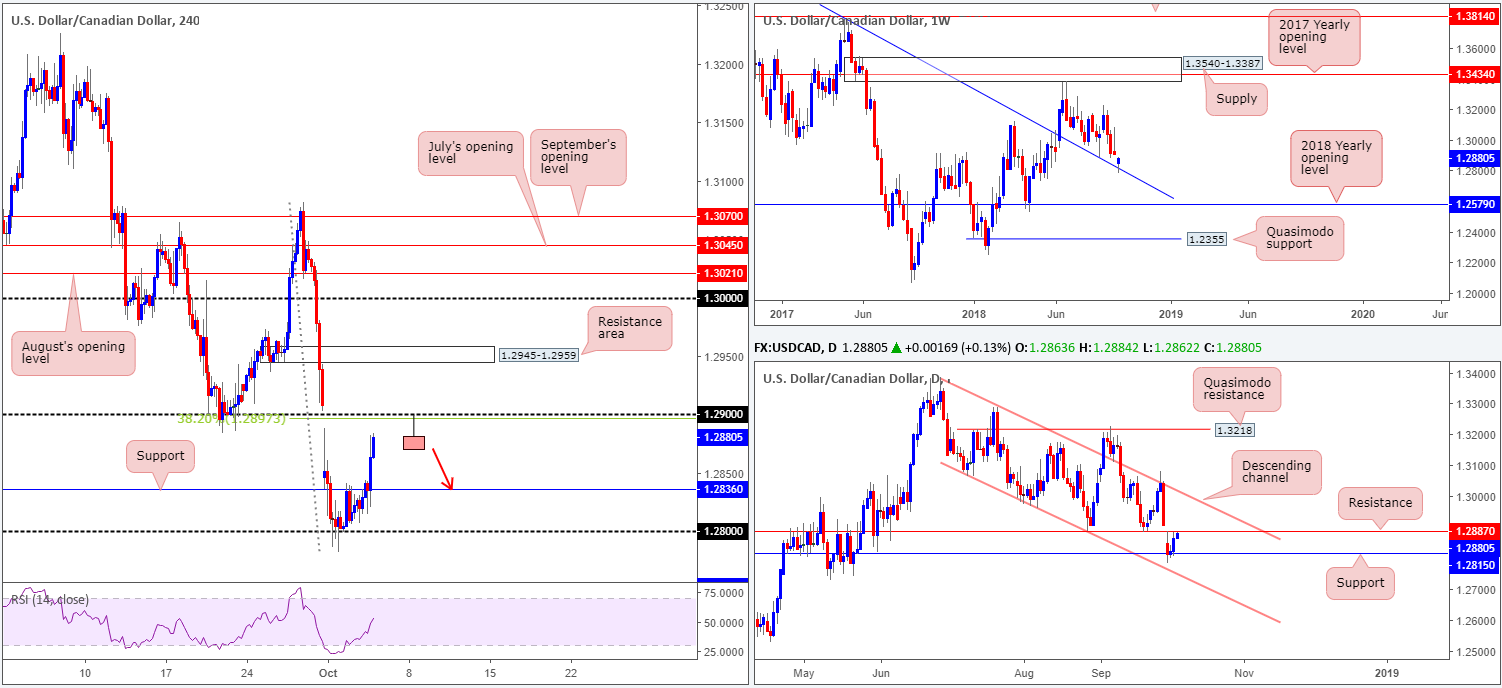
Kicking off from the top this morning, a USD/CAD recovery appears to be underway off a weekly trend line resistance-turned support (extended from the high 1.4689). This barrier supported this market once already back in late August, so there’s a chance we may see history repeat itself.
On the other side of the coin, nonetheless, daily movement is seen trading within touching distance of resistance coming in at 1.2887. This level boasts reasonably sound history, hence a mild pullback from here should not come as a surprise. A break of this base to the upside, according to the daily scale, likely clears the pathway towards channel resistance (etched from the high 1.3386).
Intraday flow on the H4 timeframe traded on a strong footing during Wednesday’s sessions, breaking/retesting resistance at 1.2836. As you can see, the pair is now poised to shake hands with the underside of 1.29, which not only held as support from September 19-21, the number also boasts additional resistance from a 38.2% Fib value at 1.2897.
Areas of consideration:
A H4 bearish pin-bar formation printed from 1.29 today that CLOSES back beneath daily resistance mentioned above at 1.2887 (see the H4 chart for a visual representation) is, technically speaking, likely enough to draw in sellers back towards H4 support at 1.2836. Taking a large portion of the position off the table from here is recommended since let’s not forget where we’re coming from on the weekly timeframe!
As for entry and stop-loss placement, traders may look to the close of the H4 bearish pin-bar formation as an entry point, and two pips above its wick as a stop-loss location.
Today’s data points: FOMC member Quarles speaks; CAD Ivey PMI.
USD/CHF:
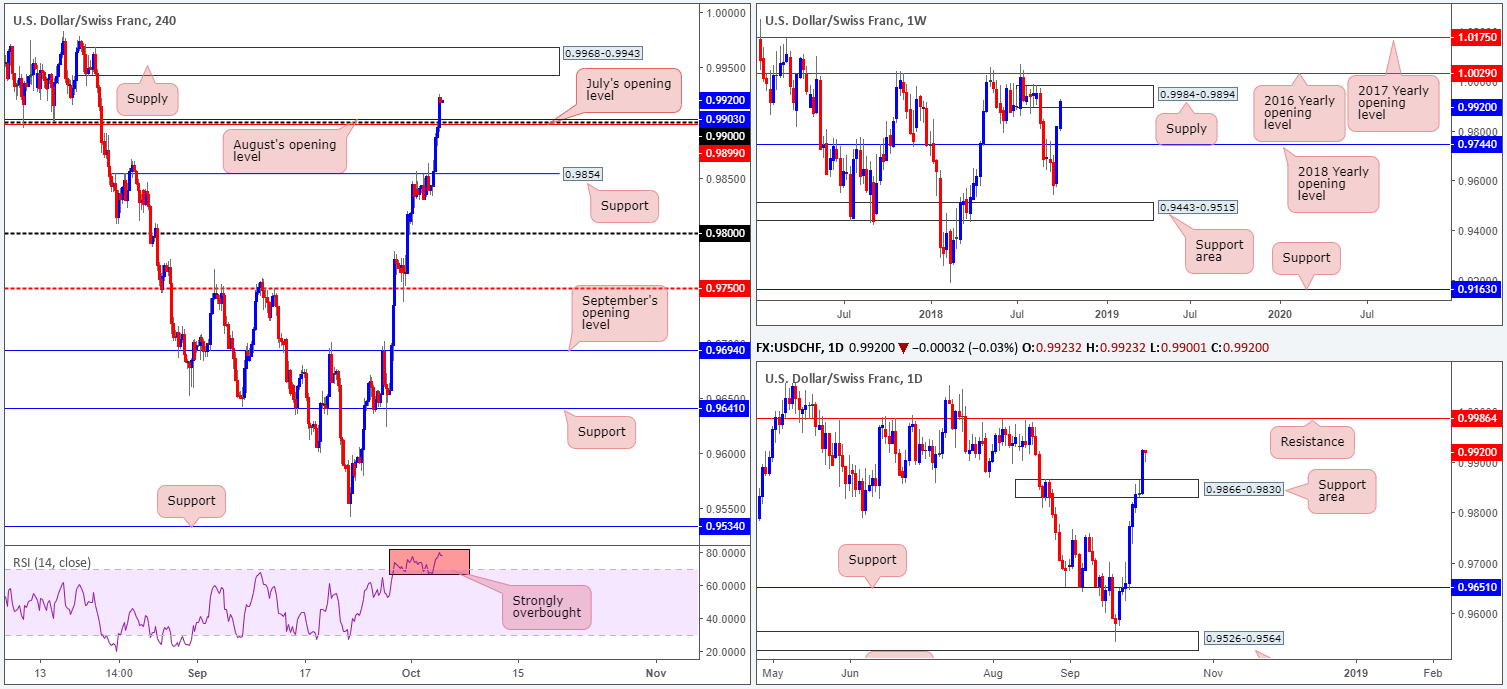
US ADP employment and the non-manufacturing PMI came in hotter than expected on Wednesday, bolstering the greenback across the board. The H4 Quasimodo resistance level at 0.9854, although attempted to hold price lower, gave way under USD strength yesterday. This, as you can see on the H4 scale, brought price beyond the key figure 0.99. We like this base due to it merging closely with August’s opening level at 0.9903 and also July’s opening level at 0.9899. Note also the recent retest of this level is shaped in the form of a H4 bullish pin-bar pattern.
On a wider perspective, however, weekly price is seen firmly engaging with strong supply drawn from 0.9984-0.9894. In terms of structure, this area boasts solid momentum out of its base. Daily action, although the unit could find resistance at current price due to weekly supply, could potentially stretch as high as resistance seen at 0.9986.
Areas of consideration:
For folks looking to buy the current H4 bullish pin-bar formation off 0.99, upside is somewhat limited owing to nearby H4 supply plotted at 0.9968-0.9943 that’s positioned within the current weekly supply zone. Therefore, trade with caution!
Failure to climb from 0.99 will likely result in a pullback to 0.9854 on the H4 scale. A retest to the underside of 0.99 in the shape of a bearish candlestick formation (either H4 or on the lower timeframes) would be considered a strong sell signal.
Today’s data points: FOMC member Quarles speaks.
Dow Jones Industrial Average:
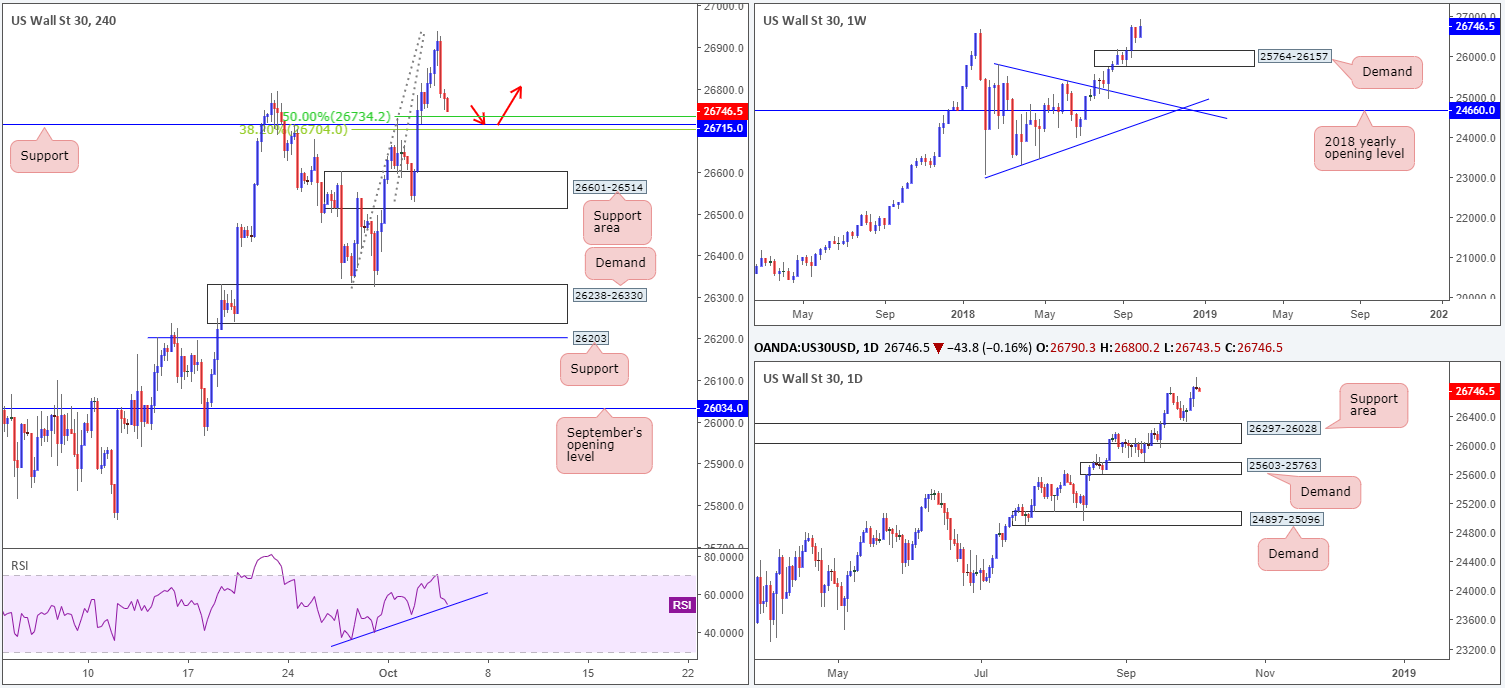
In recent sessions, the Dow Jones Industrial Average printed a clear-cut daily bearish pin-bar formation off record highs at 26937. Despite the bearish connotation associated with this candle pattern, H4 support at 26715, and its nearby H4 Fib supports 26704/26734, remains of interest for possible longs today. Also on the H4 scale the RSI indicator is fast approaching a trend line support.
In the event price fails to hold ground at 26715, though, traders should be prepared for a move towards the H4 support area located at 26601-26514. This area is essentially the origin of the move to fresh record highs, and therefore commands attention.
Areas of consideration:
With the unit seen trading off record highs, intraday attention is drawn to the nearby H4 support at 26715. A firm retest off of this level (red arrows) in the form of a H4 bullish candlestick formation (entry and stop-loss placement is dictated by this structure) would likely be enough to encourage further buying. The idea behind waiting for additional candle confirmation before pulling the trigger is simply due to the daily bearish pin-bar pattern recently forming.
Should a trade from 26715 come to fruition, the initial take-profit zone falls in around 26937. A break of this number and we’re then in unchartered territory again for additional gains!
Today’s data points: FOMC member Quarles speaks.
XAU/USD (Gold)
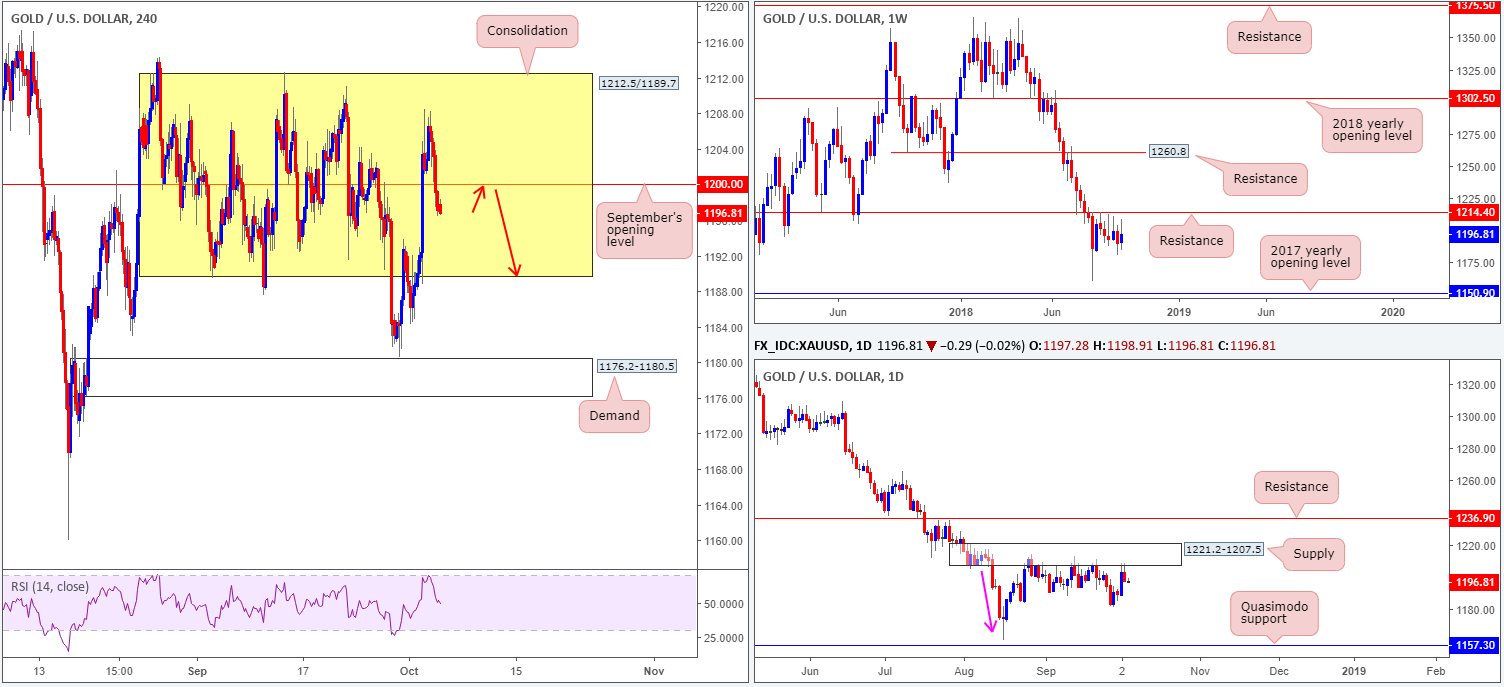
With the greenback recently conquering its 96.00 mark to the upside, bullion surrendered a portion of Tuesday’s gains off highs of 1208.2 on Wednesday. H4 action, as you can see, remains confined within a range between 1212.5/1189.7, which happens to hold September’s opening level at 1200.0.
Notable daily supply at 1221.2-1207.5, technically speaking, likely helped sellers drive price action lower yesterday. Note the lower edge of this region is positioned within the upper limits of the current H4 range. Another key observation to bear in mind in this market is weekly price languishing beneath a key resistance level at 1214.4 that shows room to press as far south as 1150.9: the 2017 yearly opening level.
Areas of consideration:
In light of where price is trading from on the higher timeframes, a long off the H4 range support 1189.7 is likely a high-risk trade. You’re simply buying against higher-timeframe flow here.
A sell on the retest of September’s opening level at 1200.0, on the other hand, might be something to consider today. A retest backed up with a H4 bearish candlestick configuration (Stop/entry parameters set according to this structure) is likely to draw in traders down to at least the range support mentioned above: first take-profit target for shorts. A break of the range edge, and H4 demand is once again back on the radar at 1176.2-1180.5.
The use of the site is agreement that the site is for informational and educational purposes only and does not constitute advice in any form in the furtherance of any trade or trading decisions.
The accuracy, completeness and timeliness of the information contained on this site cannot be guaranteed. IC Markets does not warranty, guarantee or make any representations, or assume any liability with regard to financial results based on the use of the information in the site.
News, views, opinions, recommendations and other information obtained from sources outside of www.icmarkets.com.au, used in this site are believed to be reliable, but we cannot guarantee their accuracy or completeness. All such information is subject to change at any time without notice. IC Markets assumes no responsibility for the content of any linked site. The fact that such links may exist does not indicate approval or endorsement of any material contained on any linked site.
IC Markets is not liable for any harm caused by the transmission, through accessing the services or information on this site, of a computer virus, or other computer code or programming device that might be used to access, delete, damage, disable, disrupt or otherwise impede in any manner, the operation of the site or of any user’s software, hardware, data or property.


