
Key risk events today:
Canada Trade Balance; US Unemployment Claims; BoE Gov Bailey Speaks; US ISM Non-Manufacturing PMI.
(Previous analysis as well as outside sources – italics).
EUR/USD:
Europe’s shared currency tumbled for a second consecutive session on Wednesday as the US dollar index made its way back above 92.50, unfazed by the ADP reporting an increase of 428K private-sector jobs in August, a figure considerably under market consensus.
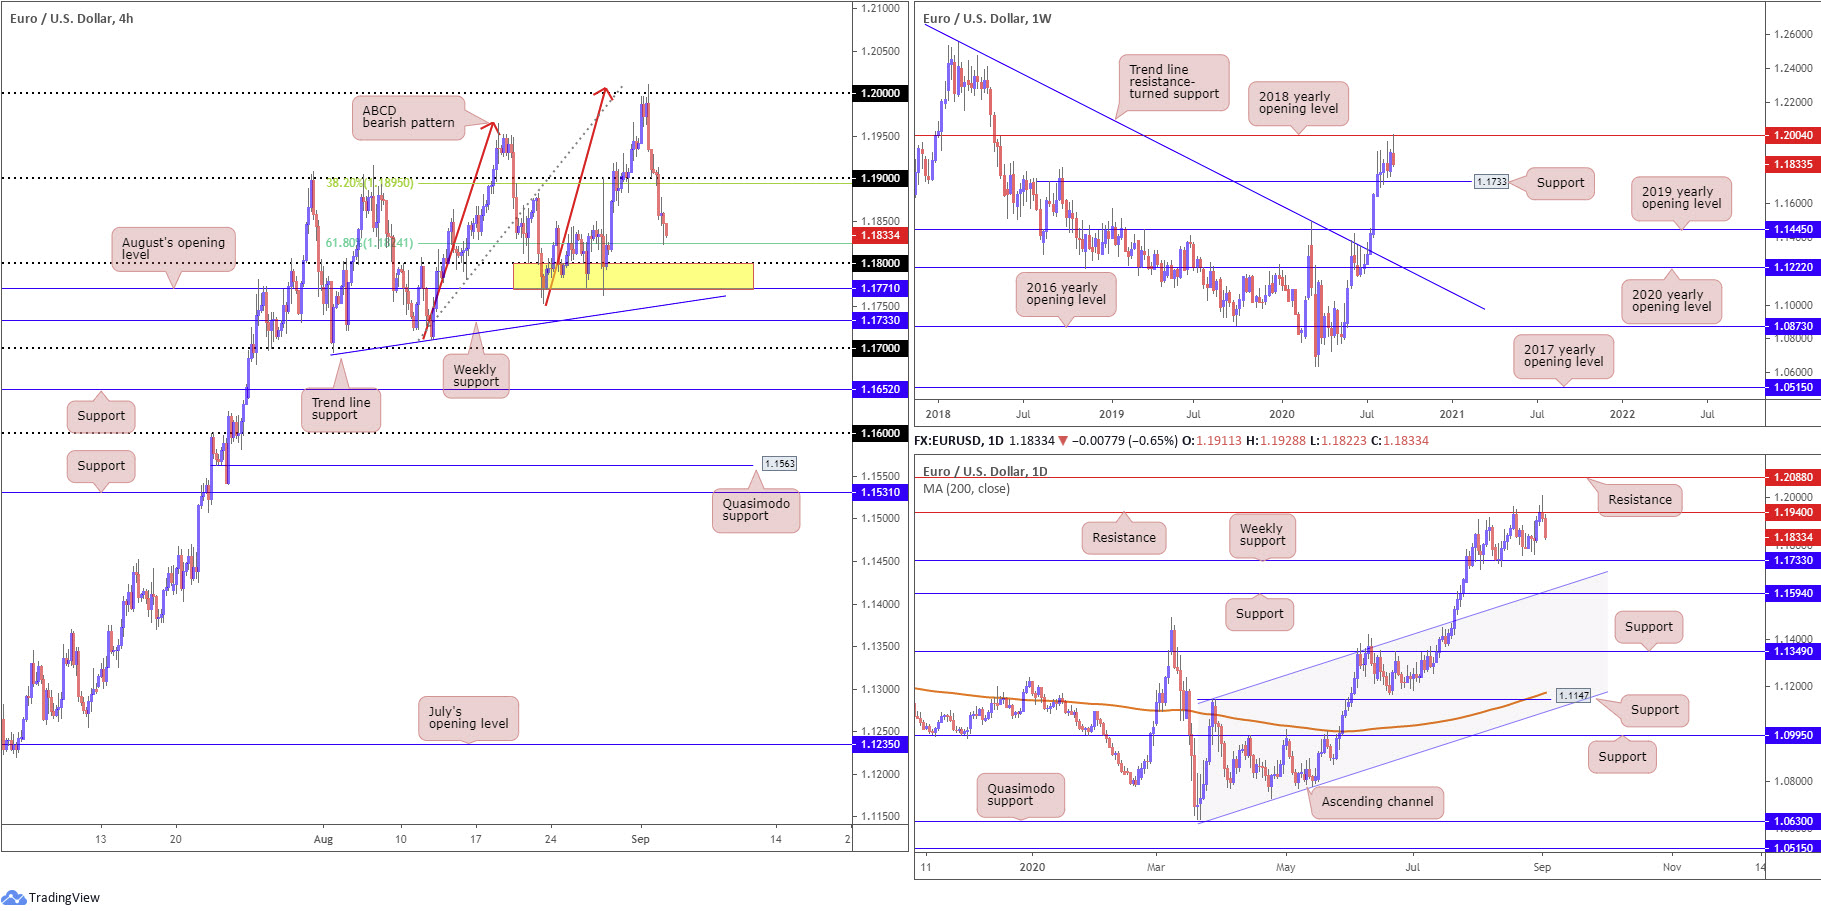
Technically, H4 voyaged south of 1.19 and a 38.2% Fibonacci retracement ratio at 1.1895, and recently shook hands with a 61.8% Fibonacci retracement ratio at 1.1824. For those who have been reading previous technical briefings you may recall the following (italics):
1.20 is likely a watched figure going forward, not only as a take-profit target for bullish themes from 1.19 (and any intraday breakout signals taken above 1.1965), but also as a potential reversal zone given the H4 ABCD confluence and weekly resistance at 1.2004 (2018 yearly opening level).
As mentioned above, from the H4 chart we tapped the 61.8% Fib in recent trading, which has likely seen many ABCD sellers cover short positions (a common take-profit target out of ABCD formations). Next on tap is a nearby familiar support between August’s opening level at 1.1771 and the 1.18 handle (yellow).
Areas of consideration:
Sellers short 1.20 (H4 ABCD) have likely liquidated a major portion of their position, yet some may continue holding due to the higher timeframe picture. Both the weekly and daily chart show price trading from resistance (1.2004/1.1940) and suggest we could pursue additional downside beyond 1.18, with room to decline as far south as 1.1733 support, a prior Quasimodo resistance level on the weekly timeframe.
Therefore, although August’s opening level at 1.1771, along with trend line support, taken from the low 1.1695 on the H4, could attempt to hamper downside, additional bearish scenarios could still be upon us to 1.1733.
GBP/USD:
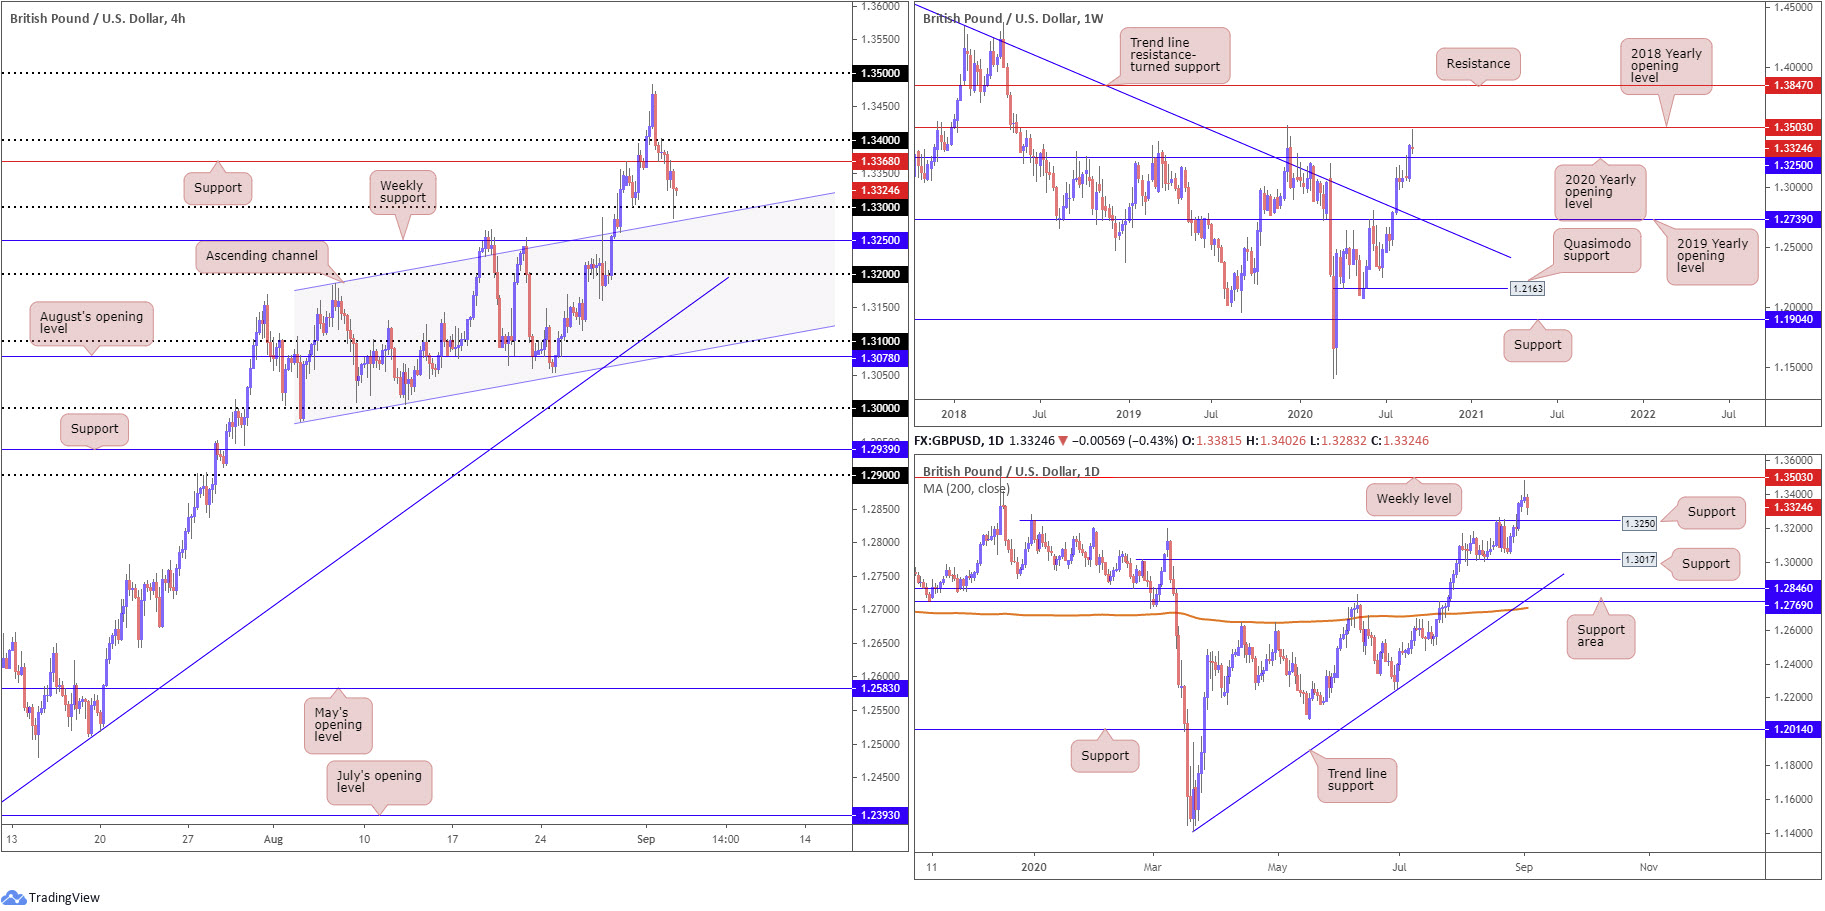
Dovish commentary from BoE officials, in addition to the US dollar index cruising above 92.50, guided GBP/USD to lower territory on Wednesday. Technically, this forced H4 candles through support at 1.3368 (followed by a swift retest) to the 1.33 handle, positioned nearby channel support, taken from the high 1.3185. Further selling on the H4 has the 1.32 handle to target.
With the higher timeframe picture indicating an absence of support until reaching 1.3250, the 2020 yearly opening level, we may surpass 1.33 on the H4 and fakeout through channel support to reach the 1.3250ish region.
Areas of consideration:
Keeping things simple this morning, going on the above chart studies, a H4 whipsaw through channel support to 1.3250 could be enough to lure bullish signals today. A close back above 1.33 will, of course, add weight to the bullish vibe, triggering in breakout buy signals.
AUD/USD:
The Australian dollar retained a heavy tone on Wednesday, following Tuesday fading YTD peaks at 0.7413. The Aussie fell sharply in early trading on the back of disappointing growth data, followed by a DXY recovery that overlooked downbeat ADP US non-farm payrolls.
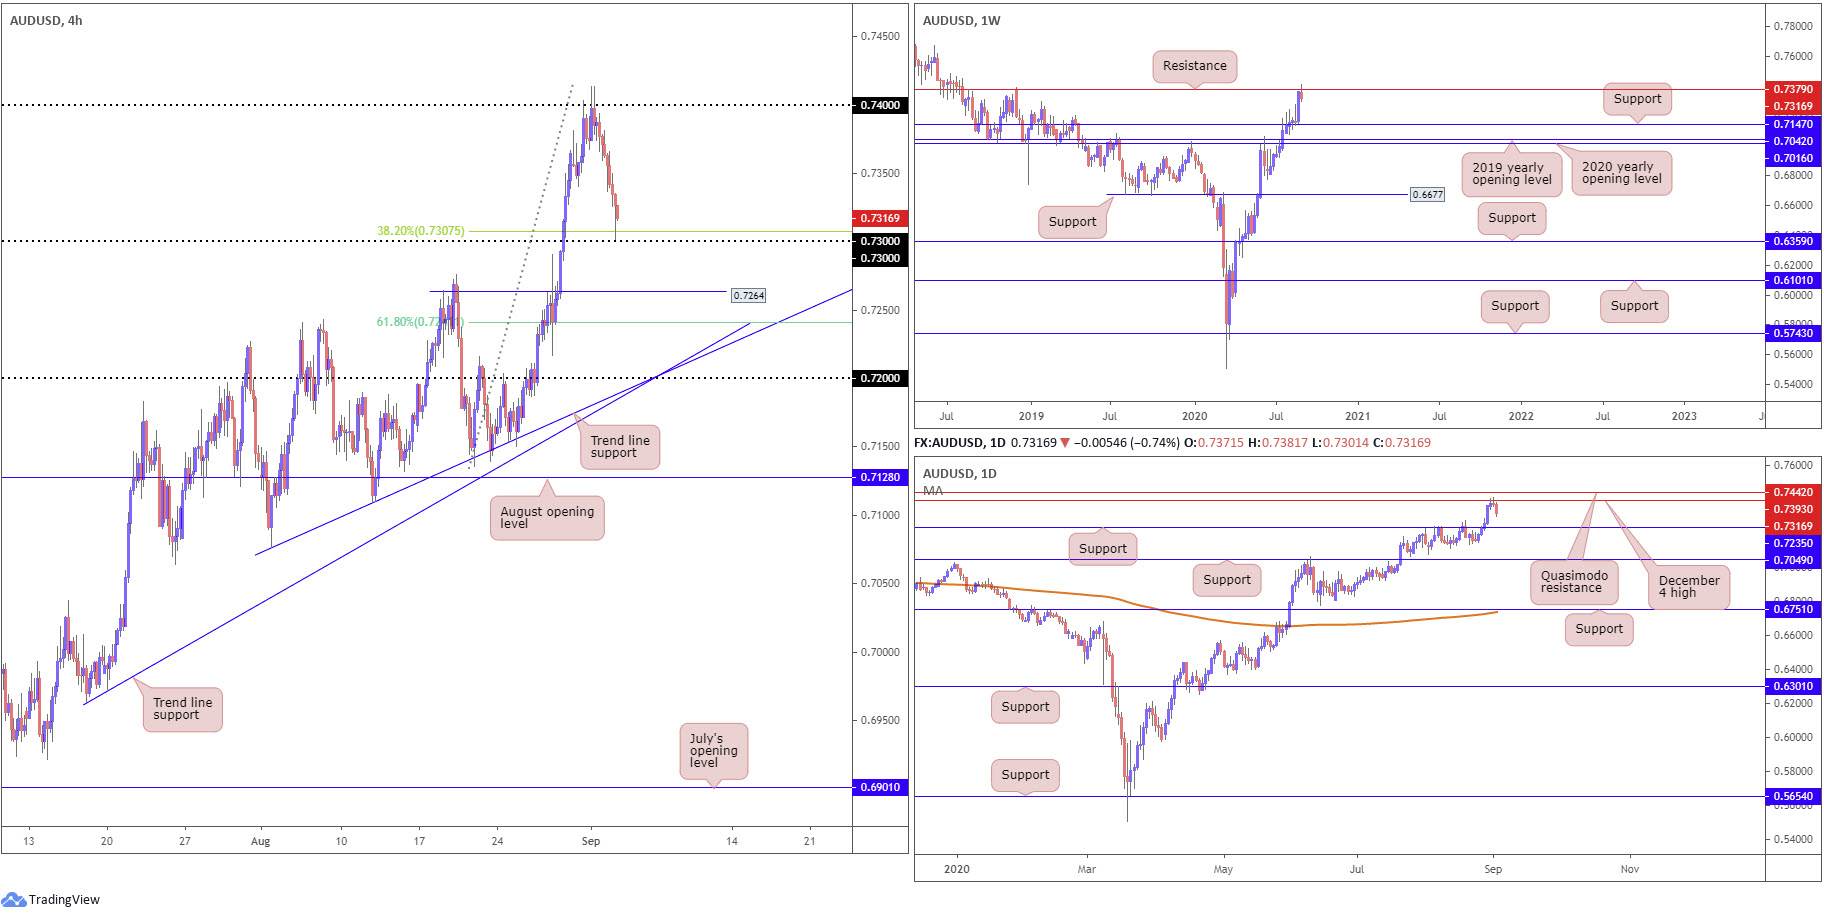
The H4 candles, as can be seen from the chart, dropped to lows just north of the 0.73 handle, although testing the 38.2% Fibonacci retracement ratio at 0.7307. While bulls have commanded some attention ahead of the round number, prudent traders will note support listed at 0.7264 in the event we seek lower ground, a prior Quasimodo resistance level.
Further out, longer-term activity is seen gathering traction from resistance at 0.7379 on the weekly timeframe. By the same token, daily movement recently faded the 0.7393 December 4 high. With reference to prospective support, the daily timeframe presents structure at 0.7235, a prior Quasimodo resistance level, with a break exposing weekly support at 0.7147.
It might also interest some traders to note the trend in this market has faced a northerly trajectory since bottoming mid-March.
Areas of consideration:
The fact we’re starting to establish some presence off higher timeframe resistances right now, any upside attempts off 0.73 on the H4 today may lack enthusiasm. With that being the case, a H4 close through 0.73 may excite sellers, as breakout players hone in on H4 support at 0.7264, and quite possibly the daily support at 0.7235.
It may also interest traders, particularly dip-buyers seeking a platform of support, to note the 61.8% H4 Fibonacci retracement ratio at 0.7241 converges closely with daily support mentioned above at 0.7235.
USD/JPY:
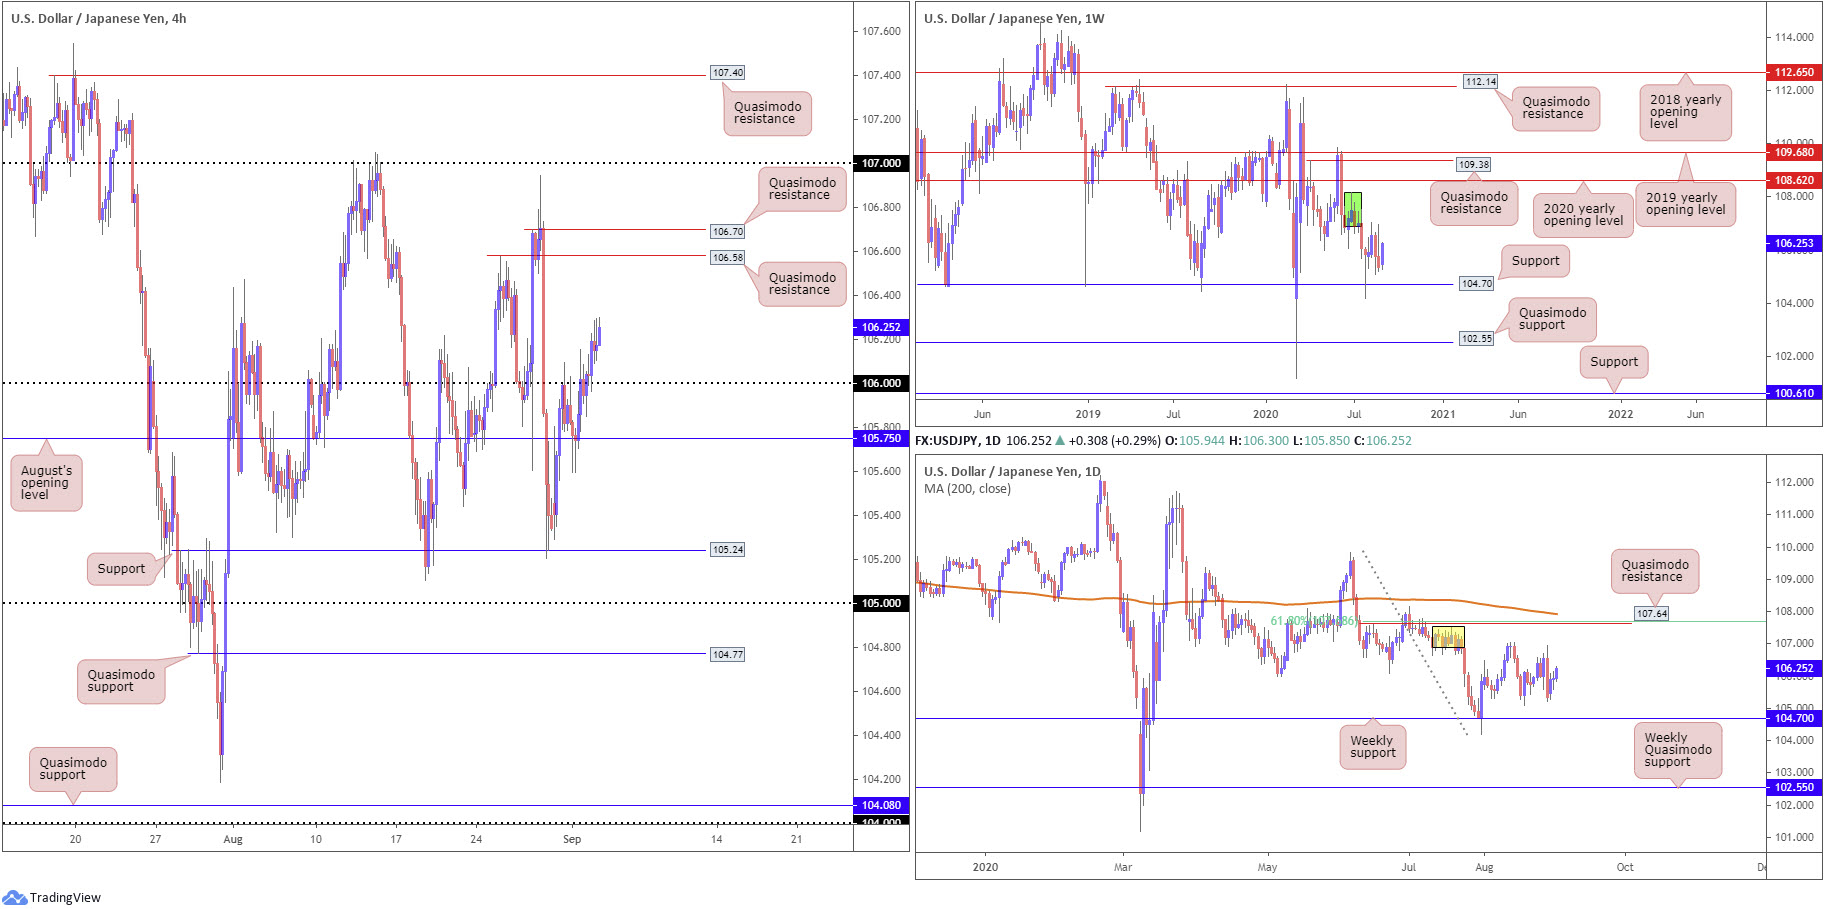
Despite much lower-than-forecast US ADP non-farm employment change, the US dollar led things higher against the Japanese yen on Wednesday, clearing ground above a somewhat stubborn 106 handle on the H4. As underlined in previous writing, traders were likely to show interest in bullish scenarios in the event of a H4 close above 106, targeting Quasimodo resistance at 106.58, closely shadowed by another Quasimodo formation at 106.70. The initial H4 close north of 106 was shortly after followed up with a 106 retest (see H1 for a clearer view) before the unit switched gears and gathered momentum to the upside.
Supply remains prominent on the weekly timeframe at 108.16-106.88 (dark green) after price made its way off support at 104.70 at the end of July. Should buyers hold onto recent upside, the 2020 yearly opening level at 108.62 may eventually enter view, closely followed by Quasimodo resistance at 109.38.
From the daily timeframe, supply at 107.55/106.89 (yellow), an area housed within the lower boundary of weekly supply mentioned above at 108.16-106.88, is also proving a tough nut to crack, with further downside to also potentially target the weekly support underlined above at 104.70. In the event buyers make a comeback, Quasimodo resistance at 107.64 might enter play, reinforced by a 61.8% Fibonacci retracement ratio at 107.68 and the 200-day SMA (orange – 107.92).
Areas of consideration:
Those long the retest at 106, based on the H4 timeframe, will likely be honing in on H4 Quasimodo resistance at 106.58 as an initial target.
The next port of call beyond 106, aside from another H4 Quasimodo resistance at 106.70, is the underside of higher timeframe supply on the weekly and daily timeframes between 106.89/88.
USD/CAD:
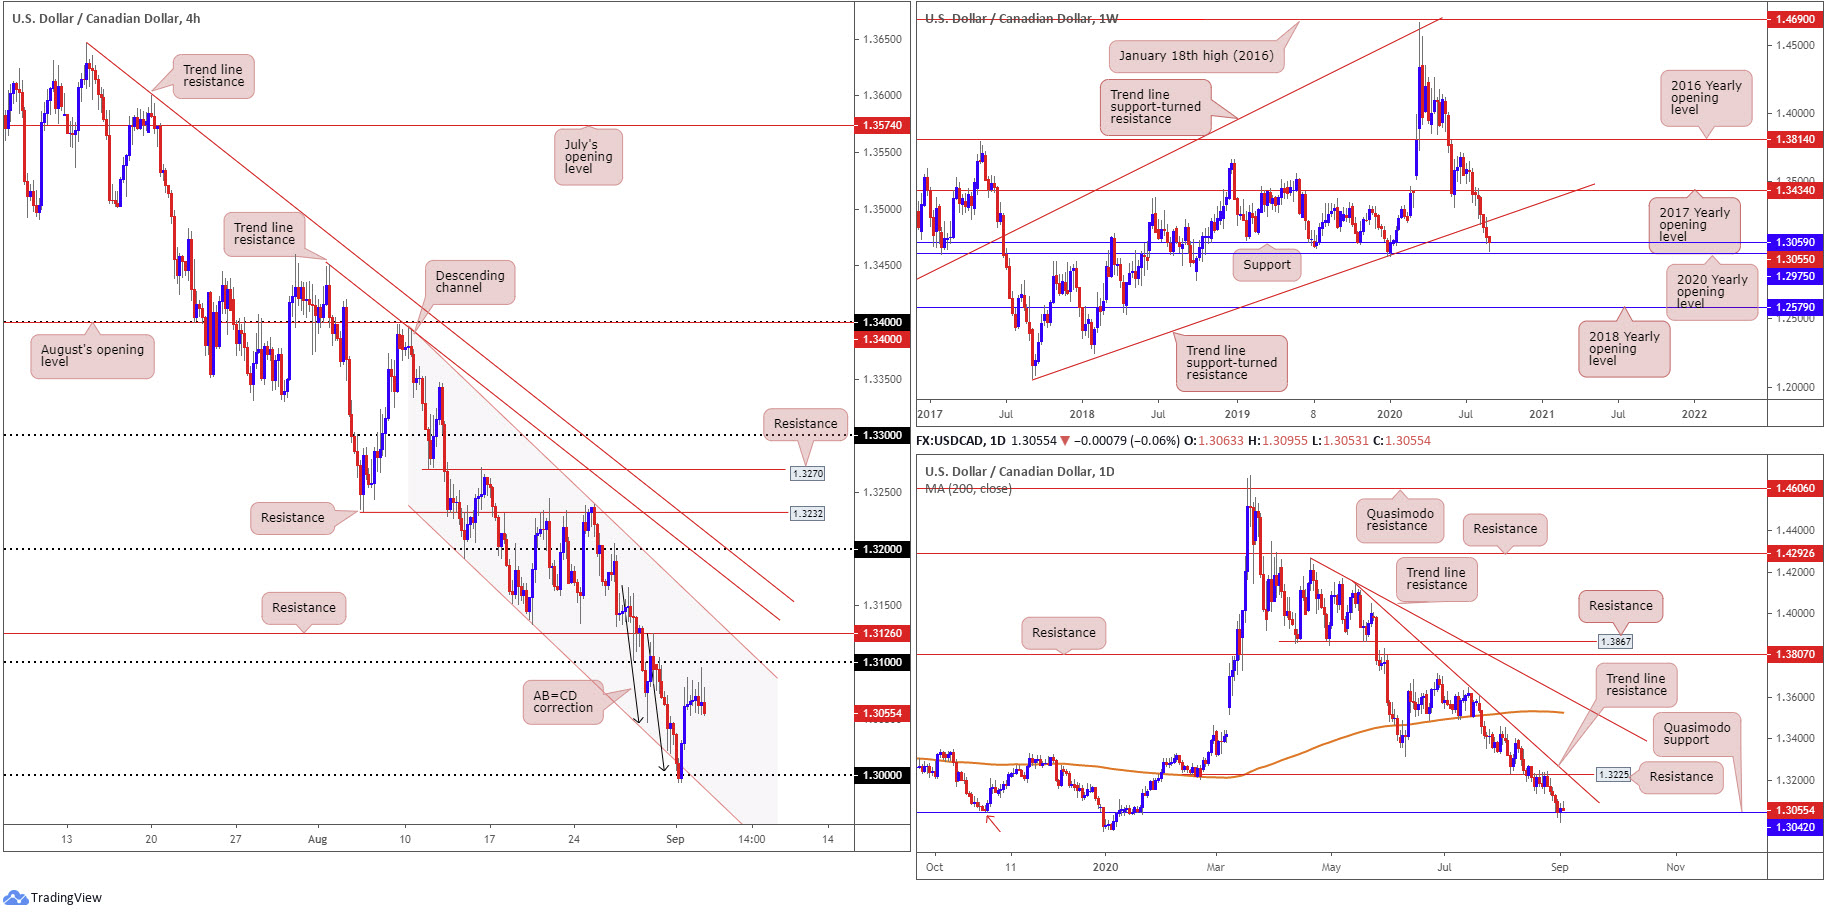
Tuesday’s outperformance, elevated on the back of a DXY rebound and WTI settling off best levels, along with technical support (see below), met with a passive tone on Wednesday, consolidating recent gains ahead of the 1.31 handle on the H4 timeframe, sited just under resistance at 1.3126, together with channel resistance, extended from the high 1.3394.
- Daily Quasimodo support (with its pattern low set at 1.2951) at 1.3042.
- H4 channel support, extended from the low 1.3133.
- H4 AB=CD correction (black arrows) at 1.3004.
- 30 key figure.
- Weekly support at 1.3059.
- Weekly support seen at 1.2975 (the 2020 yearly opening level).
Areas of consideration:
Those long 1.30 have likely reduced risk to breakeven, with some also possibly banking profits in view of yesterday’s lacklustre consolidation.
We could, however, according to the collection of higher timeframe supports, eventually extend gains and move beyond 1.31 to tackle additional H4 resistances, including resistance at 1.3126 and channel resistance from 1.3394.
A dip to the downside, however, could find itself back around the 1.30 vicinity.
USD/CHF:
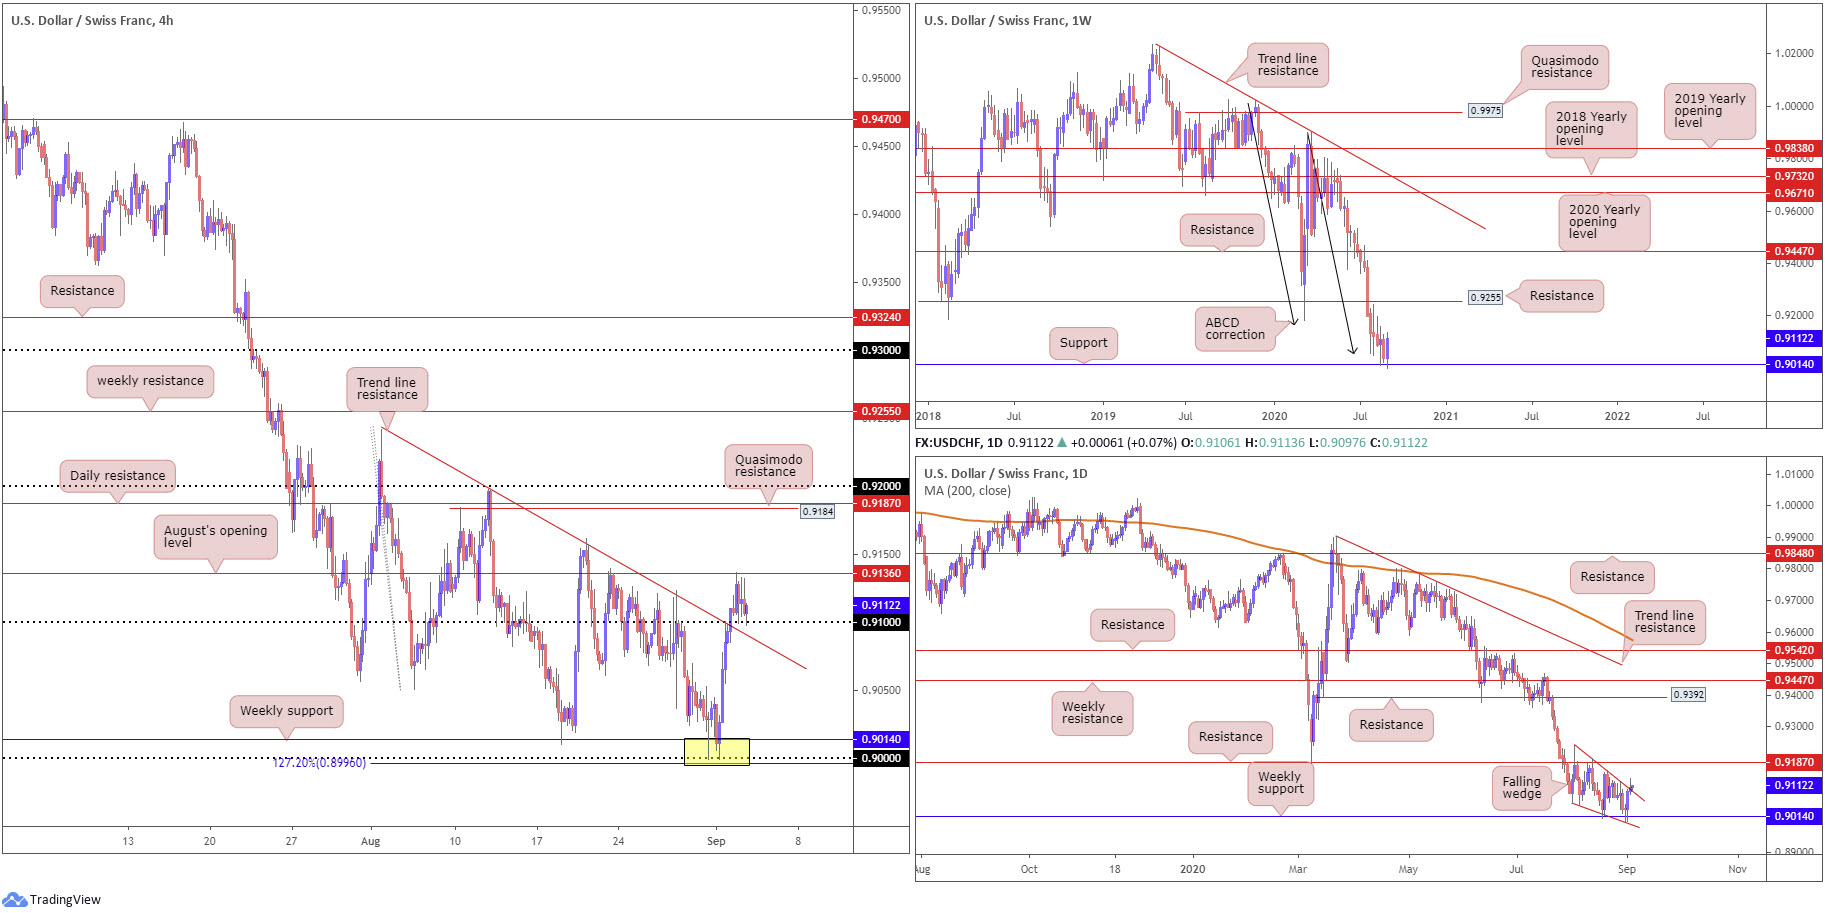
0.8996/0.9014 was an area of interest in recent trading, made up of a weekly support at 0.9014, a H4 127.2% Fibonacci extension point at 0.8996 and the 0.90 handle (yellow). As evident from the H4 chart, price rebounded from 0.8996/0.9014 and recently took over the 0.91 handle on the H4 to test August’s opening level at 0.9136.
What’s also still interesting is the weekly ABCD bullish formation at 0.9051 (black arrows) and the falling wedge pattern on the daily timeframe pencilled in from the high 0.9241 and a low of 0.9056 (essentially the trend line resistance shown on the H4 chart). The latter, as you can see, had its upper limit penetrated yesterday.
Areas of consideration:
Those long from 0.8996/0.9014 likely liquidated partial profits at around the 0.91 region, which by and of itself, should offer satisfactory risk/reward.
The breakout above the upper boundary of the daily falling wedge (a reversal signal), however, could have daily action extend recent gains to approach resistance plotted at 0.9187 (closely tied to a H4 Quasimodo resistance at 0.9184). As such, the recent 0.91 retest may see buyers try and overthrow August’s opening level at 0.9136 today. Aggressive traders may consider positions off the aforementioned round number; others might feel more comfortable waiting and seeing if we print a H4 close above 0.9136 before taking action.
Dow Jones Industrial Average:
Major US equity benchmarks followed European markets higher on Wednesday, rallying higher across the board. The Dow Jones Industrial Average rallied 454.84 points, or1.59%; the S&P 500 advanced 54.19 points, or 1.54% and the tech-heavy Nasdaq 100 traded higher by 127.68 points, or 1.04%.
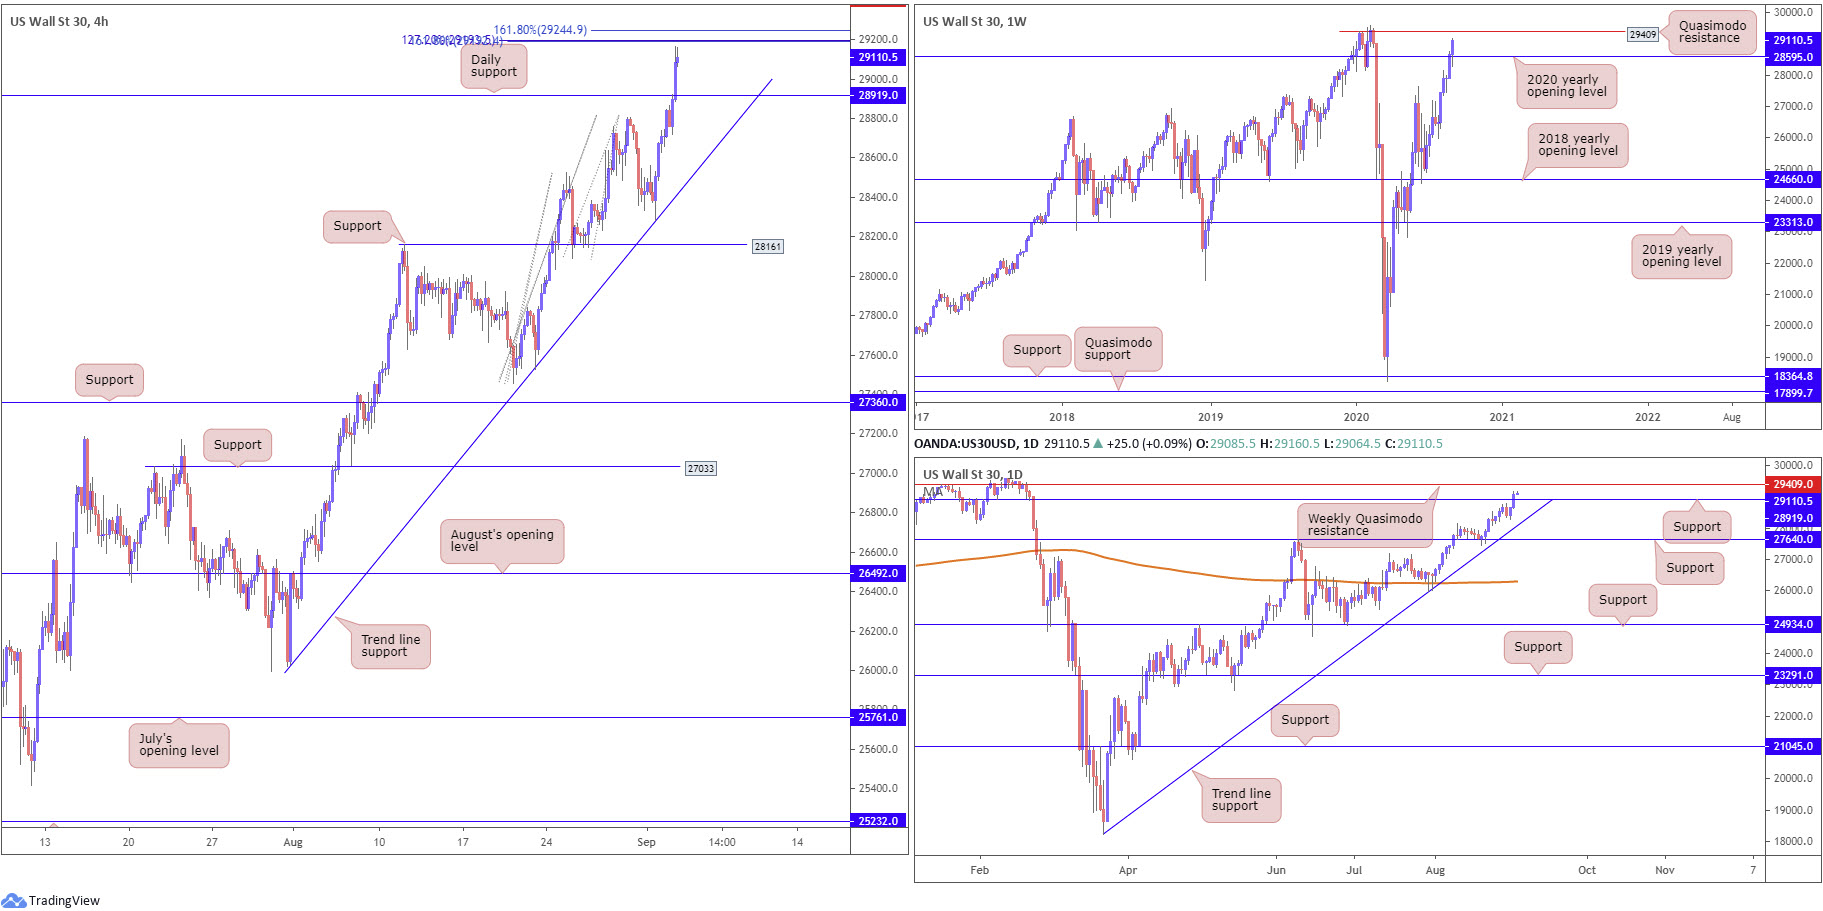
Following the technical rebound off H4 trend line support, taken from the low 26017, an extension to the upside emerged on Wednesday, running through daily resistance at 28919 and closing within touching distance of a H4 Fibonacci extension cluster around the 29200 point, consisting of 127.2% and 161.8% Fibonacci extension levels merging in the same location.
On the weekly timeframe, we recently crossed over the 2020 yearly opening value at 28595, with the current weekly candle poised to grapple with Quasimodo resistance at 29409.
Areas of consideration:
Should a pullback develop, buyers will be expecting daily support at 28919 to hold, although a whipsaw to demand situated around the 28820 region could be seen before buyers stand up.
A continuation higher today, on the other hand, will cross swords with the H4 Fibonacci extension cluster around 29200. A bearish reaction from here could be seen, yet the majority of traders are potentially eyeing weekly Quasimodo resistance at 29409 as the next upside target.
XAU/USD (GOLD):
With the US dollar index eking out fresh gains Wednesday, the price of gold fell nearly 1.5%.
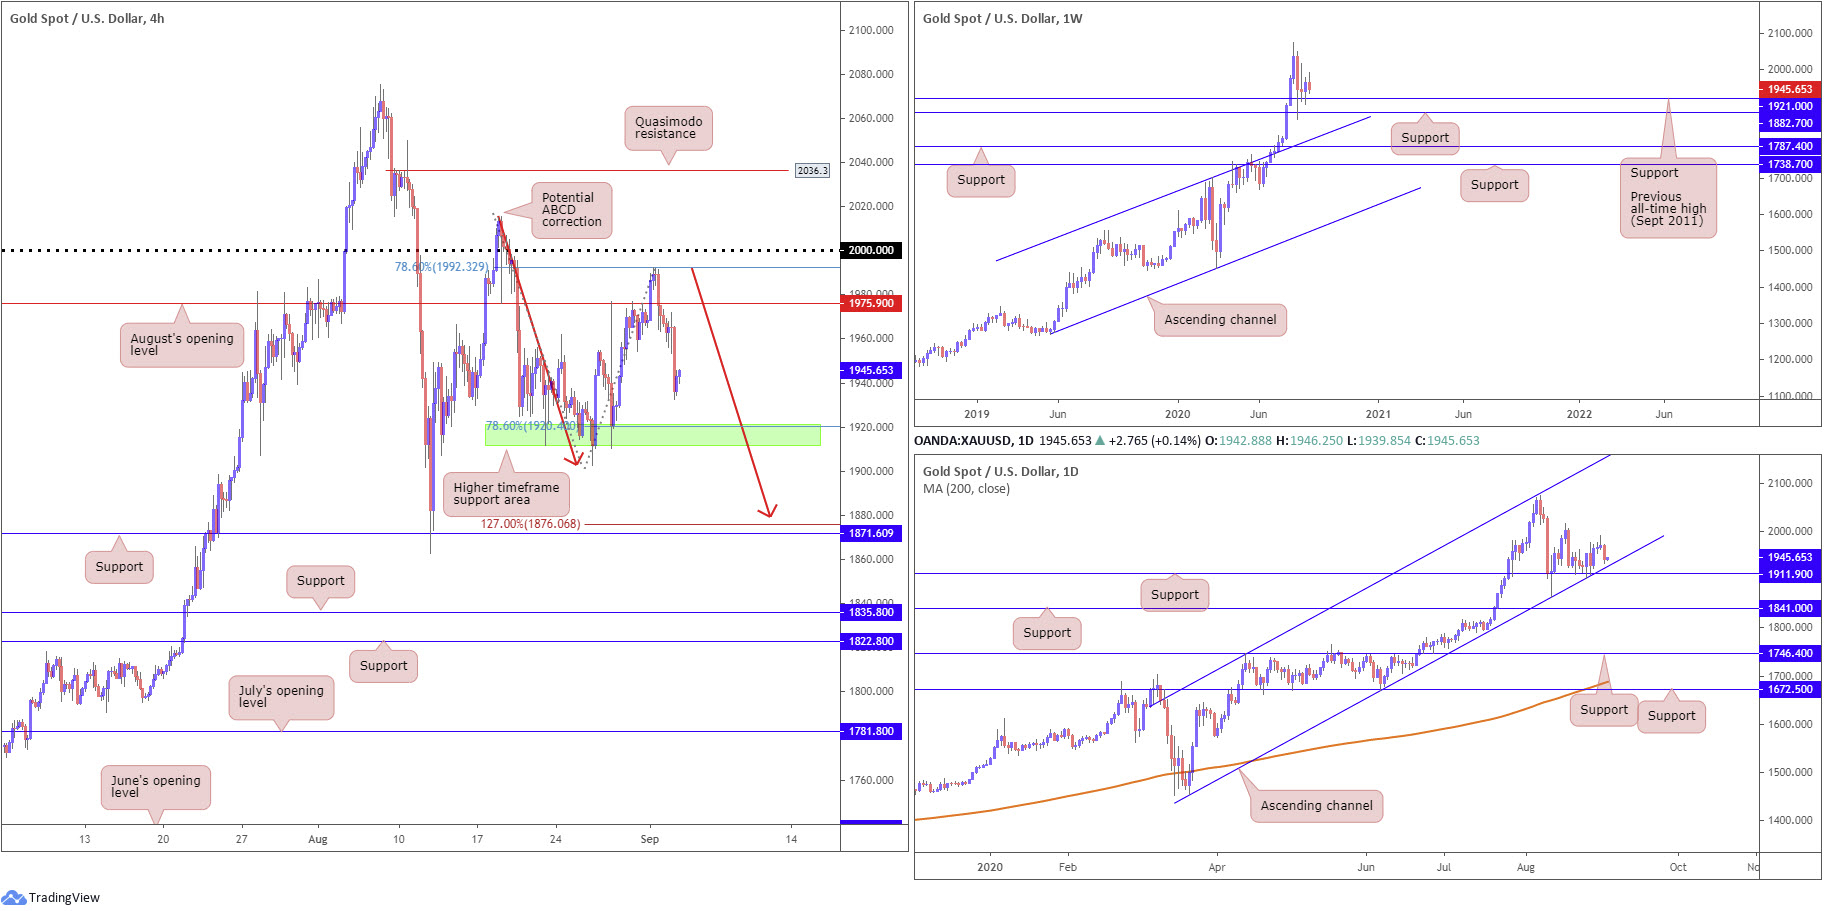
This has H4 action extending space south of August’s opening level at $1,975.90, on track to revisit higher timeframe supports at $1,911.90-$1,921.00 (green – daily and weekly [previous all-time peak from Sept 2011] supports). Yet, before reaching this area, daily channel support, extended from the low $1,455.32, could make an appearance and serve as a base for buyers to regain their footing.
Another price action alternative on the H4 timeframe, assuming we overrun higher timeframe supports, is a potential ABCD correction (red arrows) at $1,879.94, with a BC projection standing at 1.27% (given leg C terminated at 78.6%) ahead of H4 support coming in at $1,871.60.
Areas of consideration:
Overall, this remains a buyers’ market, according to the current trend, higher since bottoming in 2016.
Traders will be watching price action closely once, or indeed if, we shake hands with channel support on the daily timeframe today. A H4 bullish candlestick formation printed from this region, therefore, may draw in buyers.
The $1,911.90-$1,921.00 higher timeframe zone applied to the H4 timeframe (green) is also worth keeping a tab on. A retest of this zone, would be interesting and likely appeal to buyers, in light of its recent history.
The accuracy, completeness and timeliness of the information contained on this site cannot be guaranteed. IC Markets does not warranty, guarantee or make any representations, or assume any liability regarding financial results based on the use of the information in the site.
News, views, opinions, recommendations and other information obtained from sources outside of www.icmarkets.com.au, used in this site are believed to be reliable, but we cannot guarantee their accuracy or completeness. All such information is subject to change at any time without notice. IC Markets assumes no responsibility for the content of any linked site.
The fact that such links may exist does not indicate approval or endorsement of any material contained on any linked site. IC Markets is not liable for any harm caused by the transmission, through accessing the services or information on this site, of a computer virus, or other computer code or programming device that might be used to access, delete, damage, disable, disrupt or otherwise impede in any manner, the operation of the site or of any user’s software, hardware, data or property.


