
A note on lower timeframe confirming price action…
Waiting for lower timeframe confirmation is our main tool to confirm strength within higher timeframe zones, and has really been the key to our trading success. It takes a little time to understand the subtle nuances, however, as each trade is never the same, but once you master the rhythm so to speak, you will be saved from countless unnecessary losing trades. The following is a list of what we look for:
- A break/retest of supply or demand dependent on which way you’re trading.
- A trendline break/retest.
- Buying/selling tails/wicks – essentially we look for a cluster of very obvious spikes off of lower timeframe support and resistance levels within the higher timeframe zone.
- Candlestick patterns. We tend to stick with pin bars and engulfing bars as these have proven to be the most effective.
We search for lower timeframe confirmation between the M15 and H1 timeframes, since most of our higher-timeframe areas begin with the H4. Stops are usually placed 5-10 pips beyond confirming structures.
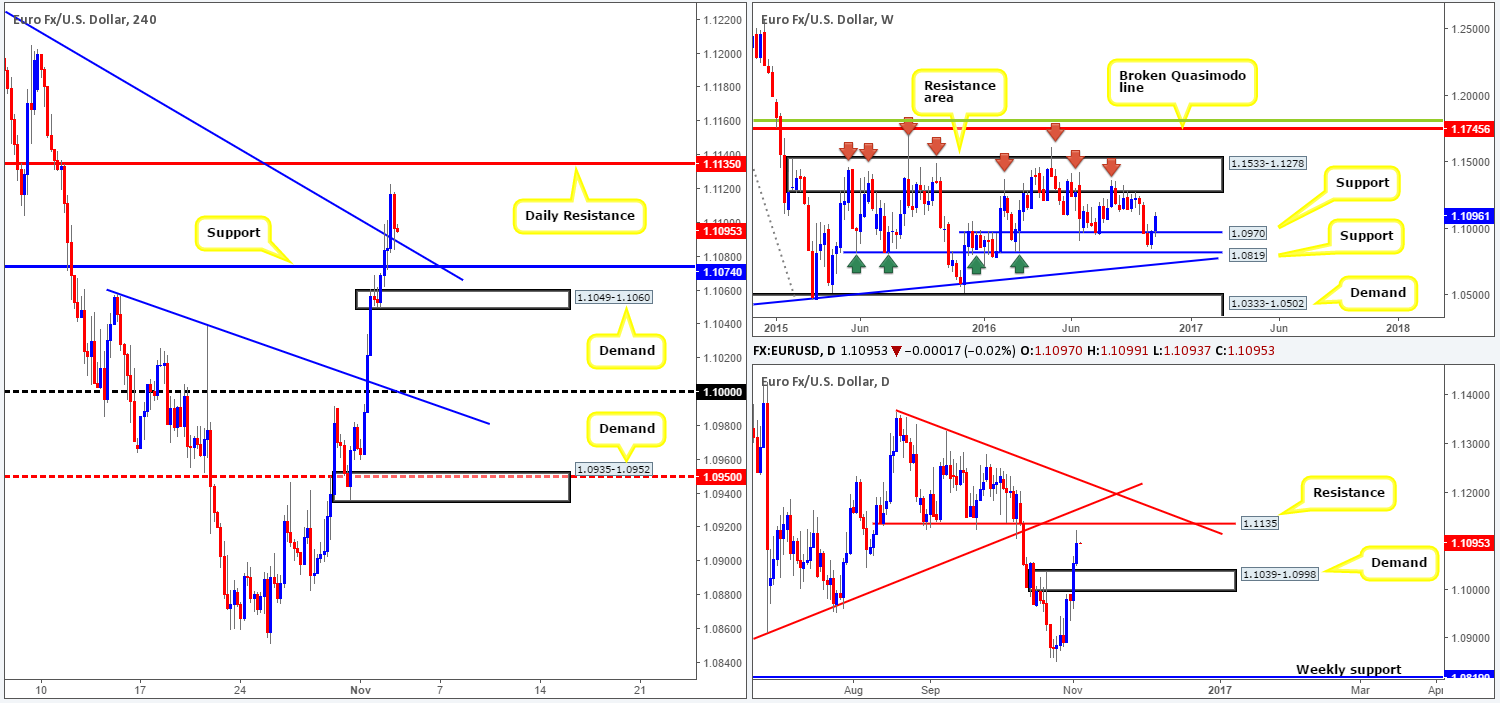
EUR/USD:
The EUR is trading with a reasonably strong bias to the upside this morning, as the US dollar recently clocked fresh lows of 97.18 (see the US dollar index). Yesterday’s US ADP employment change along with the decision and statement from the FOMC was largely ignored by the H4 candles, as price succeeded in breaking through both resistance at 1.1074 and the trendline resistance extended from the high 1.1279 (both now acting supports). This recent move has, as far as we can see, cleared the path north for price to challenge the nearby daily resistance coming in at 1.1135.
Our suggestions: As we highlighted in Wednesday’s report, a H4 close above the aforementioned H4 resistance and H4 trendline resistance would be considered a bullish signal up to the above said daily resistance. To trade this move, however, we’d advise waiting for a retest of the broken barriers as support followed by a reasonably sized H4 bull candle. The reason for requiring the H4 confirmation here is simply to avoid being stopped out on a possible whipsaw down to nearby H4 demand seen at 1.1049-1.1060.
Data points to consider: US jobless claims at 12.30pm and US ISM non-manufacturing PMI at 2pm GMT.
Levels to watch/live orders:
- Buys: Currently watching for price to retest the recently broken H4 resistance and H4 trendline resistance as support ([H4 bullish close required] stop loss: ideally beyond the trigger candle).
- Sells: Flat (stop loss: N/A).
GBP/USD:
As the US dollar continued to edge lower yesterday, we can see that this benefited sterling as price pierced through H4 supply at 1.2328-1.2285 mid-way through the London segment, reaching a high of 1.2352. A truckload of sellers have likely been taken out by this move since stop-loss orders are generally placed a few pips beyond supply zones. However, as we mentioned in our previous briefing, our desk would not feel comfortable buying this market until a H4 close is seen above this H4 area. A close higher would, in our opinion, also take out the top edge of the daily range (1.2292), thus potentially clearing the path north toward H4 resistance at 1.2467.
Our suggestions: While a close above the current H4 supply is considered a bullish cue, especially given that monthly price recently touched base with a large monthly demand seen here:
one cannot ignore the fact that the GBP is currently entrenched within a rather steep downtrend at the moment.
Should a close above the H4 supply area come to fruition, nonetheless, our team would like to see price retest the barrier as demand, followed up with either a H4 bull candle or a lower timeframe buy signal (see the top of this report). Only then would our team consider this a valid call to enter long.
Data points to consider: (The pound is likely to experience a lot of volatility today) UK services PMI at 9.30am, BoE rate decision, official bank rate votes, monetary policy summary, and BoE inflation report at 12pm as well as the BoE Gov. Carney taking the stage at 12.30pm alongside the US jobless claims reading. A couple of hours later the US ISM non-manufacturing PMI is also set to be released at 2pm GMT.
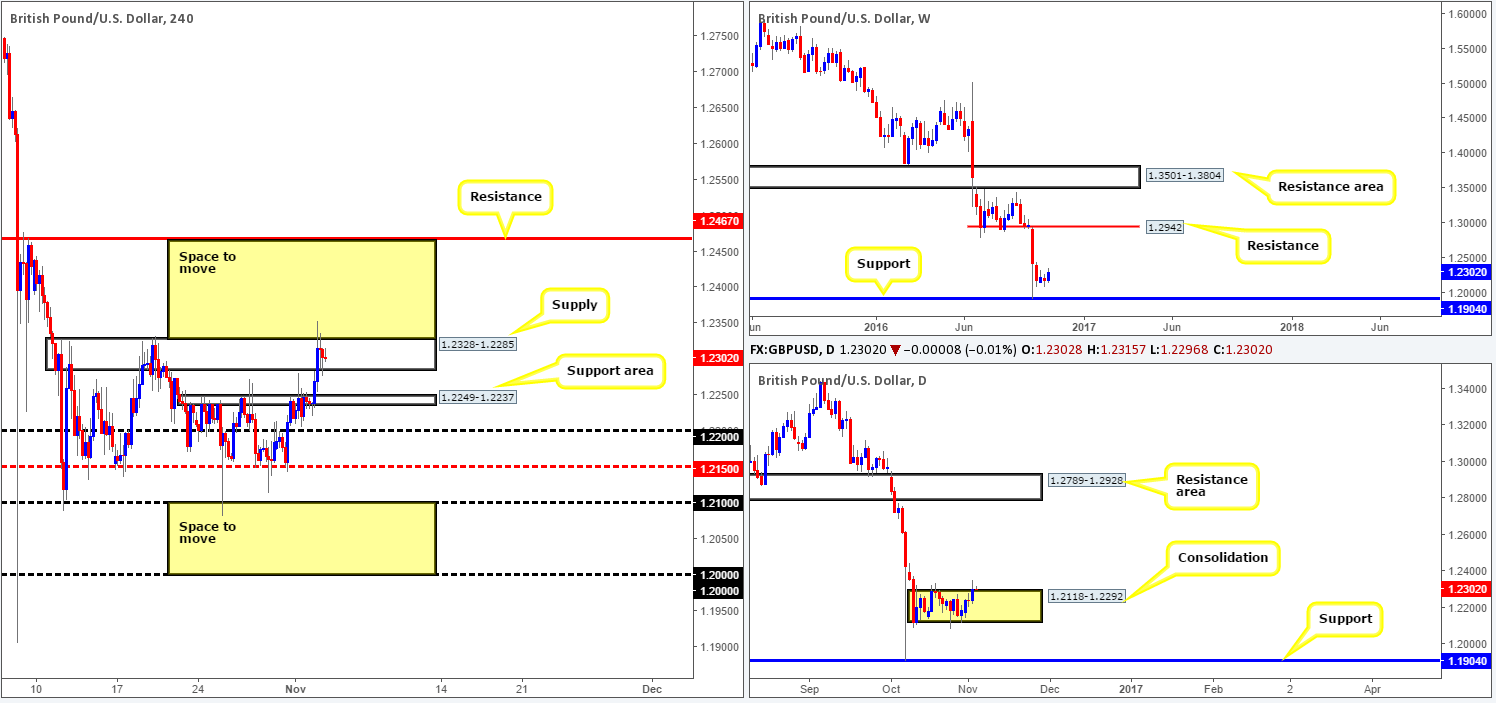
Levels to watch/live orders:
- Buys: Watch for a close above the H4 supply at 1.2328-1.2285 and then look to trade any retest seen thereafter (H4 bullish close required/lower timeframe confirming setup – stop loss: ideally beyond the trigger candle/dependent on where one confirms the area).
- Sells: Flat (stop loss: N/A).
AUD/USD:
Early on in yesterday’s session, the commodity currency carved out a bottom against its US counterpart around the 0.7617ish area. This was likely fueled by the gold market also taking a more northerly approach, coupled with the US dollar clocking fresh lows at 97.18 (see the US dollar index). It was not until the US traders entered the fight around the H4 trendline resistance drawn in from the high 0.7734, however, did we see upside momentum diminish. Withstanding three consecutive bullish attacks, it looks as though the trendline may force the H4 to close below the H4 mid-way support coming in at 0.7650, which could spark further selling down to H4 demand at 0.7581-0.7597.
Our suggestions: With the Aussie trade balance report due out in 20 or so minutes, we would refrain from trading right now. This is primarily the reason why we’re not looking to short beyond 0.7650.
However, should the pair slip below bids at 0.7650 today and touch gloves with the H4 demand at 0.7581-0.7597, our team will then be watching for a continuation move below this H4 demand. Should this come into view, wait for a retest to the underside of this zone followed up by a H4 bearish close. Once this has been satisfied, a short from here is, at least in our book, valid down to the combined H4 support/Quasimodo at 0.7533 that sits directly above the a daily support area seen at 0.7517-0.7451 (the next downside target on the daily timeframe).
Data points to consider: AUD trade balance at 12.30am, US jobless claims at 12.30pm and US ISM non-manufacturing PMI at 2pm GMT.
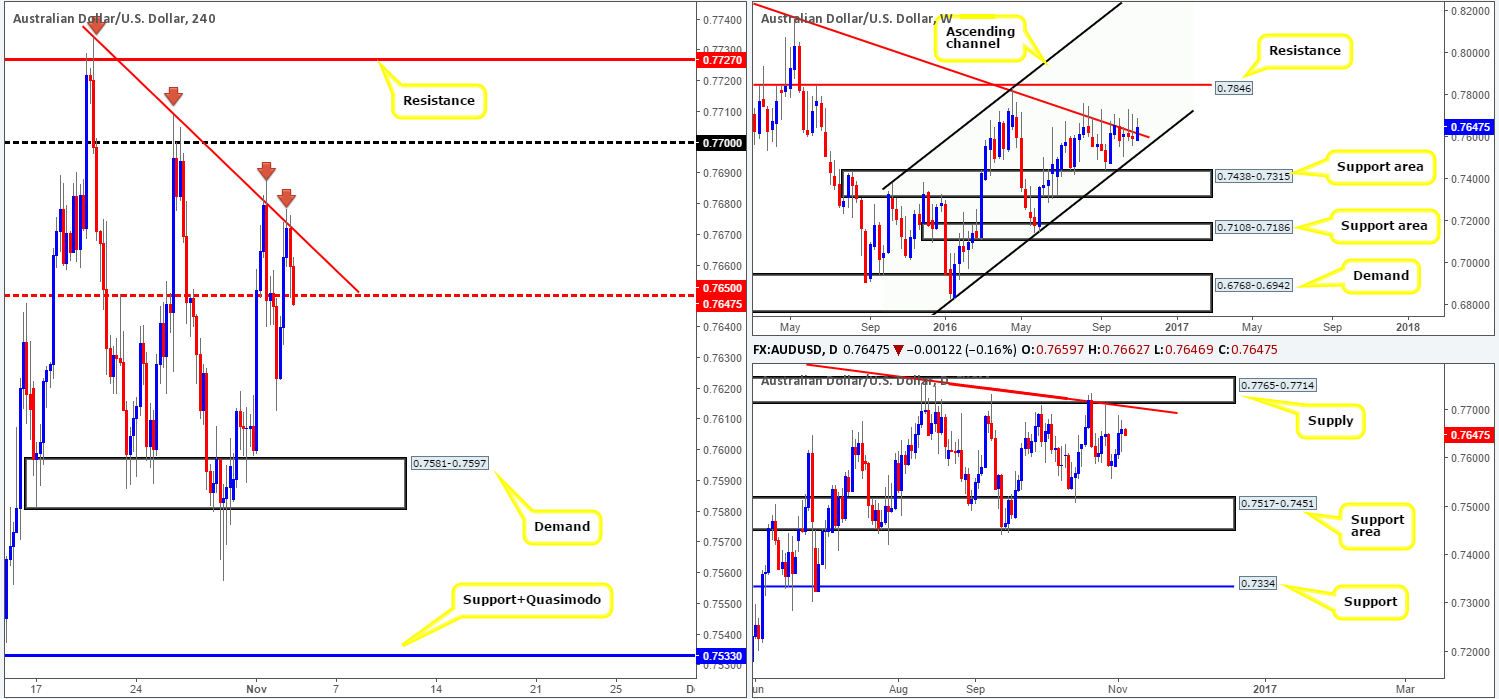
Levels to watch/live orders:
- Buys: Flat (stop loss: N/A).
- Sells: Watch for a close below the H4 demand at 0.7581-0.7597 and then look to trade any retest seen thereafter (H4 bearish close required – stop loss: ideally beyond the trigger candle).
USD/JPY:
The value of the USD/JPY weakened in aggressive fashion on Wednesday, consequently taking out multiple H4 supports in the process. It was only as US traders entered the fray ahead of the 103 handle/H4 demand at 102.80-102.97 did we see price action begin to stabilize.
In addition to this, the daily support area at 103.50-103.89 (now acting resistance) was also engulfed, leaving the pair free to challenge the daily support level penciled in at 102.63. From the weekly chart, technicians should not really be surprised by this recent descent, even though it has been exacerbated by uncertainty surrounding the upcoming US elections. The weekly candle touched base with a resistance area at 105.19-107.54 a week ago and has since then sold off.
Our suggestions: In spite of the bulls seen making a comeback ahead of 103, our team is not really keen on buying this market at this time for reasons stated above in bold. To become sellers in this market, nevertheless, we see two options:
- Look for a lower timeframe entry short (see the top of this report) from either the H4 mid-way resistance 103.50 or the nearby H4 trendline resistance above it (102.65). Taking partial profits is advisable around the 103 band as well as reducing risk to breakeven.
- Wait for a close to be seen beyond the current H4 demand. This would, as far as we can see, likely indicate that daily support at 102.63 is the next line on the hit list to be taken out. A close below the daily level would potentially open up the path south down to the weekly support at 100.61 (the next downside target on the weekly timeframe), which sits just above daily demand at 99.53-100.23. Therefore, a close below the H4 demand followed up with a retest and a reasonably sized H4 bear candle would, in our book, be considered sufficient enough to condone a short entry in this market, with an ultimate target set at 100.61: the weekly support.
Personally we favor option two.
Data points to consider: US jobless claims at 12.30pm and US ISM non-manufacturing PMI at 2pm GMT.
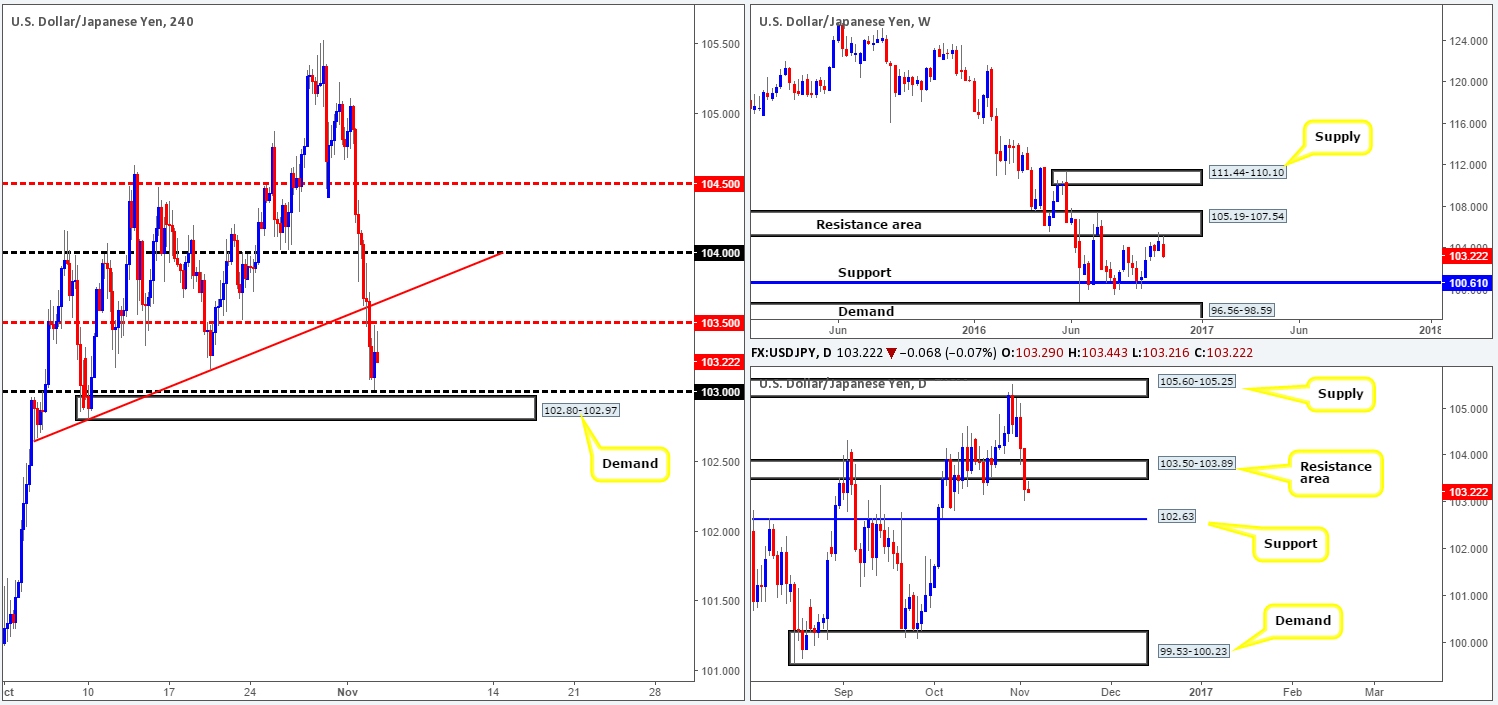
Levels to watch/live orders:
- Buys: Flat (stop loss: N/A).
- Sells: Watch for a close below the H4 demand at 102.80-102.97 and then look to trade any retest seen thereafter (H4 bearish close required – stop loss: ideally beyond the trigger candle).
USD/CAD:
Since the beginning of the week, the H4 candles have been chiseling out a consolidation between 1.3423/1.3360. And, if you ask us, this is not likely to change today given we have absolutely no CAD data on the docket. We do, however, have US jobless claims at 12.30pm and the US ISM non-manufacturing PMI report at 2pm GMT to look forward to, so there’s always a possibility.
With the above points in mind, how do things stand on the higher timeframes? Although weekly resistance suffered a slight breach last week, upside momentum has been slow. Daily resistance at 1.3414 (boasts an AB=CD completion point around the 1.3384ish range and a channel resistance taken from the high 1.3241) on the other hand, continues to hold ground for now.
Our suggestions: Ideally, a close beyond the current H4 consolidation would be fantastic, as not only would this likely confirm downside strength from the above said higher-timeframe structures, it would also set the stage for a possible downside move on the H4 towards the 1.33 handle, and beyond.

Levels to watch/live orders:
- Buys: Flat (stop loss: N/A).
- Sells: Watch for a close below the H4 lows 1.3360 and then look to trade any retest seen thereafter (H4 bearish close required – stop loss: ideally beyond the trigger candle).
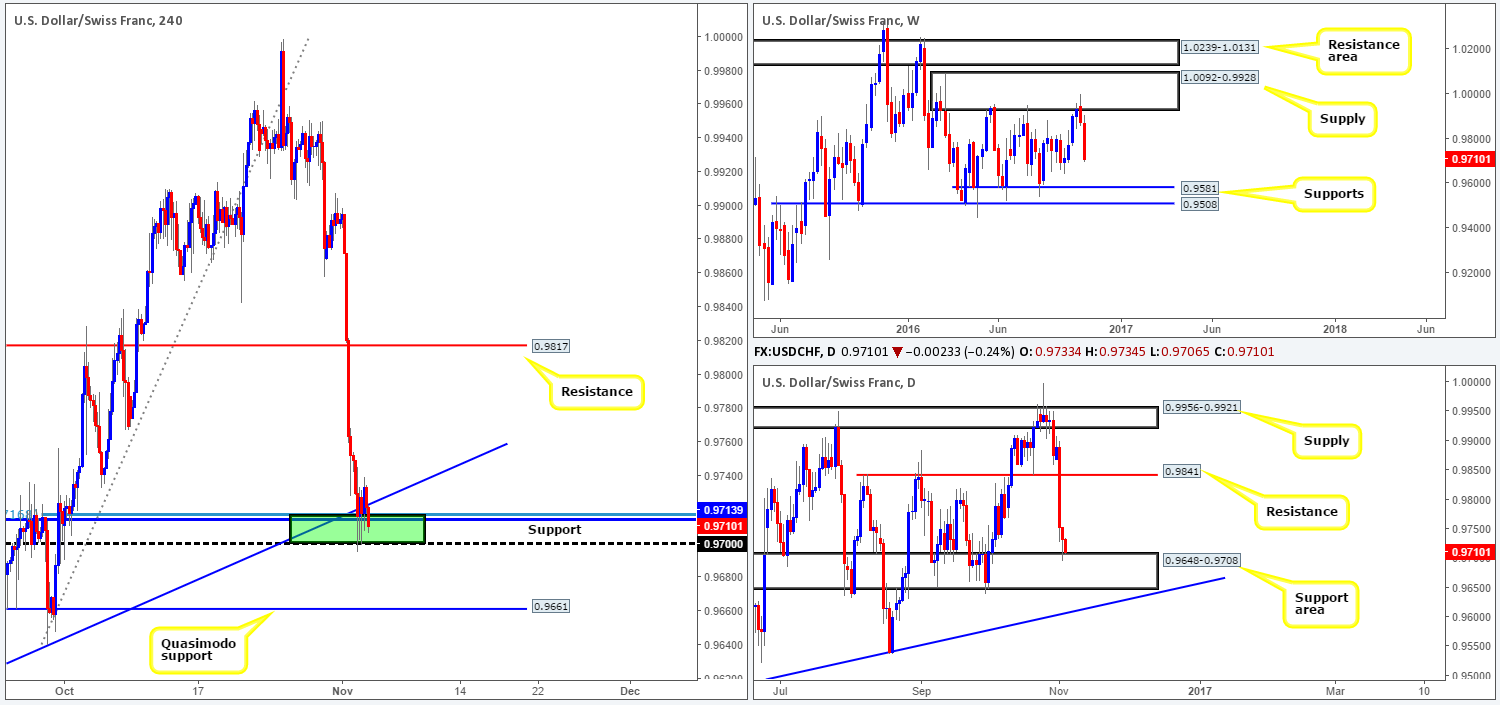
USD/CHF:
Throughout the course of yesterday’s sessions, the H4 candles, as expected, found support around the 0.97/0.9716 area (green area). While this zone carries weight as far as H4 confluence goes (H4 support level at 0.9713, a H4 78.6% Fib at 0.9716, a H4 trendline support taken from the low 0.9537 and the 0.97 handle), as well as being housed within the top edge of the daily support area seen at 0.9648-0.9708, dollar shorts still seem to have the upper hand here.
With the weekly chart looking as though it wants to connect with the other side of its range: a support seen at 0.9581, the 0.97 handle will likely be consumed today, and the path cleared for a drop down to 0.9661: a H4 Quasimodo support level which sits within the aforementioned daily support area.
Our suggestions: This is a tricky market to read at the moment. Assuming one looks to short beyond 0.97 today, you run the risk of selling into potential daily buyers from the current demand. On the other side of the coin, those wishing to buy from the H4 Quasimodo support mentioned above at 0.9661 place themselves in front of weekly sellers! In light of these points, our desk has concluded that remaining on the sidelines here might be the best path to take today.
Data points to consider: US jobless claims at 12.30pm and US ISM non-manufacturing PMI at 2pm GMT.
Levels to watch/live orders:
- Buys: Flat (stop loss: N/A).
- Sells: Flat (stop loss: N/A).
DOW 30:
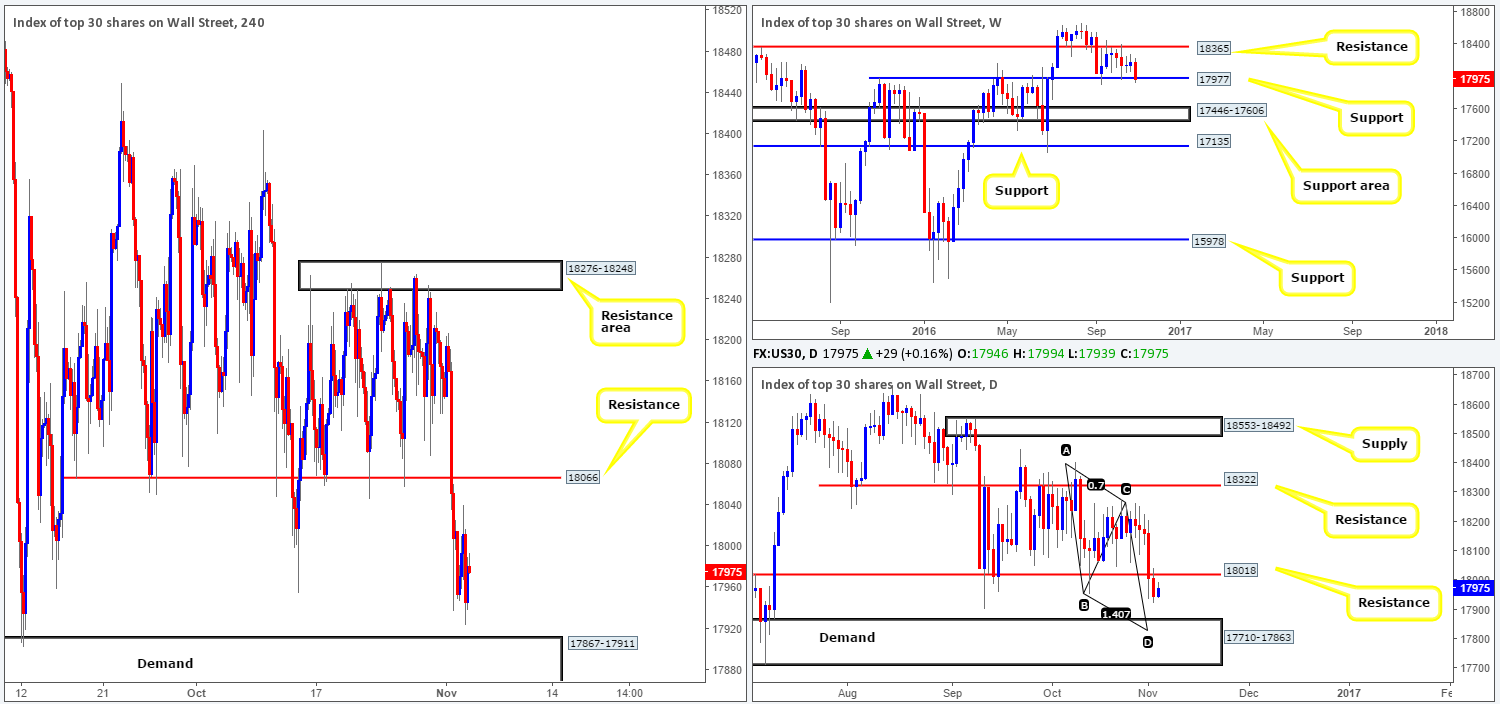
The equity market recorded its fifth consecutive daily loss yesterday, touching lows of 17924. The decision and statement from the FOMC was largely ignored, as investors focus on November 8: the US elections.
Looking at the weekly chart, we can see that the weekly candle continues to test the support level drawn from 17977. This barrier stretches as far back as late 2015, so it’s not a hurdle one can ignore! Down on the daily chart, however, the candles look set to retest the underside of the recently broken support at 18018 as resistance, which will likely force prices south to test demand coming in at 17710-17863. Further supporting this move, there’s a daily AB=CD bull pattern (taken from the high 18404) seen close to completing its D-leg at 17827 (within the current daily demand).
Our suggestions: Given the uncertainty surrounding the upcoming elections, and the fact that this is a rather difficult market to read at the moment, the only area our team would feel comfortable trading from is a H4 demand seen at 17710-17793 (seen below the current H4 demand at 17867-17911), which sits within the extremes of the current daily demand and also just below the completion point of the daily AB=CD pattern. Of course, a rebound from the current H4 demand could also take place, but we do not like the fact that price may fake below this area to the daily demand, hence why we prefer not to trade from here now.
Levels to watch/live orders:
- Buys: 17710-17793 ([H4 bullish close required] stop loss: ideally beyond the trigger candle).
- Sells: Flat (stop loss: N/A).
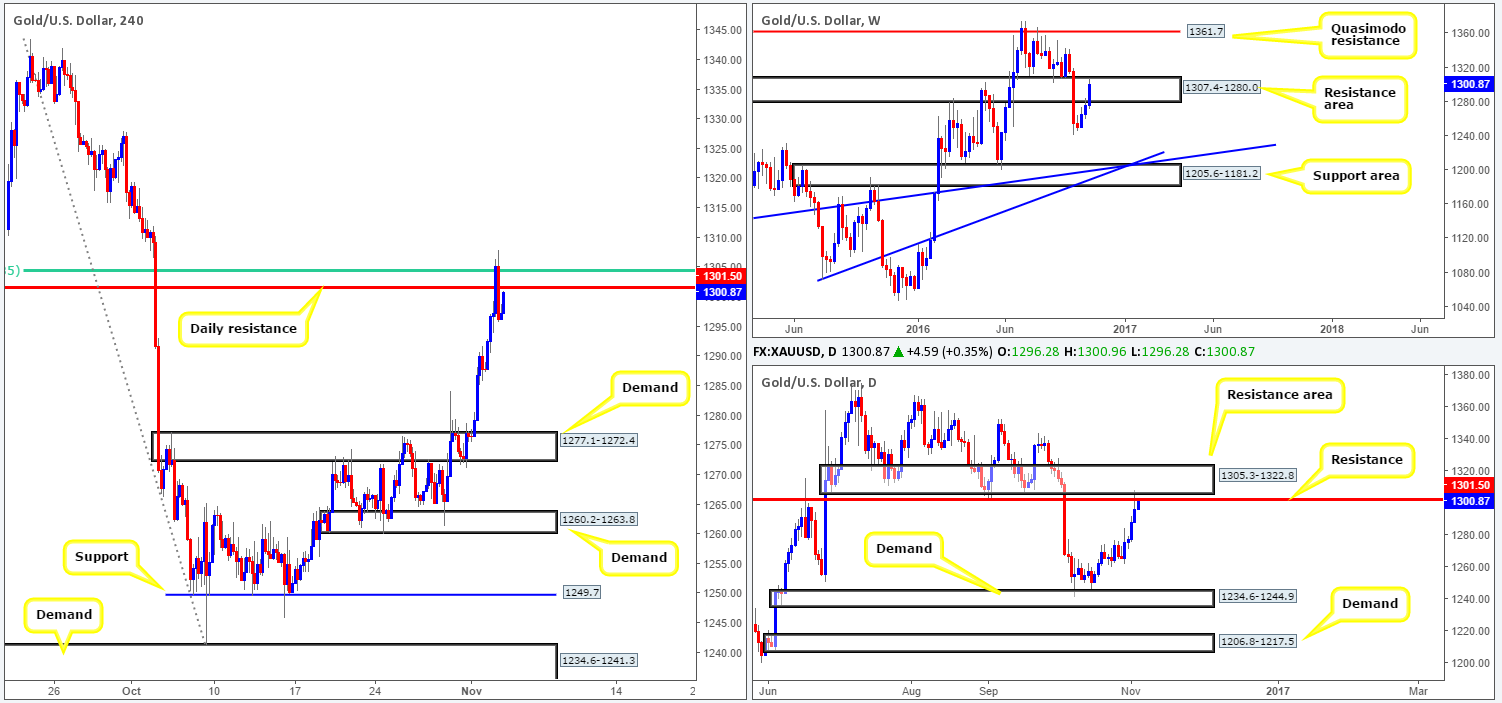
GOLD:
Gold printed its fourth consecutive daily bull candle yesterday on the back of an overall weaker dollar. This has, as you can see from the weekly chart, pushed bullion deep into the resistance area coming in at 1307.4-1280.0. What it also did, nonetheless, is attack the underside of both the daily resistance level at 1301.5 and the nearby daily resistance area drawn from 1305.3-1322.8.
In our previous report, we highlighted the H4 61.8% Fib resistance at 1304.5 (green line) and the above said daily resistance level as an area which would likely bounce price. Ok, it did extend slightly above this zone, but overall did hold prices lower. Against fundamentals, which could be risky given the weakness of the US dollar right now, we took a short at 1296.7 and placed a stop above the high of the H4 bearish engulfing candle at 1308.3. Ultimately, we’re looking to ride this market back down to the H4 demand at 1277.1-1272.4. It’ll be interesting to see how this pans out.
Levels to watch/live orders:
- Buys: Flat (stop loss: N/A).
- Sells: 1296.7 ([live] stop loss: 1308.3).


