
A note on lower timeframe confirming price action…
Waiting for lower timeframe confirmation is our main tool to confirm strength within higher timeframe zones, andhas really been the key to our trading success. It takes a little time to understand the subtle nuances, however, as each trade is never the same, but once you master the rhythm so to speak, you will be saved from countless unnecessary losing trades. The following is a list of what we look for:
- A break/retest of supply or demand dependent on which way you’re trading.
- A trendline break/retest.
- Buying/selling tails – essentially we look for a cluster of very obvious spikes off of lower timeframe support and resistance levels within the higher timeframe zone.
- Candlestick patterns. We tend to only stick with pin bars and engulfing bars as these have proven to be the most effective.
For us, lower timeframe confirmation starts on the M15 and finishes up on the H1, since most of our higher timeframe areas begin with the H4.
EUR/USD:
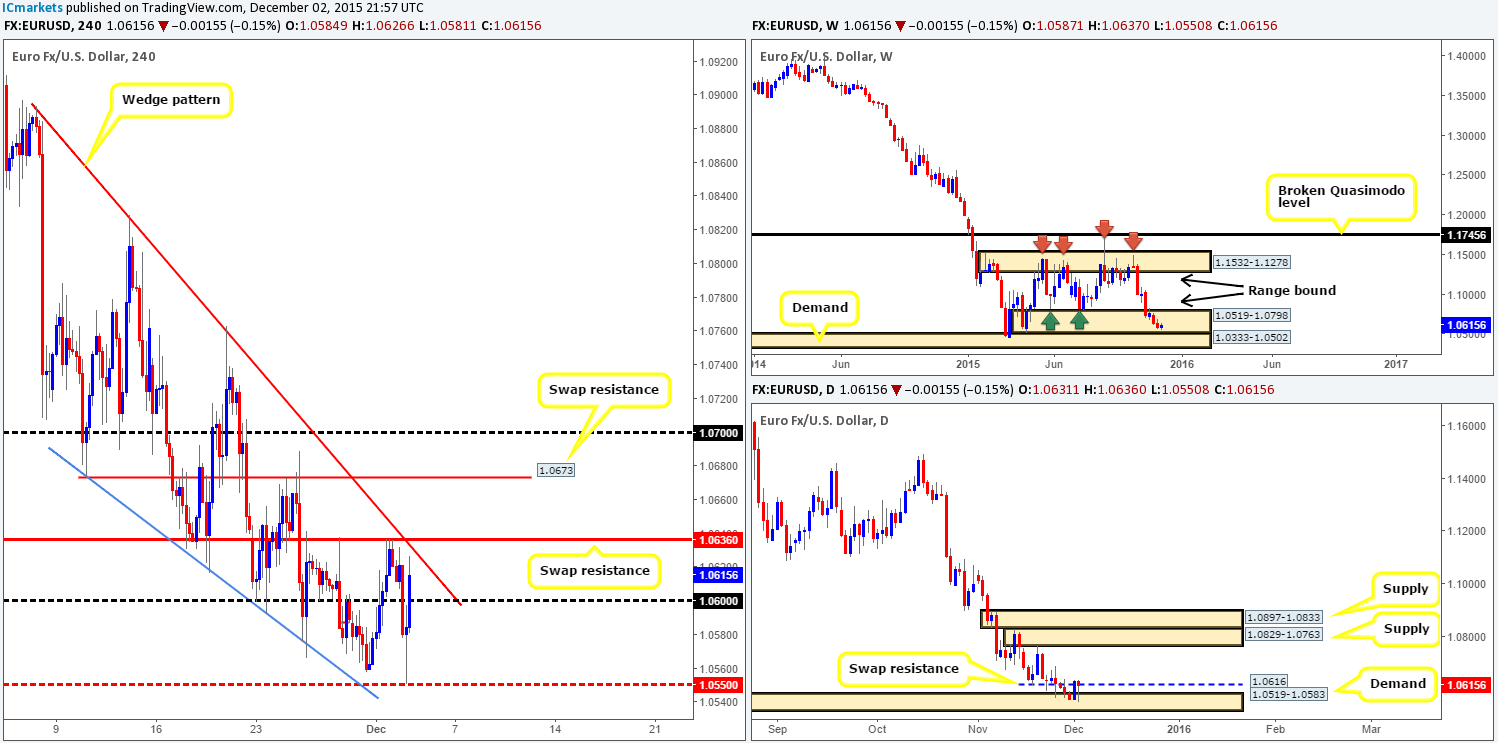
Throughout the course of yesterday’s sessions, we saw the EUR violently sell-off at the beginning of London trade. This, as can be seen on the H4 chart, cleanly took out bids from psychological support 1.0600 which then followed with a drive into mid-level support 1.0550. It was at this point, mid-way through the American session, did we see price change tracks and just as violently rally north.
Owing to price now trading back below swap resistance at 1.0636 and its converging trendline extended from the high 1.0893 (upper limit of current wedge pattern), traders are likely preparing to short this beauty once again. In our opinion, this pair may slightly halt at this region during Asia trading, but will likely break higher as we enter into the more volatile European session. Reasons for why is we see that price remains lurking deep within a range demand zone seen at 1.0519-1.0798, and movement on the daily timeframe recently stabbed into demand at 1.0519-1.0583 and looks to have held above swap resistance at 1.0616.
Therefore, we cannot justify a short around 1.0636 today. Instead, what we will be looking for is a close above here and a confirmed retest of this barrier to trade long (in-line with higher timeframe structures – see above) up to at least the swap resistance 1.0673, followed closely by psychological resistance 1.0700.
Levels to watch/live orders:
- Buys:Watch for offers to be consumed around 1.0636 and then look to trade any retest seen at this level (confirmation required).
- Sells: Flat (Stop loss: N/A).
GBP/USD:
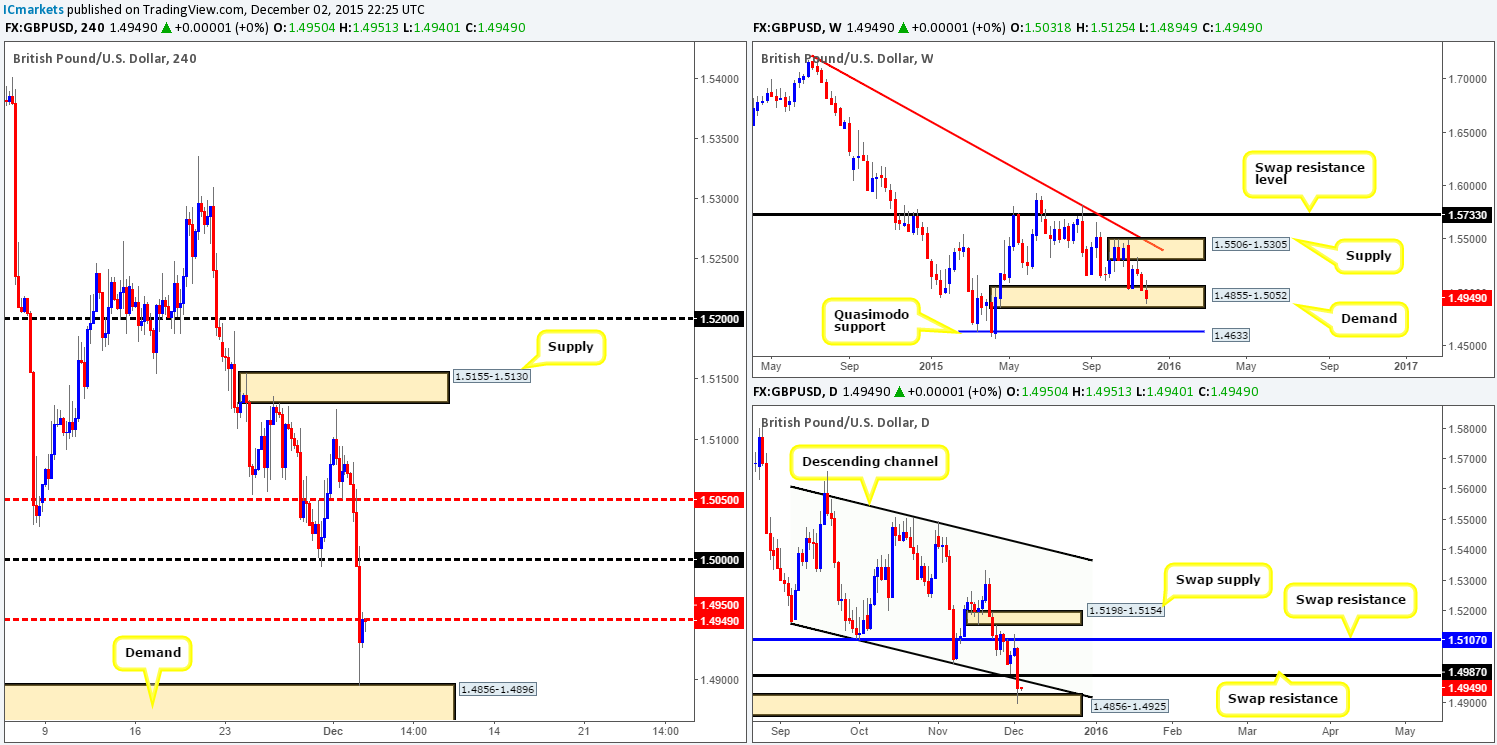
Pound sterling took a turn for worst yesterday with UK construction data coming inat 55.3 down from 58.8. Consequent to this, close to 200 pips was erased and several technical barriers were taken out along the way, with price ending the day stabbing into H4 demand at1.4856-1.4896, and bouncing up to mid-level resistance 1.4950.
Given the rebound from this demand, what’s the vibe like on the higher timeframe picture? Up on the weekly, we can see that price continues to trade within demand at 1.4855-1.5052. Meanwhile, down on the daily chart, the recent decline saw the swap support (now resistance) at 1.4987, along with channel support (1.5162) wiped out, which in turn opened the path to test bids at daily demand drawn from 1.4856-1.4925.
So, to sum up, we have price trading from demand on all three timeframes right now. However, entering long right now is tricky. On the H4, 1.4950 is currently holding this market lower. Up on the daily, price has both the recently broken swap support and channel support to contend with as potentially troublesome resistance. Therefore, we have two options as far as we see:
- Remain flat during today’s trade.
- Wait and see if price closes above 1.4950 on the H4, and look to trade the retest (confirmation required) up to around the large psychological resistance 1.5000. However, be warned that price may turn before this number due to the above said daily resistance levels being just that little bit lower.
Levels to watch/ live orders:
- Buys: Watch for offers to be consumed around 1.4950 and then look to trade any retest seen at this level (confirmation required).
- Sells: Flat (Stop loss: N/A).
AUD/USD:
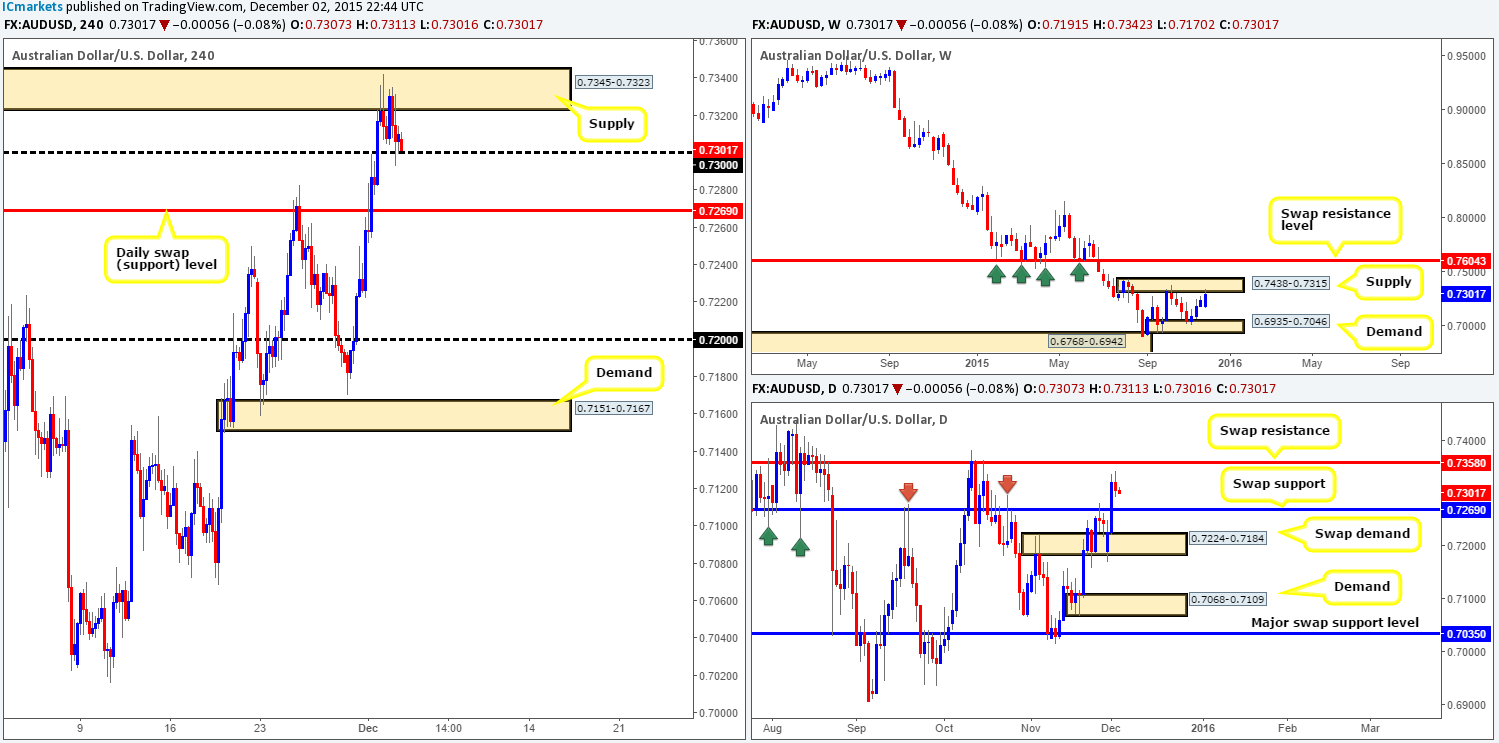
Coming at you directly from the top this morning, candle action on the weekly chart shows price currently chewing on offers around supply drawn from 0.7438-0.7315. This is this supply area’s second visit so there is the possibility price may trade higher into this zone before any noteworthy sell-off is seen. Looking down to daily structure, however, we can see price loitering between a swap resistance barrier at 0.7358 and a swap support seen at 0.7269.
Moving down one more level to the H4, supply at 0.7345-0.7323 (pinned to the underside of the aforementioned weekly supply area) held prices lower during the course of yesterday’s sessions, consequently forcing the Aussie to test bids at psychological support 0.7300.
Although, this pair has been held lower by H4 supply, we’re lacking confidence in this zone. Our reasoning lies within the higher timeframe structure mentioned above. With room for daily action to appreciate to 0.7358, there is a strong chance that this H4 supply will be faked as the daily level sits just above it at 0.7358!
Taking the above points into consideration, here is what we have jotted down so far…
- Should price fake above the current H4 supply today and cross swords with the daily swap (resistance) level at 0.7358, begin looking for a confirmed short into this market.
- On the other hand, if price continues to trade lower from current prices and takes out the 0.7300 figure, market action will then likely drop thirty or so pips to connect with the daily swap (support) at 0.7269. This could be good for a small intraday short, but the stop would need to be very small in order to achieve reasonable risk/reward. By the same token, entering long from 0.7269 is not something we’d label high probability due to where price is positioned on the weekly timeframe (see above). The only alternative we see here would be a clean close below this daily level, which in turn would likely open the gates for a possible short down to at least the top-side of the daily swap (demand) at 0.7224.
Levels to watch/ live orders:
- Buys: Flat (Stop loss: N/A).
- Sells: Watch for price to fake above H4 supply at 0.7345-0.7323 up to the 0.7358 daily resistance level before looking to short this pair (waiting for confirmation here is still advised). Watch for bids to be consumed around 0.7269 and then look to trade any retest seen at this level (confirmation required).
USD/JPY:
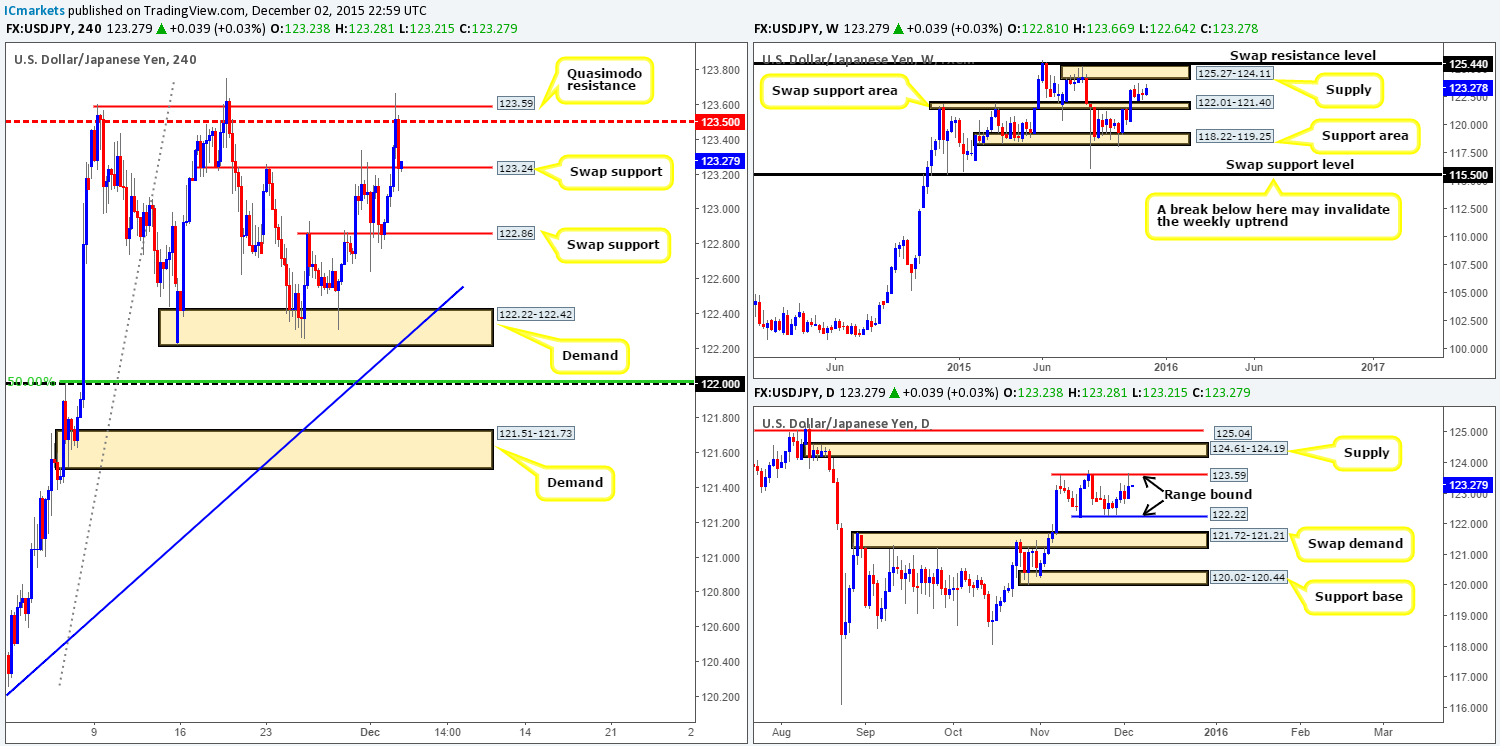
For those who read our previous report (http://www.icmarkets.com/blog/wednesday-2nd-december-daily-technical-outlook-and-review/), you may recall us mentioning that we were very interested in shorting from the H4 Quasimodo resistance level at 123.59. As you can see, price rebounded from this level beautifully around the London close yesterday, forcing prices down to a swap support level at 123.24. Unfortunately, we were not around to catch this move. Well done to any of our readers who managed to lock in some green pips here!
Considering that 123.59 also marks the upper band of the current daily range, we anticipate further downside today if a close below the current swap support level at 123.24 is seen. In the event that this comes to fruition, we’ll be looking to join in this potential move lower on any (confirmed) retest to the underside of this level down to at least 122.86, followed by demand seen at 122.22-122.42 (essentially forms the lower band of the current daily range).
If bids remain strong at 123.24 on the other hand, we may get a second chance to enter short at the above said H4 Quasimodo resistance level. However, this time, we will require lower timeframe confirmation before a short position is permitted.
Levels to watch/ live orders:
- Buys: Flat (Stop loss: N/A).
- Sells: 123.59 [Tentative – confirmation required] (Stop loss: dependent on where one confirms this level). Watch for bids to be consumed around 123.24 and then look to trade any retest seen at this level (confirmation required).
USD/CAD:
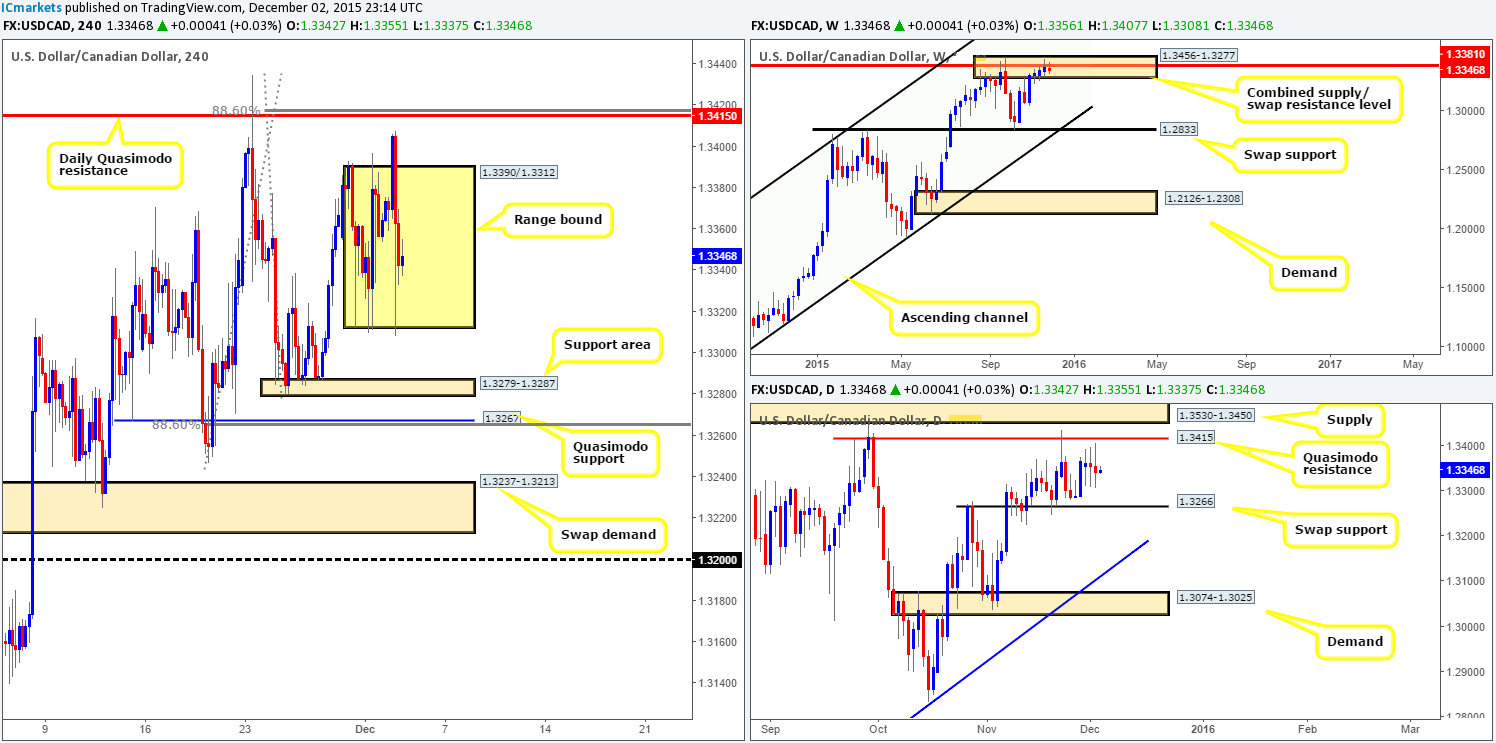
Despite another day’s volatility, the USD/CAD still remains confined between 1.3390/1.3312. As a consequence, our outlook for this pair will be similar to our previous report…
Alongside the current H4 range, price continues to loiter within the weekly combined supply/ swap resistance area at 1.3456-1.3277/1.3381, and daily action printed its third consecutive indecision candle whilst also loitering between Quasimodo resistance at 1.3415 and a swap support barrier at 1.3266.
As we mentioned yesterday, although the current H4 range is large enough to profit trading the extremes, we’ll humbly pass and look beyond to the more confluent zones to trade. Here’s why:
Above the H4 range lurks a daily Quasimodo resistance level mentioned above at 1.3415. Not only has this barrier proven itself already by holding this market lower on the 23/11/15, it also coincides nicely with both the aforementioned combined weekly supply/ swap resistance area and the 88.6% Fibonacci level at 1.3416 (waiting for lower timeframe confirmation is recommended before selling here to avoid a fakeout). Therefore, this will be our base for sells today.
Beneath the H4 range, nonetheless, there is a clear H4 support area at 1.3279-1.3287, which despite how well it has held price recently, this support area is also not somewhere we’d consider safe to buy from due to the Quasimodo support below it at 1.3267. Reason being is this Quasimodo level converges with the 88.6% Fibonacci level at 1.3265 and also the daily swap (support) at 1.3266. As such, this is the zone we’d feel most comfortable to buy from (confirmation still advised due to where price is positioned on the weekly timeframe – see above) during today’s trade.
Levels to watch/ live orders:
- Buys:1.3267 [Tentative – confirmation required] (Stop loss: dependent on where one confirms this level).
- Sells:1.3415 [Tentative – confirmation required] (Stop loss: dependent on where one confirms this level).
USD/CHF:
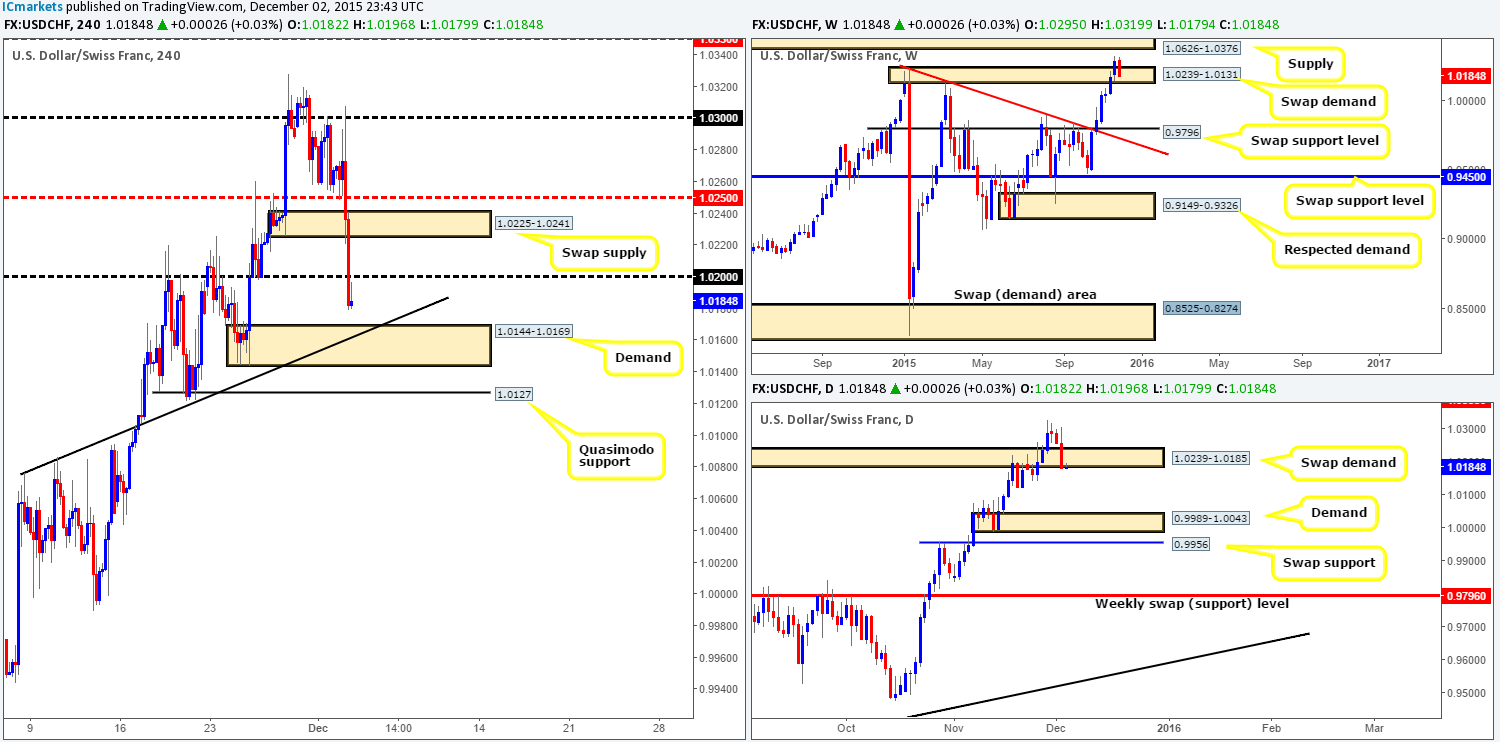
Going into the early hours of the American session, the Swissy dropped like a rock after tagging in offers around psychological resistance 1.0300. Mid-level support 1.0250, demand (now supply) at 1.0225-1.0241 and psychological support 1.0200 were taken out during this downside move.
In addition to the above H4 levels being wiped out, price also closed below the daily swap (demand) area at 1.0239-1.0185. Could this suggest further selling today? From a technical standpoint, we would say, no. The reason being is price remains trading within a weekly swap (demand) base at 1.0239-1.0131. Therefore, as long as this area holds price, we feel buying this market is the way to go…
With that being said, we’ll be eyeing the H4 demand at 1.0144-1.0169 (converges nicely with trendline support taken from 1.0076) for a potential long today. Waiting for lower timeframe confirmation at this barrier before buying here is HIGHLY recommended due to the possibility of price faking lower to connect with bids sitting around the Quasimodo support level just below it at 1.0127 (located a few pips below the aforementioned weekly swap [demand] area), which is also an interesting buy zone to note down for today’s trade.
Levels to watch/ live orders:
- Buys: 1.0144-1.0169 [Tentative – confirmation required] (Stop loss: dependent on where one confirms this area). 1.0127 [Tentative – confirmation required] (Stop loss: dependent on where one confirms this level).
- Sells: Flat (Stop loss: N/A).
DOW 30
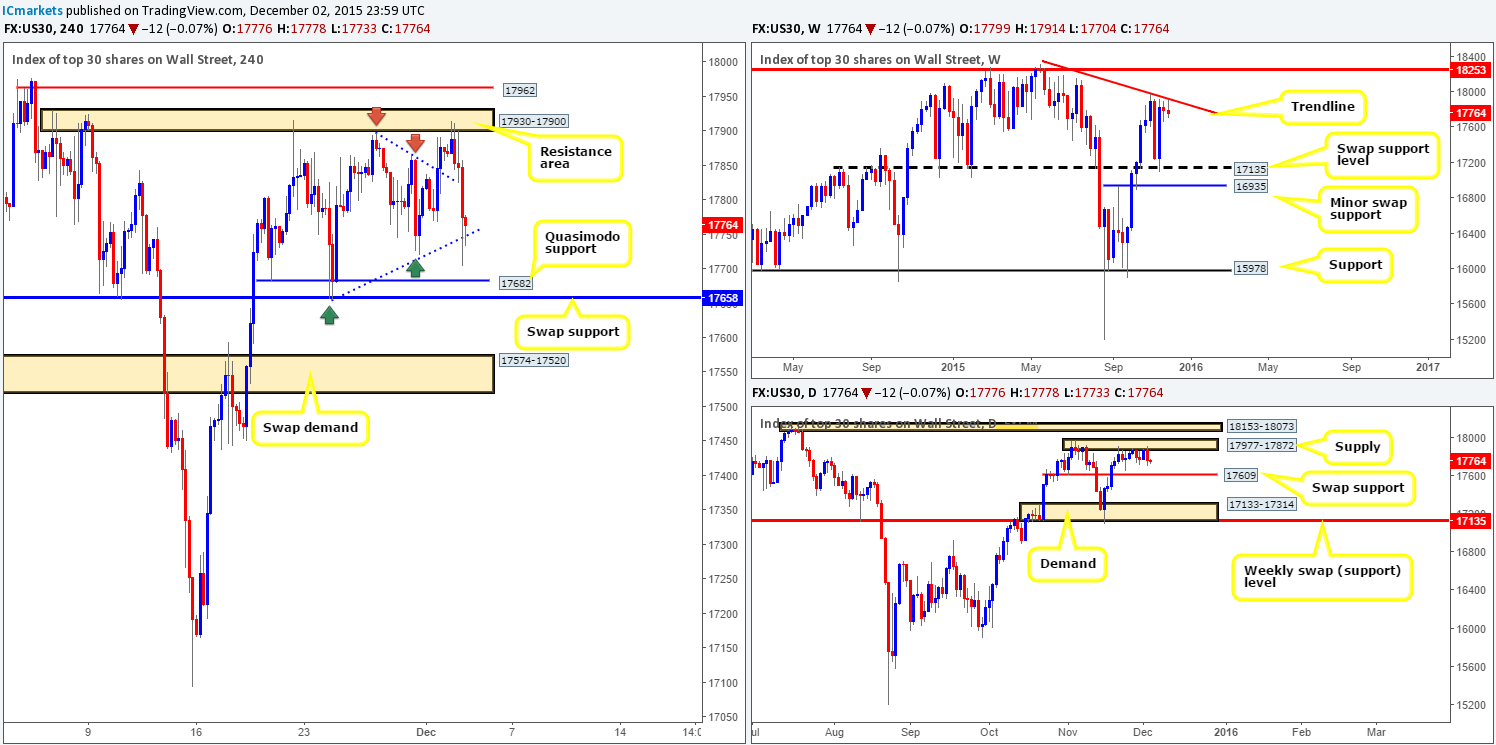
In our previous report (http://www.icmarkets.com/blog/wednesday-2nd-december-daily-technical-outlook-and-review/) we mentioned that we had no interest in buying the break or even entering long following any retest of the H4 wedge pattern (17898/17655). Instead we had our eye on the H4 resistance area above at 17930-17900 for (confirmed) shorts, due to this area being bolstered by both a weekly trendline resistance (18365) and a daily supply at 17977-17872.
As we can all see, price reacted beautifully to our chosen sell zone and heavily sold off. We managed to sell at 17895 at a M15 supply zone seen at 17906-17896, with our stop initially placed above the H4 resistance area at 17940. We’ve already locked in 50% of our position at 17830 – the top-side of the recently broken trendline (upper limit of the H4 wedge), and have just recently closed a further 30% at the lower limit of the H4 wedge line at 17748. Our stop is now at breakeven and we intend to let the remaining 20% of our position run, as we anticipate further downside to at least the daily swap (support) level coming in at 17609.
Other than our recent trade explained above, we see little opportunity to participate this market today. In closing, for anyone considering a long off of the current H4 wedge support might want to hold fire here, since let’s not forget where price is positioned on the higher timeframe picture (see above)!
Levels to watch/ live orders:
- Buys: Flat (Stop loss: N/A).
- Sells:17895 [LIVE] (Stop loss: breakeven).
XAU/USD: (Gold)
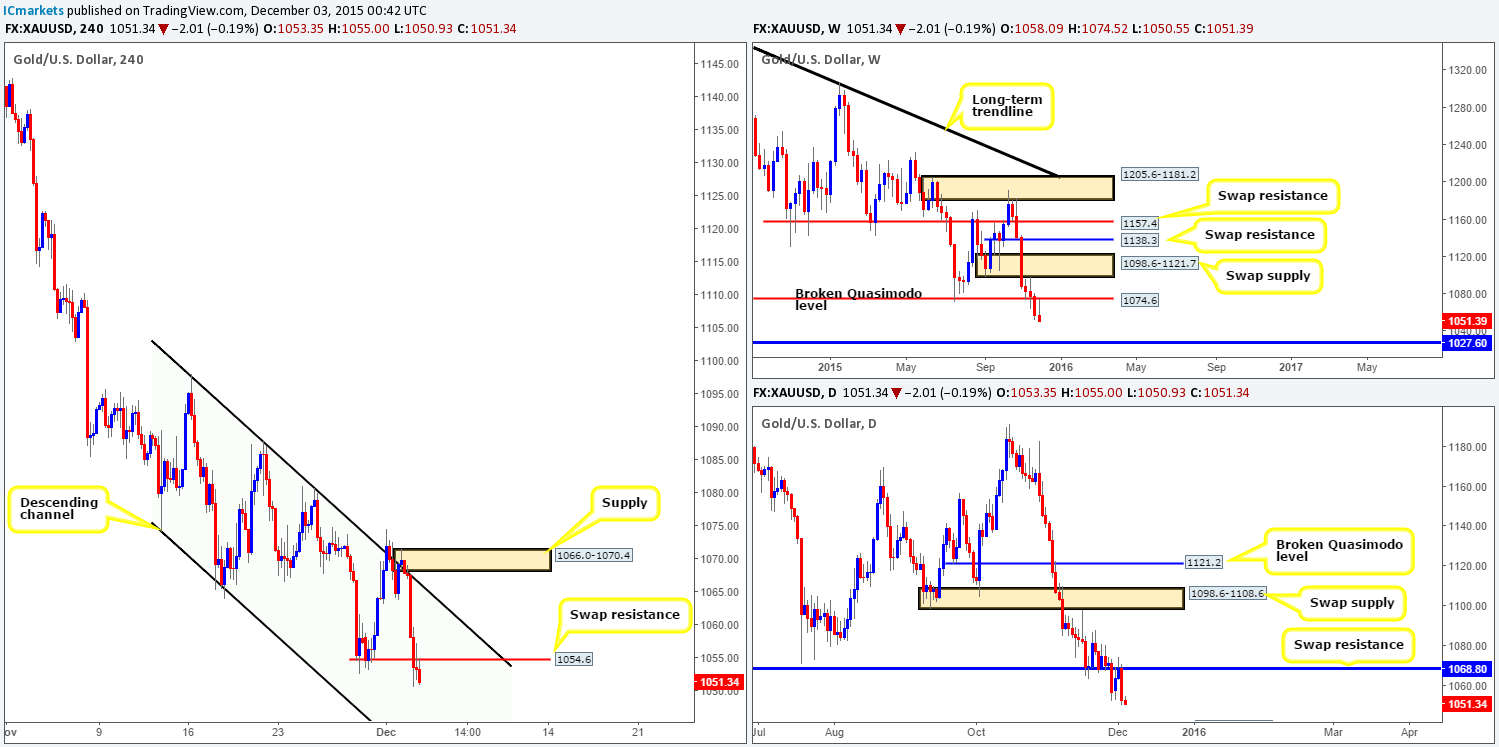
This morning’s analysis will kick-off with a look at the weekly chart, which, as you can see, shows price has retested the recently broken Quasimodo line at 1074.6 as resistance, and aggressively sold off. The next downside target falls in at a swap support level drawn from 1027.6. Turning our attention to the daily chart reveals that Gold heavily sold off yesterday from the underside of a swap resistance barrier at 1068.8. Assuming that the sellers continue to dominate this market, demand at 1026.5-1039.8 (surrounds the aforementioned weekly swap [support] level) will be the next objective to reach.
Moving down one more level to the H4 shows that the recent selling took place from around the channel resistance line extended from the high 1098.0, and ended the day taking out bids from last Friday’s low 1052.6. Given the clear bearish tone this market has taken on, today’s spotlight will firmly be focused on the swap resistance level at 1054.6. To short this barrier, we’d require a lower timeframe setup to form around this region. Without it, we would not feel confident selling here since price could just as easily change tracks and rally north back up to the aforementioned H4 channel resistance once again.
In the event that this comes to fruition, we’ll be ultimately looking to ride this train down to the lower limits of the current H4 descending channel taken from the low 1074.0, which appears to converge nicely with the daily demand area mentioned above at 1026.5-1039.8.
Levels to watch/ live orders:
- Buys: Flat (Stop loss: N/A).
- Sells:1054.6 [Tentative – confirmation required] (Stop loss: dependent on where one confirms this level).


