
A note on lower timeframe confirming price action…
Waiting for lower timeframe confirmation is our main tool to confirm strength within higher timeframe zones, and has really been the key to our trading success. It takes a little time to understand the subtle nuances, however, as each trade is never the same, but once you master the rhythm so to speak, you will be saved from countless unnecessary losing trades. The following is a list of what we look for:
- A break/retest of supply or demand dependent on which way you’re trading.
- A trendline break/retest.
- Buying/selling tails – essentially we look for a cluster of very obvious spikes off of lower timeframe support and resistance levels within the higher timeframe zone.
- Candlestick patterns. We tend to only stick with pin bars and engulfing bars as these have proven to be the most effective.
For us, lower timeframe confirmation starts on the M15 and finishes up on the H1, since most of our higher timeframe areas begin with the H4. Stops usually placed 5-10 pips beyond your confirming structures.
EUR/USD:
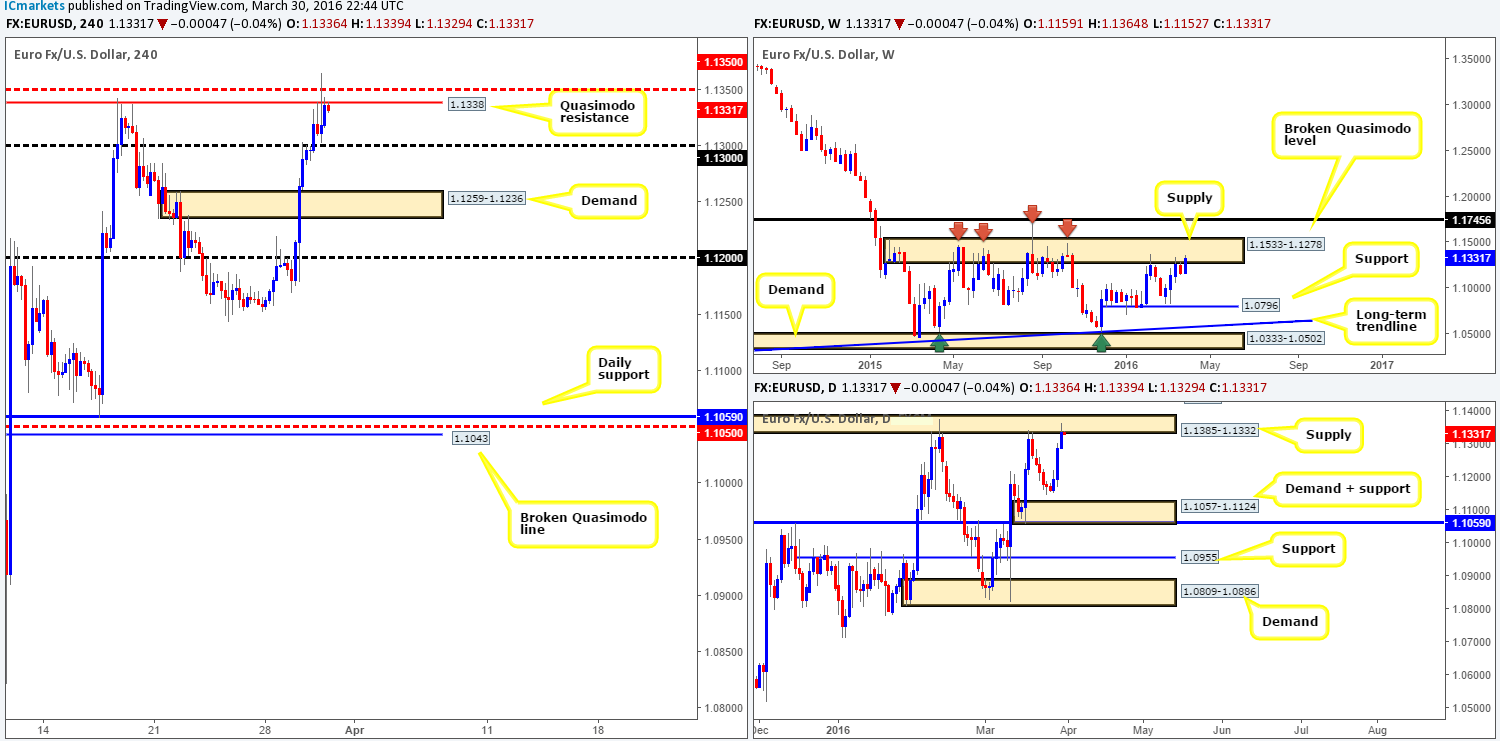
Starting from the top this morning, weekly action, as you can see, has edged itself higher into supply drawn from 1.1533-1.1278. The bulls will likely have their work cut out for them here since this area has held price lower since May 2015. Nevertheless, should this pair continue to drive north, the next key level beyond the current supply can be seen at 1.1745 – a broken Quasimodo line. Along the same vein, market participants on the daily scale are also trading at an established area of supply fixed at 1.1385-1.1332, which is housed within the aforementioned weekly supply. In the event of a break through this zone, one can likely expect price to reach 1.1460 – a clear-cut Quasimodo resistance line.
Sliding across to the H4 chart, the Quasimodo resistance line at 1.1338 alongside the mid-level barrier just above at 1.1350 held prices lower going into the American session yesterday. On the surface, H4 candle action shows that the bulls have a slight edge in this market right now. Should this encourage follow-through buying, the next area of interest comes in at supply taken from 1.1451-1.1425 – sitting just above psychological resistance 1.1400 and just beneath the aforementioned daily Quasimodo resistance line.
Regardless of the H4 candle action, however, higher-timeframe structure (see above) indicates that the single currency may decline in value, so we all need to be prepared for this. To safely trade this move, nonetheless, waiting for price to close below 1.1300 might be the best path to take as this will prove bearish strength. In addition, this would allow one to take any retest seen to the underside of this line and target H4 demand at 1.1259-1.1236 as a first take-profit target.
Levels to watch/live orders:
- Buys: Flat (Stop loss: N/A).
- Sells: Watch for price to consume 1.1300 and look to trade any retest seen thereafter (lower timeframe confirmation required).
GBP/USD:
During the course of yesterday’s sessions, the H4 chart shows that Cable ran into a strong ceiling of offers around psychological resistance 1.4400 – just look at those selling wicks! Consequent to this, daily activity chalked up a beautiful-looking bearish selling wick which missed connecting with supply at 1.4578-1.4467 by a few pips. This, by and of itself, suggests a downward move may take place today as there’s also room for prices to sell-off to support penciled in at 1.4079. By contrast, up on the weekly chart, the rebound from just above the broken Quasimodo line at 1.4051 still appears in good shape, with room being seen to advance at least until the 1.4514 region. So one still needs to tread carefully if considering shorting this market!
In light of the points made above, we feel that this unit may push south today and head in the direction of the 1.4300 figure. However, due to the weekly timeframe showing a slight edge going to the bulls (see above), placing a market sell order is out of the question. Therefore, our plan of attack will consist of hunting for lower timeframe (confirmed) sell entries in and around the 1.4400 region today, since getting caught on the wrong side of weekly flow will not do your account any favors. Regarding stops here, one has some leeway due to the first take-profit target (1.4300) placed at a fair distance.

Levels to watch/live orders:
- Buys: Flat (Stop loss: N/A).
- Sells: 1.4400 [Tentative – confirmation preferred] (Stop loss: dependent on where one confirms this level).
AUD/USD:
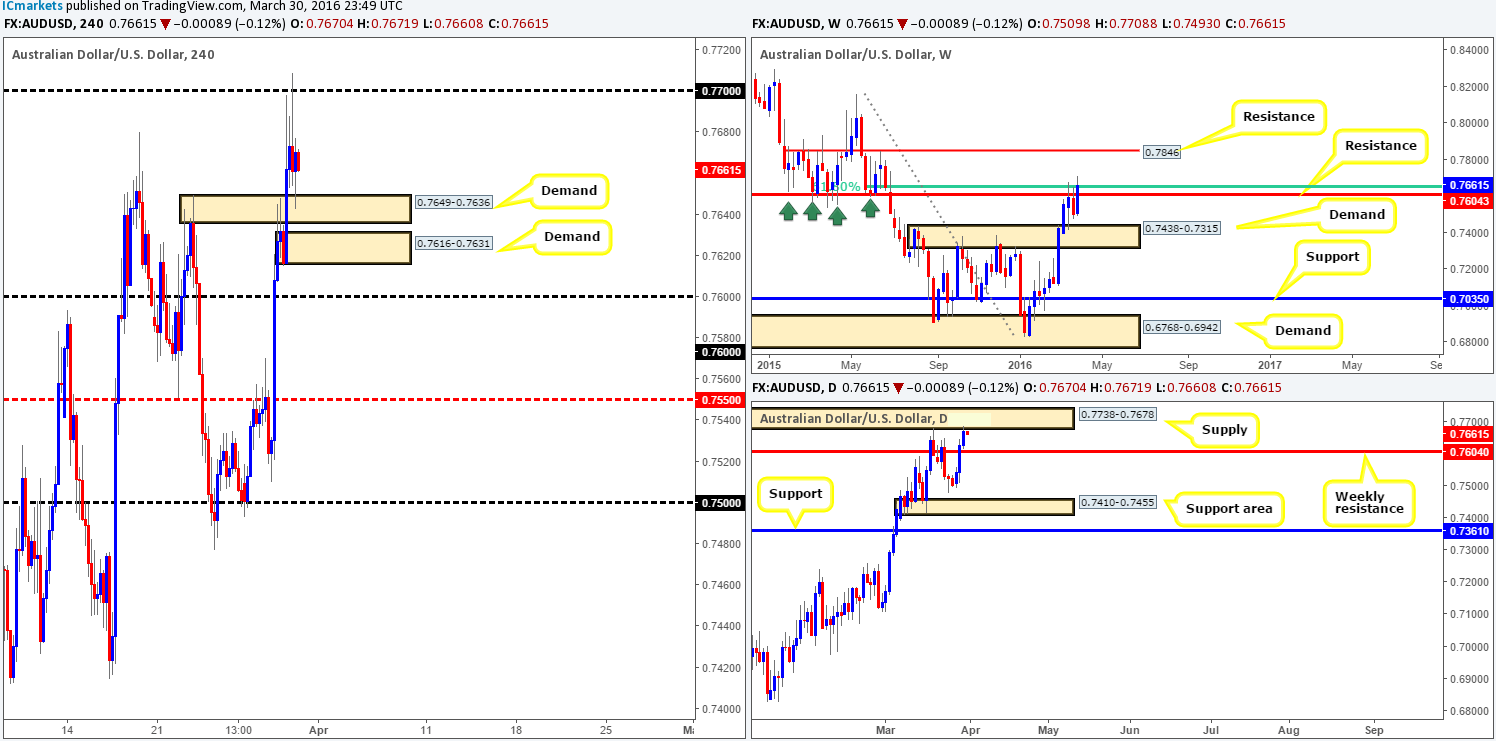
Early on in the American session price found active offers around psychological resistance 0.7700, forcing the commodity currency to retest a recently broken H4 supply as demand at 0.7649-0.7636 by the day’s end. Yesterday’s action marks the third consecutive daily gain for this pair, consequently placing daily action within the jaws of supply coming in at 0.7738-0.7678.
This daily supply, coupled with the fact that the weekly shows price positioned at a 61.8% Fibonacci level at 0.7646, we feel this pair may eventually decline in value. Despite this, selling is difficult when taking into consideration the H4 structures. Not only do we have the aforementioned H4 demand in play right now, but directly below sits another H4 demand at 0.7616-0.7631, followed closely by the 0.7600 handle. Ultimately, for a clear run at shorting this pair, the 0.7600 figure would need to be consumed since beyond here we see little support until at least the mid-level H4 barrier 0.7550.
With the above in mind, we’ve decided to watch from the sidelines today.
Levels to watch/live orders:
- Buys: Flat (Stop loss: N/A).
- Sells: Watch for price to consume 0.7600 and look to trade any retest seen thereafter (lower timeframe confirmation required).
USD/JPY:
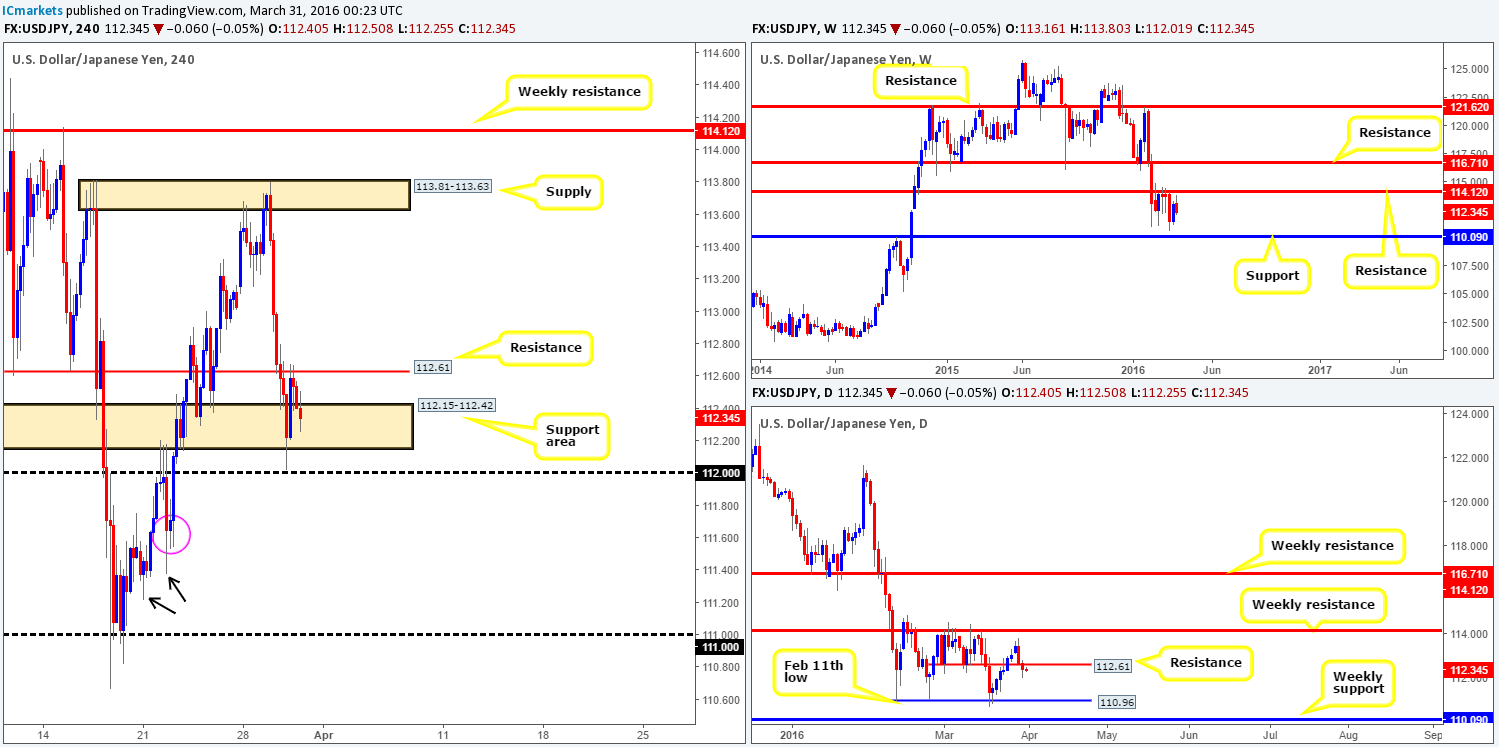
Going into yesterday’s European session price was seen driving lower, momentarily surpassing the H4 support area at 112.15-112.42 and tagging in bids just ahead of the 112.00 figure. This, as can be seen from the H4 chart, shows the bulls followed through with an offensive attack back up to retest resistance coming in at 112.61, which is also noted as resistance on the daily scale.
With stops likely removed from the current H4 support area, and some of the buying power consumed from 112.00, we’re looking for this unit to push lower today and possibly close beyond the 112.00 mark. Below this number we see little active H4 demand other than around the area marked with a pink circle at 111.53-111.71. Beyond here, however, there appears space for price to hit the 111.00 region, as demand seems to be consumed (see the H4 demand consumption tails marked with black arrows at 111.37/111.21).
In addition to the above, both the weekly and daily charts show clear space to move lower to at least daily support at 110.96 – effectively the 111.00 figure! On account of this, our plan of attack today will consist of watching for price to close below 112.00 and retest the underside of this line as resistance. Should we then manage to pin down a lower timeframe sell from here, we’d look to jump in short, and move our stop to breakeven once/if price reached the 111.60 mark. A close beyond this number would allow us to hold the position down to 111.00 – our final take-profit zone.
Levels to watch/live orders:
- Buys: Flat (Stop loss: N/A).
- Sells: Watch for price to consume 112.00 and look to trade any retest seen thereafter (lower timeframe confirmation required).
USD/CAD:
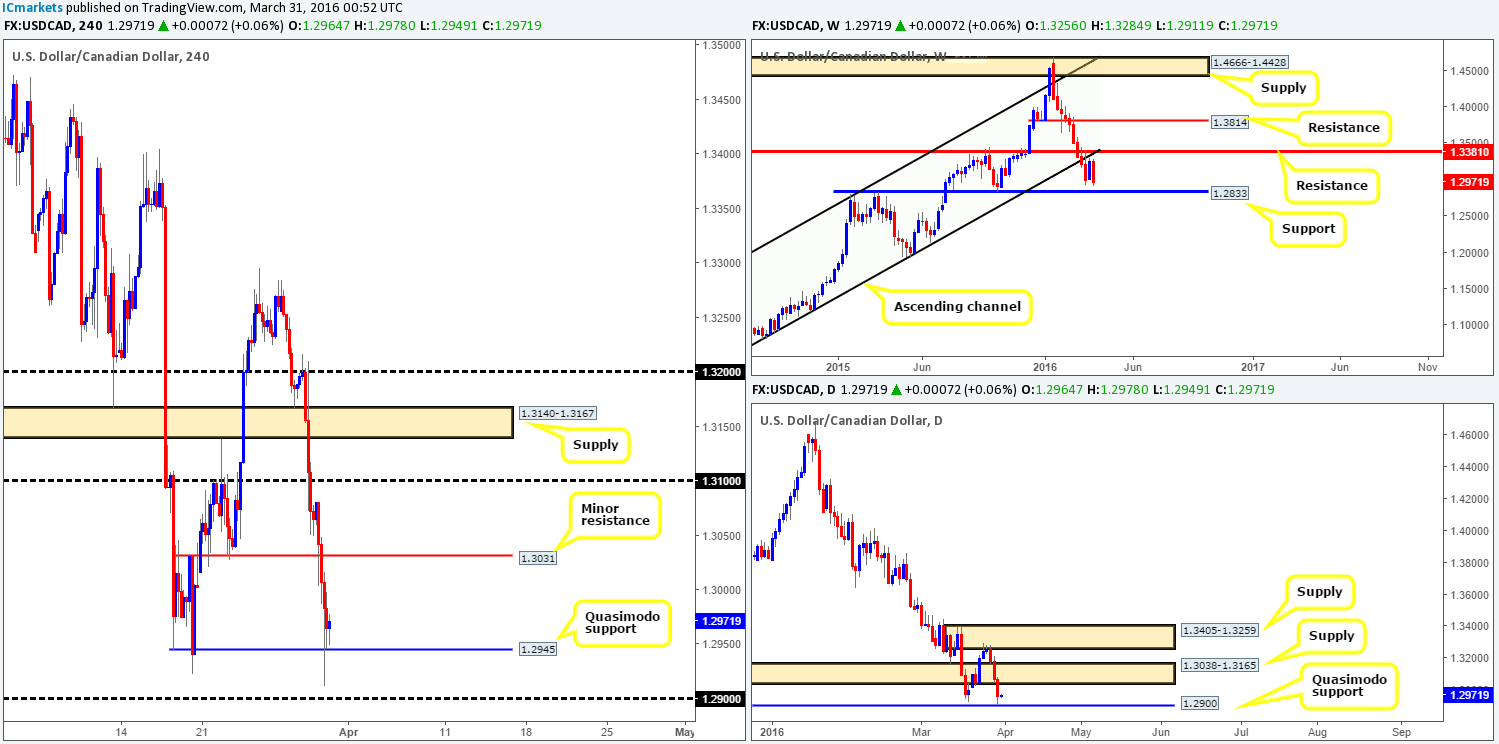
This morning’s analysis of the USD/CAD will begin with a quick peek at the weekly chart, which shows the bears looking incredibly aggressive at the moment. The next downside target to keep an eye on from this angle falls in at 1.2833 – a clear line of support. Scrolling down to the daily chart, demand at 1.3038-1.3165 (now acting supply) was recently taken out, which allowed price to come within touching distance of connecting with the Quasimodo support level at 1.2900.
Moving down one more level to the H4 chart, we can see that the recent selling forced price below a minor H4 support at 1.3031 (now acting resistance), which followed with an attack on the Quasimodo support line drawn from 1.2945 by the close 1.2964.
With price currently holding firm at this level, where do we go from here? Well, with this pair yet to connect with either weekly or daily support (see above), and the fact the predominant trend on this pair is clearly south, we’re not holding out much hope for the current H4 Quasimodo. The 1.2900 handle below looks to the more appealing area to buy from due to it also being a daily Quasimodo support! Therefore, we’ll be keeping an eye on this number today for potential longs, as well as the aforementioned weekly support positioned just below.
Levels to watch/live orders:
- Buys: 1.2900 [Tentative – confirmation preferred] (Stop loss: dependent on where one confirms this level). 1.2833 [Tentative – confirmation preferred] (Stop loss: dependent on where one confirms this level).
- Sells: Flat (Stop loss: N/A).
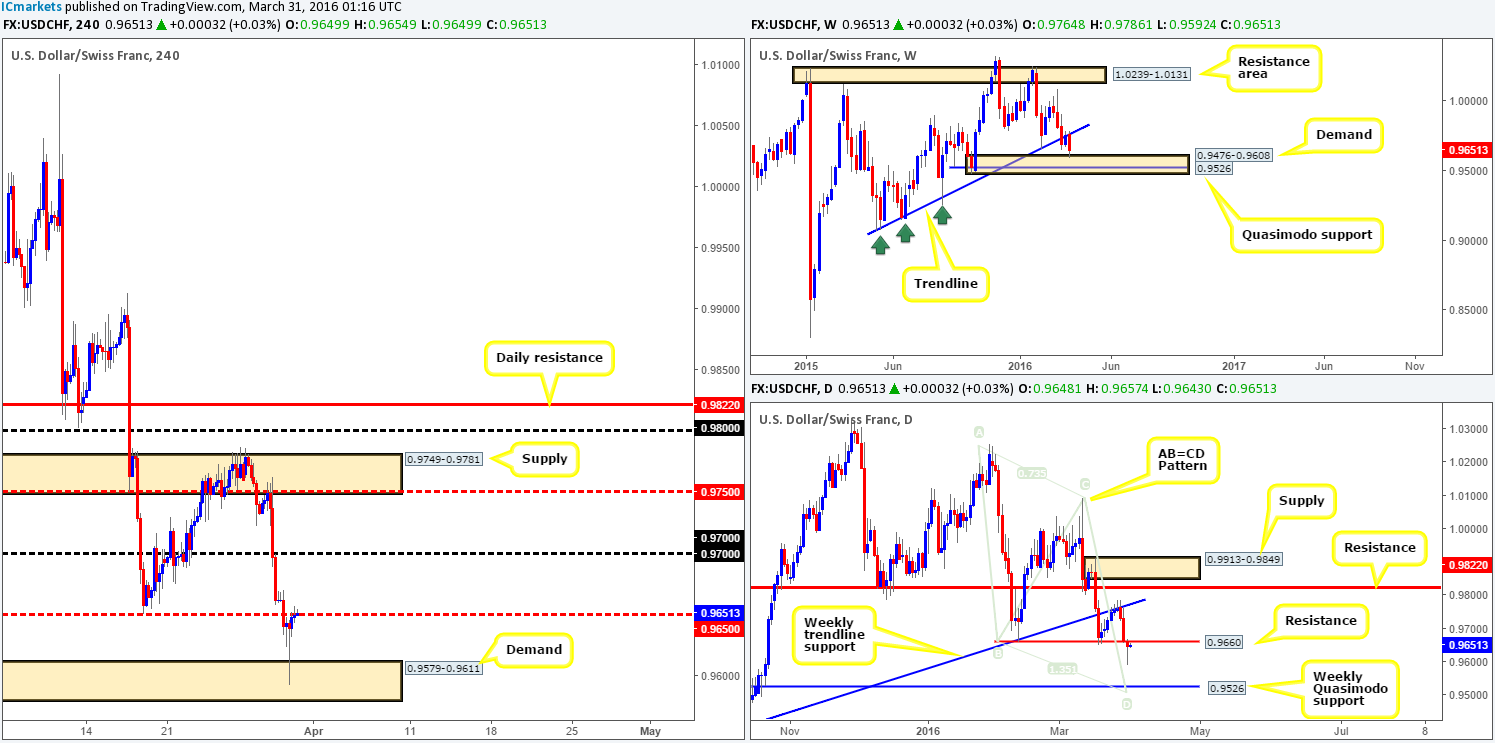
USD/CHF: (Slightly revised)
In recent sessions, price broke below the H4 mid-level hurdle 0.9650 and unfortunately failed to retest the underside of this line before aggressively spiking down to H4 demand painted at 0.9579-0.9611. The rebound from this zone, as you can see, trimmed intraday losses and is, at the time of writing, teasing the underside of 0.9650.
Putting the H4 chart aside for a minute, let’s focus on the higher-timeframe picture. Up on the weekly chart, price is currently trading from the top-side of demand penciled in at 0.9476-0.9608. Meanwhile, down on the daily chart, the Swissy closed below support at 0.9660 but printed a bullish buying tail by the day’s end.
With everything taken into consideration, this pair could potentially rally higher today/tomorrow. However, before we commit to buying this market, a close above and retest of the H4 mid-level number 0.9650 would need to be seen. This, at least in our opinion, would confirm bullish strength from the weekly demand, and imply daily resistance at 0.9660 is likely going to fail, and also allow one the opportunity trade long on the retest of 0.9650 (with lower timeframe confirmation) up to at least the 0.9700 handle.
Levels to watch/live orders:
- Buys: Watch for price to consume 0.9650 and look to trade any retest seen thereafter (lower timeframe confirmation required).
- Sells: Flat (Stop loss: N/A).
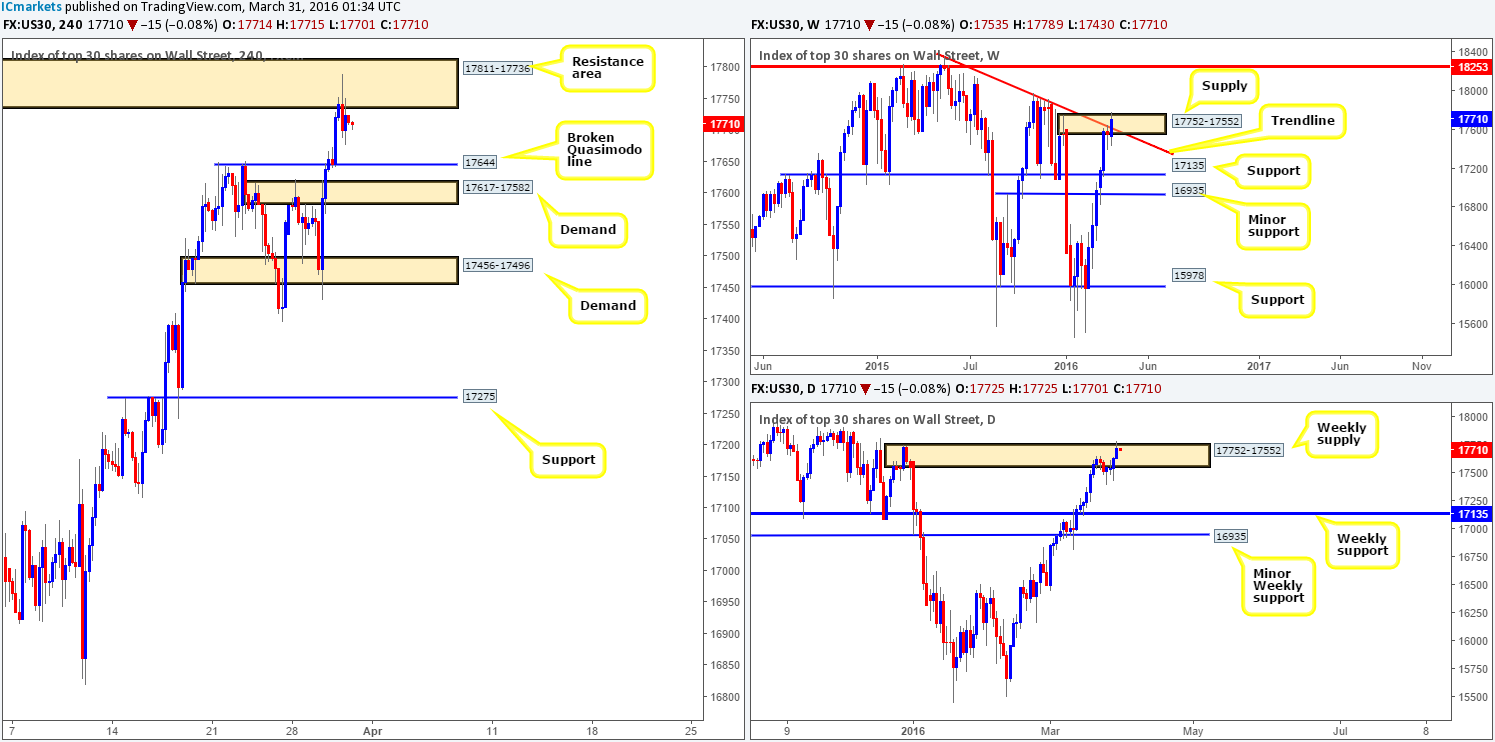
DOW 30:
For those who read our previous report on the DOW (see link below) you may recall that we mentioned to watch for price to retest the top-side of a H4 broken Quasimodo line at 17644, for an intraday long up to the H4 resistance area at 17811-17736. As is clear from the chart this played out beautifully, so well done to any of our readers who managed to lock in some profit here!
In addition to this, we also spoke about looking for lower timeframe selling opportunities around the aforementioned H4 resistance area. A reaction has clearly been seen, but as of yet we’ve not managed to pin down anything attractive enough to short. We’re hoping something will crop up today! The reason for our continued interest in this H4 zone is simply because it’s lodged within the extremes of a major weekly supply area coming in at 17752-17552. It will be interesting to see how today’s action pans out.
Levels to watch/live orders:
- Buys: Flat (Stop loss: N/A).
- Sells: 17811-17736 [Tentative – confirmation preferred] (Stop loss: dependent on where one confirms this area).
XAU/USD: (Gold)
Following a bearish reaction from the H4 supply at 1237.2-1243.9, Gold continued to sell-off going into yesterday’s American session. The day ended for the yellow metal at a loss with price consolidating around H4 demand coming in at 1224.6-1226.8.
In light of the above how do things stand on the higher timeframes? Over on the weekly chart, price remains firm above demand at 1205.6-1181.2 despite the recent selling. Daily action on the other hand, shows price aggressively sold off from the underside of supply given at 1260.1-1243.4. With room being seen on the daily to continue lower until at least the 28th March low 1205.4, further selling is very possible in this market since this would simply place weekly action back at the top-side of the aforementioned weekly demand.
As far as we can see, trading either long or short in this market is a valid call. A long from the current H4 demand would mean trading in-line with weekly flow (see above), targeting the H4 supply at 1237.2-1243.9, whilst a short on the break/retest of the H4 demand would be in-line with daily flow (see above), targeting H4 demand at 1215.2-1218.6. Nevertheless, we will let the lower timeframe action (preferably above the M15) decide on direction as we prefer to trade what we see, not what we think! For example, if one were to see a lower timeframe supply engulfed, this, to us, is a signal to get long on any reasonable retracement into support, targeting the next H4 zone.

Levels to watch/live orders:
- Buys: 1224.6-1226.8 [Tentative – confirmation required] (Stop loss: dependent on where one confirms this area).
- Sells: 1224.6-1226.8 [Tentative – confirmation required] (Stop loss: dependent on where one confirms this area).


