
Waiting for lower timeframe confirmation is our main tool to confirm strength within higher timeframe zones, and has really been the key to our trading success. It takes a little time to understand the subtle nuances, however, as each trade is never the same, but once you master the rhythm so to speak, you will be saved from countless unnecessary losing trades. The following is a list of what we look for:
- A break/retest of supply or demand dependent on which way you’re trading.
- A trendline break/retest.
- Buying/selling tails/wicks – essentially we look for a cluster of very obvious spikes off of lower timeframe support and resistance levels within the higher timeframe zone.
We typically search for lower-timeframe confirmation between the M15 and H1 timeframes, since most of our higher-timeframe areas begin with the H4. Stops are usually placed 1-3 pips beyond confirming structures.
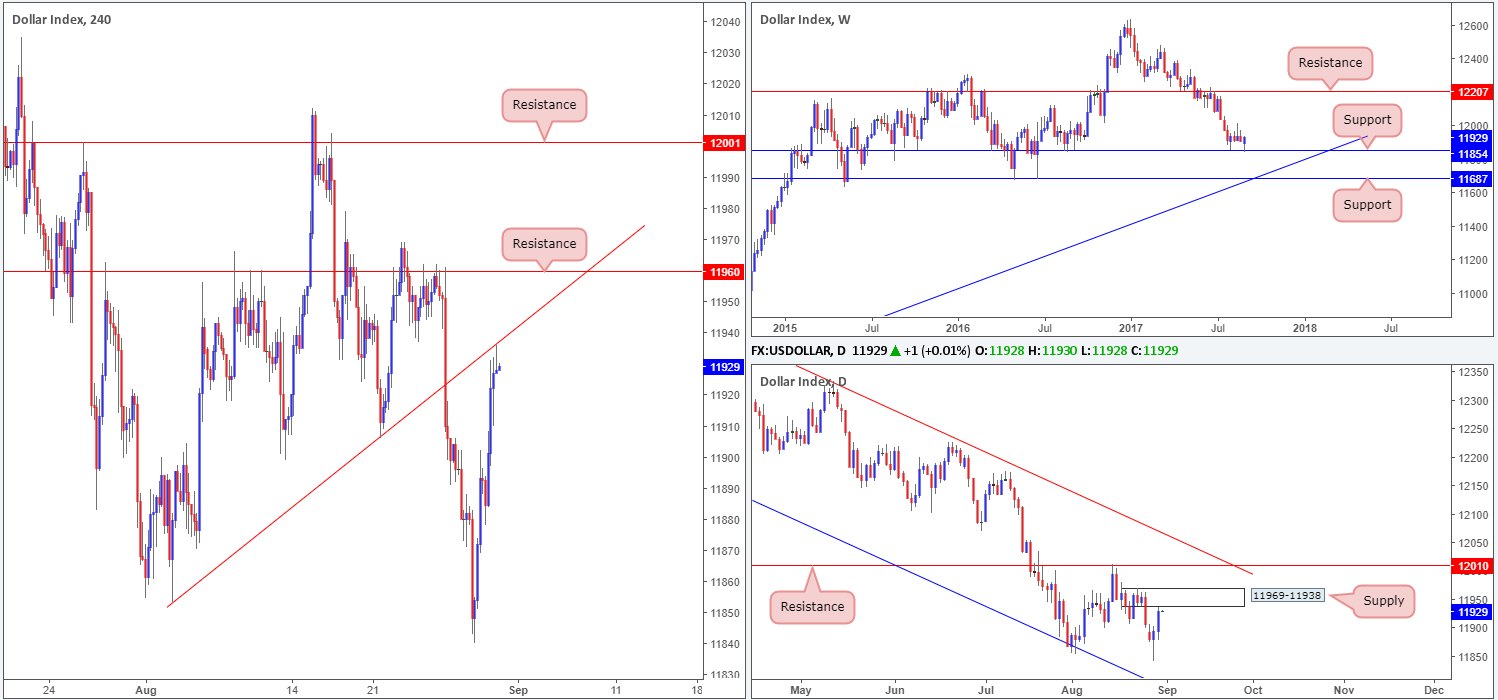
US dollar index (USDX):
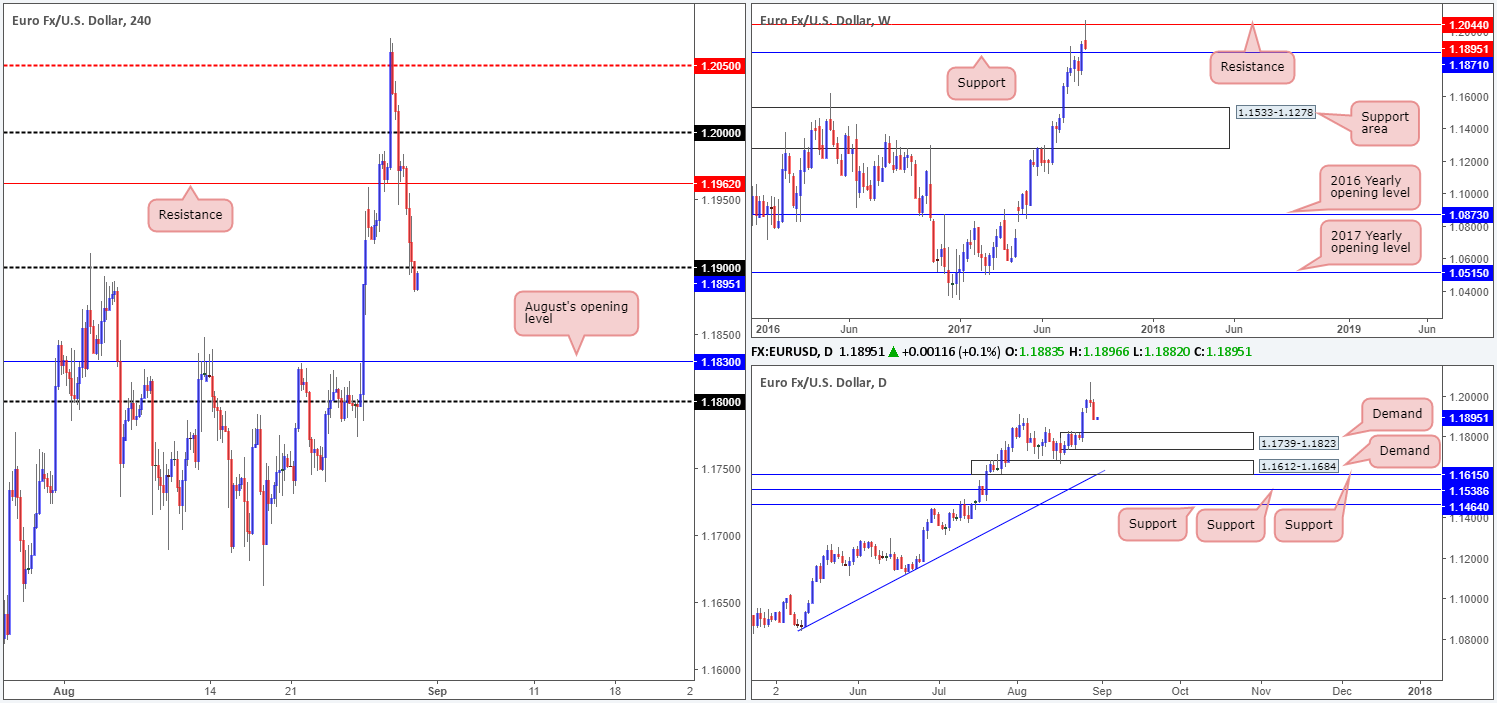
EUR/USD:
Having seen the USDX extend its bounce from weekly support at 11854 on Wednesday, it was of little surprise to see the single currency trade lower from weekly resistance pegged at 1.2044. As a result of this, price is now seen trading within touching distance of a weekly support at 1.1871.
Over on the H4 candles, price recently crossed below the 1.19 boundary. This, in our book, may have cleared the path south down to August’s opening level at 1.1830. Of concern though is the USDX H4 chart which shows price responding to a trendline resistance etched from the low 11853.
Also of particular interest is daily price. On the EUR chart we can see there’s room to trade as far down as demand marked at 1.1739-1.1823 (positioned a few pips below August’s opening level). Nevertheless, on the USDX price has already touched gloves with a daily supply zone coming in at 11969-11938.
Suggestions: Given the above notes our desk feels that neither a long nor short is viable at this present time.
Data points to consider: German Retail sales m/m at 7am, EUR inflation figures at 10am. US Unemployment claims and Core PCE index m/m at 1.30pm, US Pending home sales at 3pm GMT+1.
Levels to watch/live orders:
- Buys: Flat (stop loss: N/A).
- Sells: Flat (stop loss: N/A).
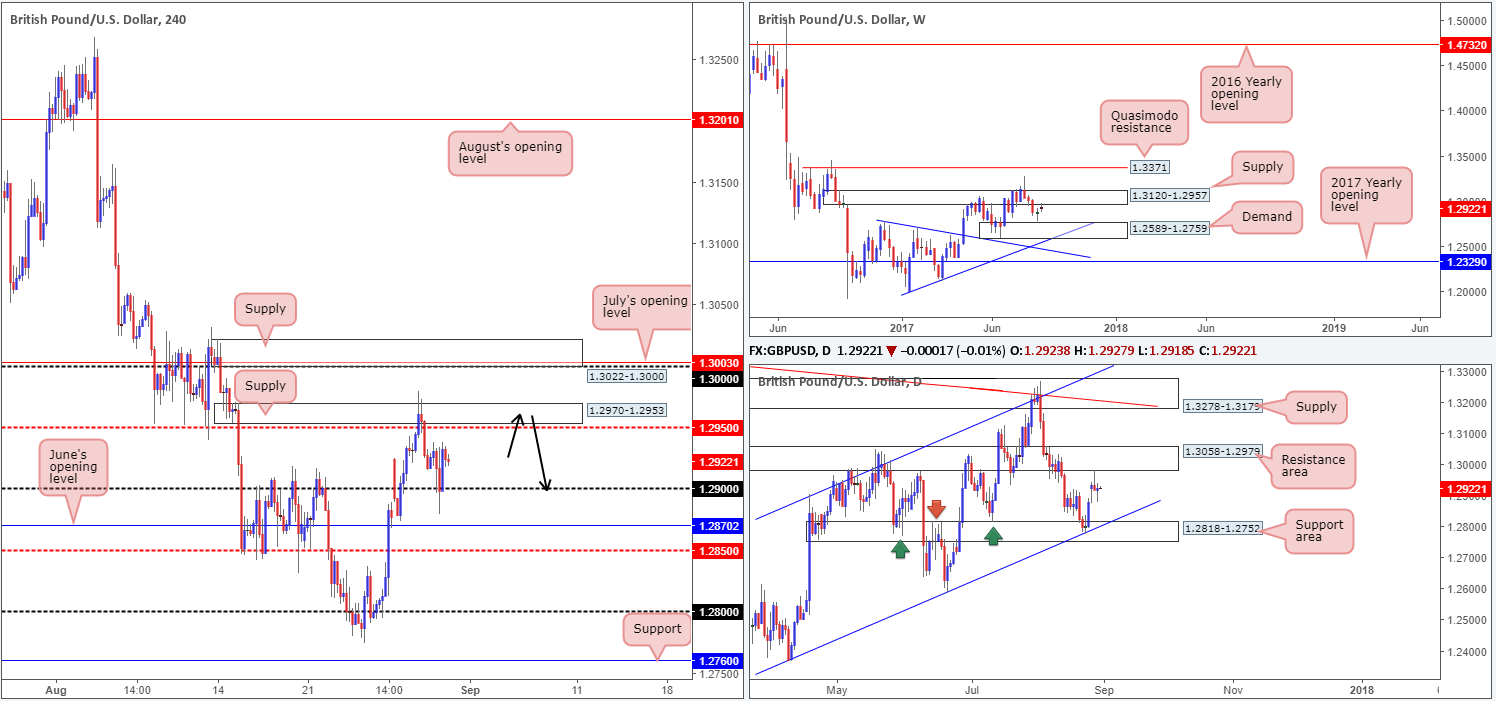
GBP/USD:
Despite the British pound aggressively puncturing the 1.29 handle during the early hours of US trading, the psychological number managed to remain intact and provide support. The next upside target from here can be seen at the H4 mid-level resistance drawn from 1.2950, followed closely by H4 supply at 1.2970-1.2953. Whether price will achieve this target is difficult to judge given the technical landscape on the bigger picture.
Weekly price is seen trading from supply pegged at 1.3120-1.2957, and daily action recently responded to a resistance area at 1.3058-1.2979. What’s also notable from a technical perspective is that daily price shows room to extend as far down as the support area seen at 1.2818-1.2752, which intersects with a channel support taken from the low 1.2365.
Suggestions: Should H4 price challenge the aforementioned H4 supply today and chalk up a bearish candle (preferably a full, or near-full-bodied candle) as per the black arrows, a sell from this area would be valid, in our opinion.
Data points to consider: MPC member Saunders speaks at 8.25am. US Unemployment claims and Core PCE index m/m at 1.30pm, US Pending home sales at 3pm GMT+1.
Levels to watch/live orders:
- Buys: Flat (stop loss: N/A).
- Sells: 1.2970-1.2953 ([waiting for a reasonably sized H4 bearish candle to form – preferably a full, or near-full-bodied candle – is advised] stop loss: ideally beyond the candle’s wick).
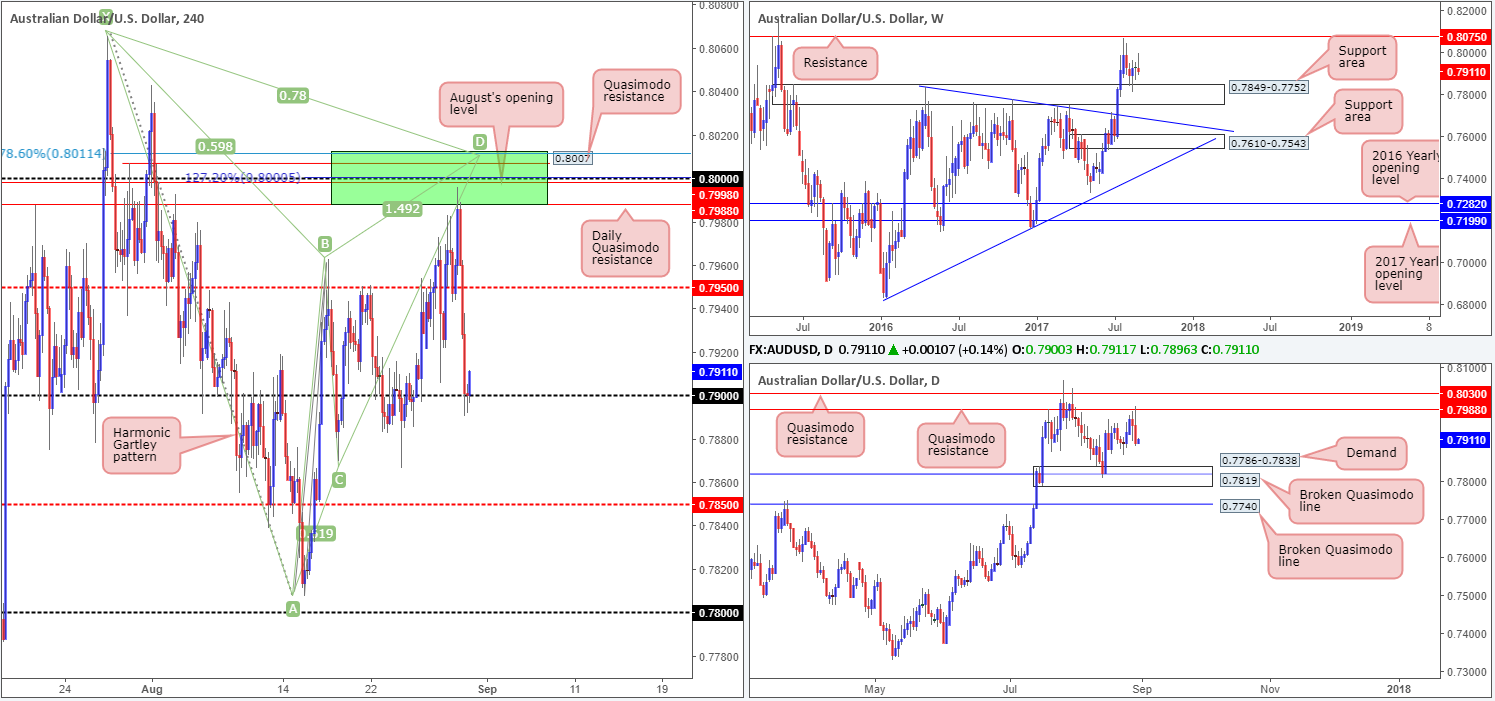
AUD/USD:
For those who have been following our recent analysis on the AUD/USD, you may recall that we highlighted the 0.8011/0.7988 area seen marked in green on the H4 timeframe as a potential sell zone. Our reasoning behind selecting this zone began with the large psychological number 0.80. Apart from this though, there were several nearby structures that complemented this level:
- The daily Quasimodo resistance level at 0.7988.
- A H4 Quasimodo resistance level at 0.8007.
- A H4 127.2% Fib ext. point at 0.80 taken from the low 0.7807.
- August’s opening level at 0.7998.
- A H4 Harmonic Gartley reversal point at the 78.6% Fib resistance line drawn from 0.8011.
As can be seen from the H4 chart, price recently crossed swords with 0.8011/0.7988 and fell sharply. Unfortunately, we missed this entry, but well done to any of our readers who managed to jump aboard here!
The recent descent has brought price into contact with the 0.79 handle, which, for now, is seen holding ground. According to both the weekly and daily timeframes, there’s room for price to extend down to at least the H4 mid-level support at 0.7850 (denotes the top edge of the weekly support area at 0.7849-0.7752), thus suggesting 0.79 may not survive.
Suggestions: A H4 close below 0.79, followed up with a retest and a lower-timeframe confirming signal (see the top of this report) would, in our view, be enough to validate an intraday short, targeting the 0.7850 neighborhood.
Data points to consider: Australian Private capital expenditure q/q at 2.30am, Chinese manufacturing PMI at 2am. US Unemployment claims and Core PCE index m/m at 1.30pm, US Pending home sales at 3pm GMT+1.
Levels to watch/live orders:
- Buys: Flat (stop loss: N/A).
- Sells: Watch for H4 price to engulf 0.79 and then look to trade any retest seen thereafter ([waiting for a lower-timeframe confirming signal to form following the retest is advised] stop loss: dependent on where one confirms this level).
USD/JPY:
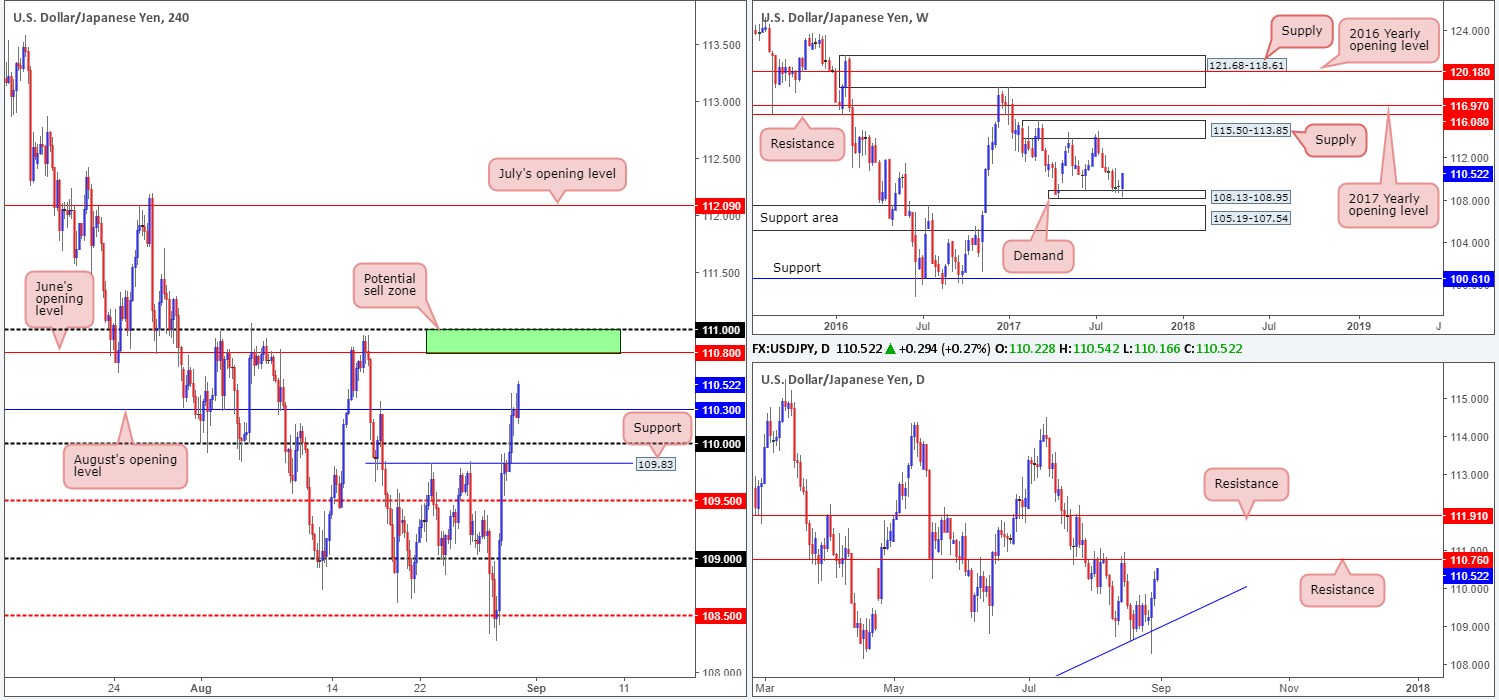
Another strong session for the USD/JPY yesterday lifted H4 price above multiple tech resistances. The latest move, however, has seen the unit cross above August’s opening level at 110.30, which has likely placed June’s opening level at 110.80 in the firing range (converges with a daily resistance level at 110.76). Having seen price connect with a weekly demand base at 108.13-108.95, and a daily trendline support extended from the low 100.08, the recent buying should not really come as much of a surprise.
Suggestions: The 111 handle and June’s opening level at 110.80, coupled with the aforesaid daily resistance line, could hold prices lower today. But is this area enough to convince traders to short, considering that weekly price is trading from demand? Personally, we would not want to be sellers when weekly buyers are showing strength, so we will humbly remain on the sidelines today and reassess structure going into Friday’s segment.
Data points to consider: US Unemployment claims and Core PCE index m/m at 1.30pm, US Pending home sales at 3pm GMT+1.
Levels to watch/live orders:
- Buys: Flat (stop loss: N/A).
- Sells: Flat (stop loss: N/A).
USD/CAD:
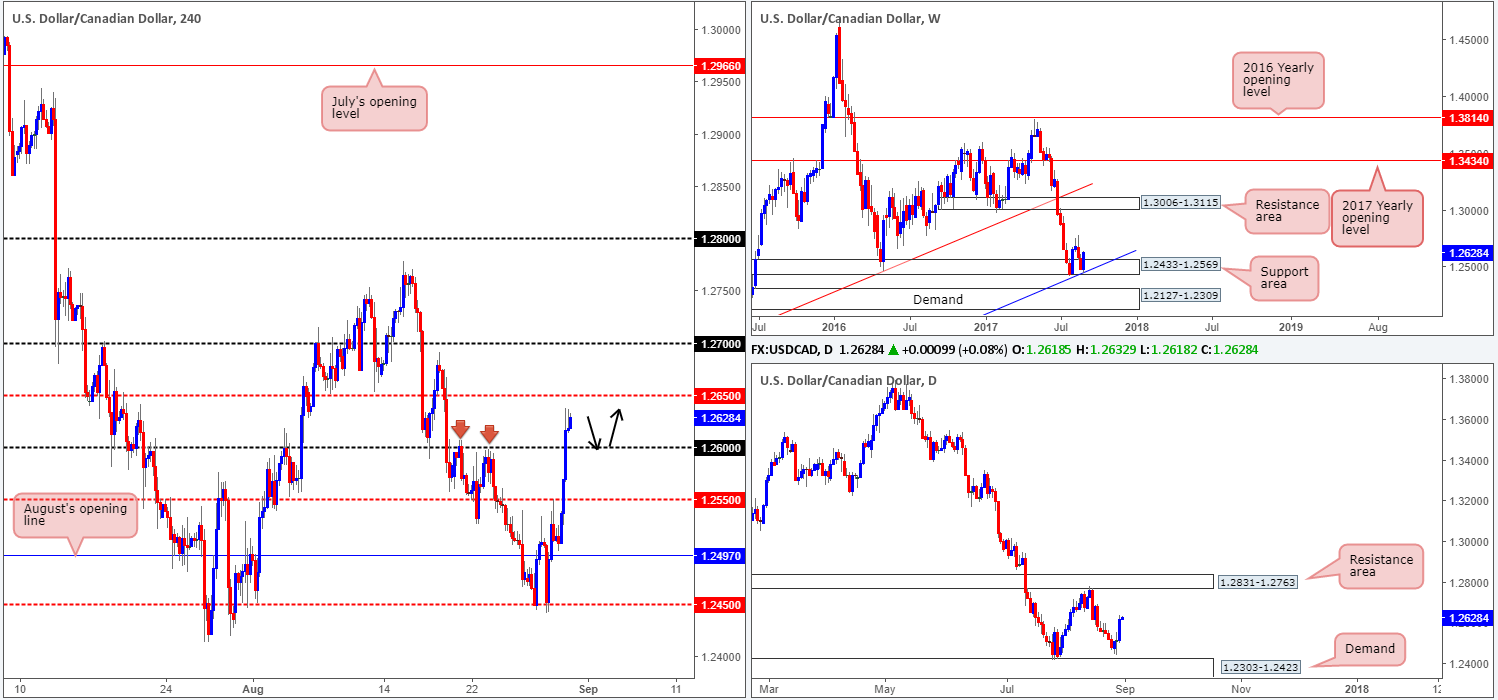
Leaving August’s opening level at 1.2497 unchallenged the USD/CAD surged higher on Wednesday (helped by crude oil prices dropping sharply), ending the day closing beyond the 1.26 handle. Now, according to the higher timeframes, there is room for further buying in this market. Weekly price recently reconnected with a support area at 1.2433-1.2569, which fuses nicely with a trendline support etched from the low 0.9633. And daily price shows room to extend up as far as the resistance area seen at 1.2831-1.2763.
Suggestions: We believe the pair is likely to find some support around 1.26 should the unit pullback today, with it having been a reasonably strong barrier of resistance in the past (see red arrows). A retest at 1.26, coupled with a lower-timeframe buy signal (see the top of this report), would, in our technical view, be sufficient enough to warrant an intraday buy, targeting the 1.2650 region as an initial take-profit zone.
Data points to consider: US Unemployment claims and Core PCE index m/m at 1.30pm, US Pending home sales at 3pm. Canadian growth data at 1.30pm GMT+1.
Levels to watch/live orders:
- Buys: 1.26 region ([waiting for a lower-timeframe buy signal to form is advised] stop loss: dependent on where one confirms this number).
- Sells: Flat (stop loss: N/A).
USD/CHF:
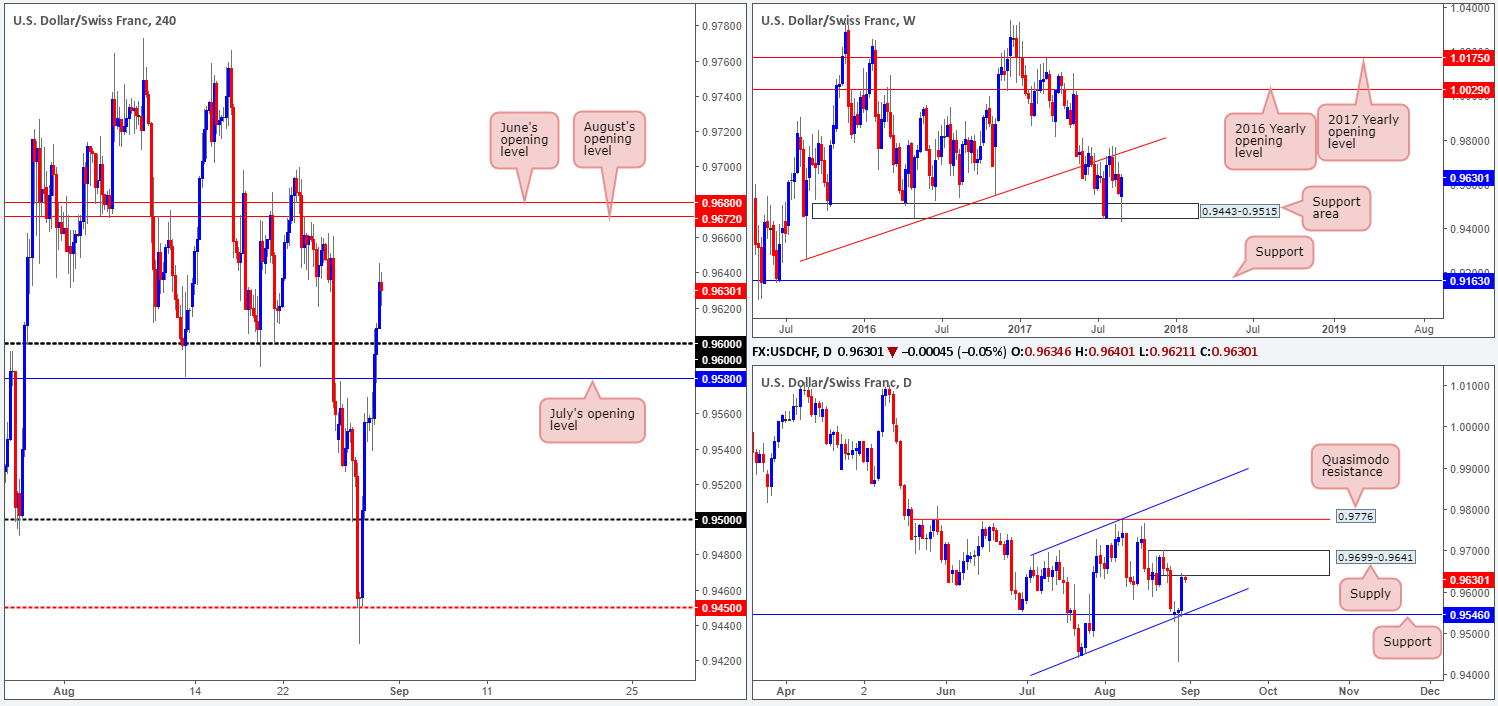
During the course of yesterday’s sessions, the USD/CHF nudged above both July’s opening level at 0.9580 and the 0.96 handle. While the H4 candles show room to advance further today up to June/August’s opening levels at 0.9680/0.9672, it might be worth noting that daily price recently shook hands with a supply zone penciled in at 0.9699-0.9641 (an area we failed to recognize in Wednesday’s report). The flip side to this, of course, is weekly price shows space to move north until we reconnect with the trendline resistance etched from the low 0.9257.
Suggestions: Initially we were looking to buy on any retest seen at 0.96/0.9580. But this was before becoming aware of the aforementioned daily supply. Therefore, we’re in two minds as to whether this trade is still viable or not. With that being the case, we feel the best course of action may be to remain on the sidelines for now and reassess the market going into the tomorrow’s open.
Data points to consider: US Unemployment claims and Core PCE index m/m at 1.30pm, US Pending home sales at 3pm GMT+1.
Levels to watch/live orders:
- Buys: Flat (stop loss: N/A).
- Sells: Flat (stop loss: N/A).
DOW 30:
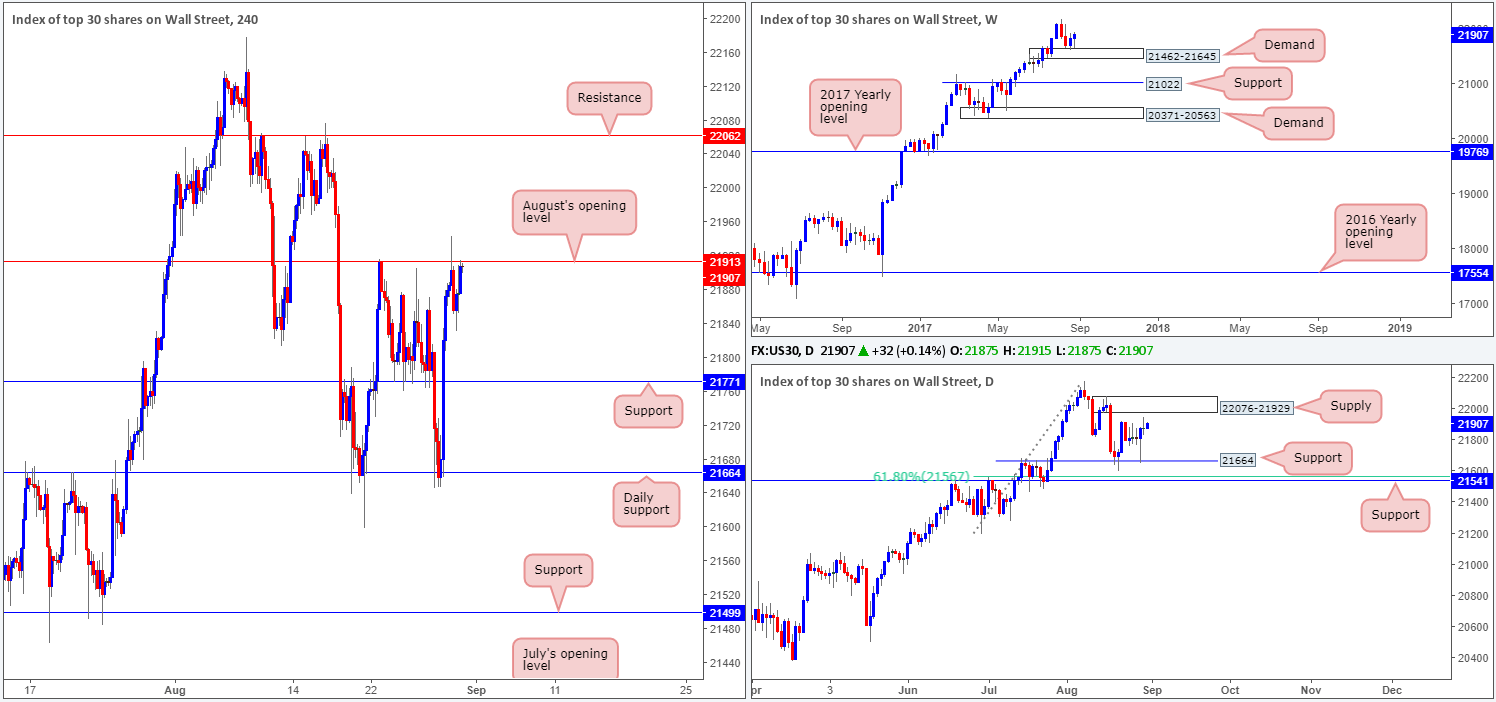
Kicking this morning’s report off with a look at the weekly timeframe, it’s clear to see the bulls are making a stand from demand at 21462-21645. Providing that the unit remains bid from here, the next port of call will likely be fresh record highs. The story on the daily timeframe, however, shows that after price bounced from support at 21664 this brought the index up to within striking distance of supply coming in at 22076-21929.
Across on the H4 candles, we can see that August’s opening level at 21913 remains defensive, despite an earnest attempt to push higher during the early hours of yesterday’s London morning segment. Our initial thoughts, given the position of price on the weekly chart at the moment, were to look for longs above 21913 and target the H4 resistance at 22062 as an initial take-profit level. However, by doing this we’d effectively be entering long into a daily supply base!
Our suggestions: Considering the strength of the underlying trend in this market and the current weekly demand, the noted daily supply will, we believe, eventually be taken out. Despite this, the risk of buying into a daily supply zone is just too great, and quite simply not worth the risk, in our opinion.
Data points to consider: US Unemployment claims and Core PCE index m/m at 1.30pm, US Pending home sales at 3pm GMT+1.
Levels to watch/live orders:
- Buys: Flat (stop loss: N/A).
- Sells: Flat (stop loss: N/A).
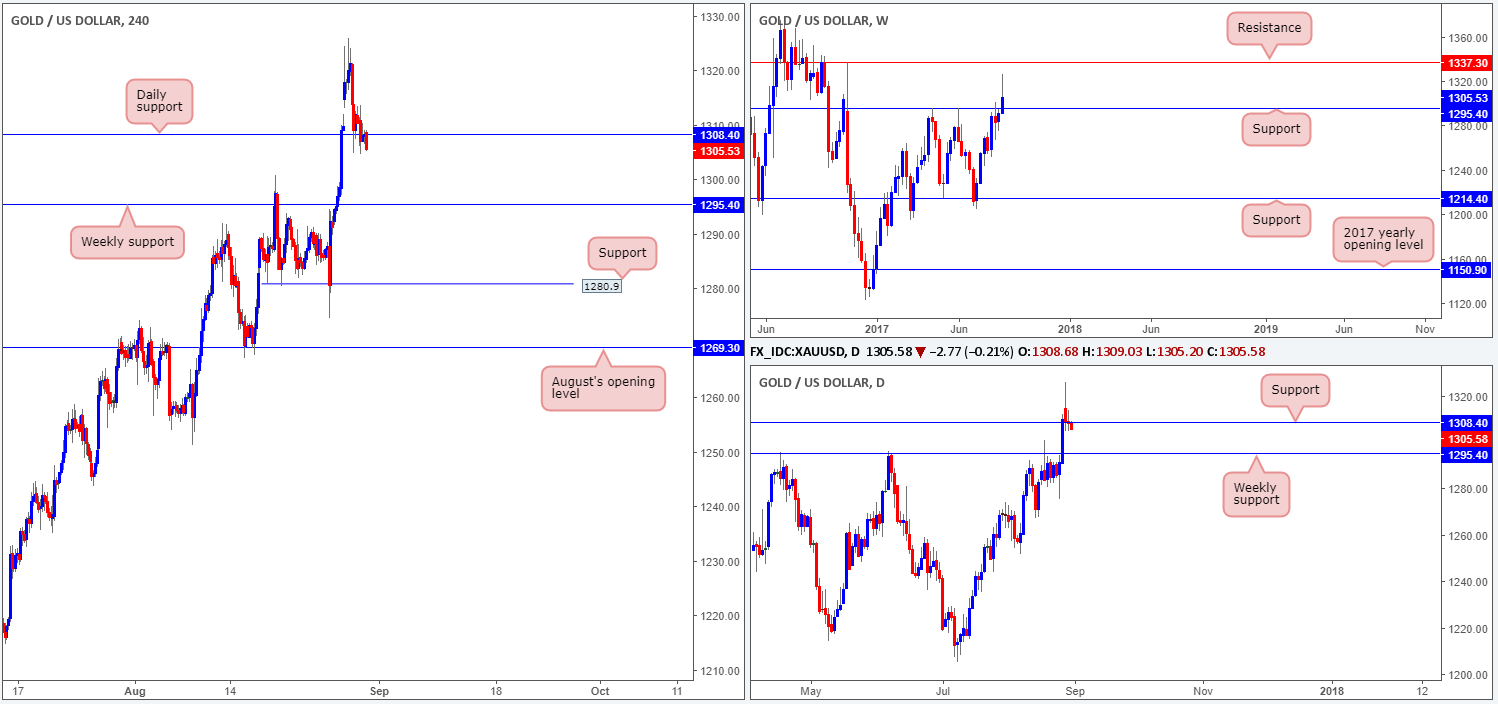
GOLD:
Despite price trading around a daily support level at 1308.4, the recent dollar advance has made it difficult for the bulls to stamp in any type of authority here. A decisive H4 close below this daily support could lead to a move being seen down to the weekly support level coming in at 1295.4.
For those of you who read Wednesday’s report you may remember the team taking a long position from 1311.9, and placing a stop below at 1304.4. In light of recent movement, we’re likely going to take a hit on this one.
Our suggestions: Right now, we do not see a whole lot to hang our hat on at the time.
Levels to watch/live orders:
- Buys: Flat (stop loss: N/A).
- Sells: Flat (stop loss: N/A).


