
A note on lower timeframe confirming price action…
Waiting for lower timeframe confirmation is our main tool to confirm strength within higher timeframe zones, and has really been the key to our trading success. It takes a little time to understand the subtle nuances, however, as each trade is never the same, but once you master the rhythm so to speak, you will be saved from countless unnecessary losing trades. The following is a list of what we look for:
- A break/retest of supply or demand dependent on which way you’re trading.
- A trendline break/retest.
- Buying/selling tails/wicks – essentially we look for a cluster of very obvious spikes off of lower timeframe support and resistance levels within the higher timeframe zone.
- Candlestick patterns. We tend to only stick with pin bars and engulfing bars as these have proven to be the most effective.
We search for lower timeframe confirmation between the M15 the H1 timeframes, since most of our higher-timeframe areas begin with the H4. Stops are usually placed 5-10 pips beyond confirming structures.
EUR/USD:
The EUR currency closed positively for the third consecutive day yesterday, resulting in price cutting through the 1.11 handle and reaching highs of 1.1111 on the day. Beyond 1.11 we see very little H4 resistance until the H4 mid-way line coming in at 1.1150, which, as you can see, also brings together a H4 resistance at 1.1162 and a H4 50.0% Fib resistance at 1.1170 (green box).
Thanks to yesterday’s buying, daily supply at 1.1057-1.1108 was consumed (now acting demand). What this move also did was potentially pave the way north for prices to challenge daily resistance registered at 1.1203. Weekly technicals on the other hand show price could now move either way. To the upside there’s the long-term weekly resistance area drawn from 1.1533-1.1278, and to the downside a clean weekly support line is seen at 1.0796.
Our suggestions: Watch for lower timeframe sell entries around the 1.1150/1.1170 region (H4 green box). The reason behind requiring lower timeframe confirmation within this H4 zone is because price could simply fake beyond our area to connect with the daily resistance line lurking above around the 1.1200 mark (fakeout zone = yellow H4 zone)
Confirmation for our team is either a break of a demand followed by a subsequent retest, a trendline break/retest or simply a collection of well-defined selling tails around the higher timeframe level.

Levels to watch/live orders:
- Buys: Flat (Stop loss: N/A).
- Sells: 1.1150/1.1170 region [Tentative – confirmation required] (Stop loss: dependent on where one confirms this area).
GBP/USD:
Bolstered by a weaker dollar, the GBP rallied over 200 pips yesterday following a retest of the 1.33 handle as support. At the time of writing, H4 candles are seen lurking just above the 1.34 mark following a sell-off from 1.35. A retest of 1.34 will likely take place today and could potentially act as a suitable platform in which to hunt for long trades. Our rationale behind this approach simply comes down to traders likely looking to fill the large weekend gap up to the 1.36 hurdle. Should this play out, not only are longs possible from 1.34, but shorting from 1.36 is also very interesting. Not only does 1.36 merge with daily resistance at 1.3617 and a weekly resistance area at 1.3501-1.3804, but the H4 approach to 1.36 on the H4 would, as long as buyers come in at 1.34, chalk up a picture-perfect three-drive approach.
Our suggestions: With ‘Brexit’ volatility easing for now, traders may want to consider buying from 1.34, and also selling from 1.36, if price reaches this high. In that this pair remains in the spotlight, our team would not recommend placing pending orders at these levels. Waiting for lower timeframe confirmation, although does not guarantee a winning trade, can avoid unnecessary whipsaws and losses. Confirmation for our team is either a break of a supply/demand followed by a subsequent retest, a trendline break/retest or simply a collection of well-defined buying/selling tails/wicks around the higher timeframe level. Stops are usually placed 5-10 pips beyond confirming structures.
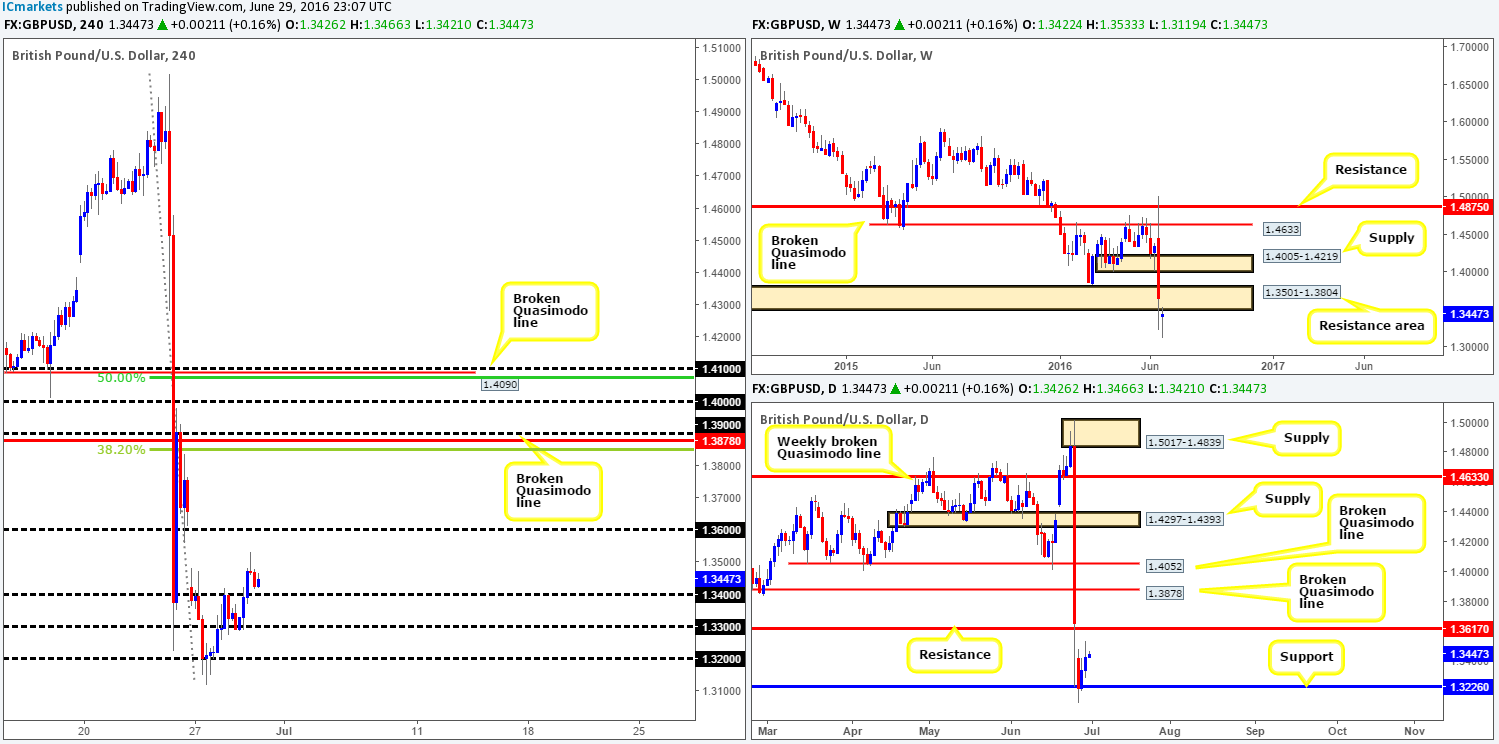
Levels to watch/live orders:
- Buys: 1.34 region [Tentative – confirmation required] (Stop loss: dependent on where one confirms this area).
- Sells: 1.36 region [Tentative – confirmation required] (Stop loss: dependent on where one confirms this area).
AUD/USD:
Further gains were posted in the AUD/USD market yesterday, forcing the pair to cut through the 0.74 handle and shake hands with the H4 mid-way resistance line at 0.7450. In conjunction with this, daily price is now seen kissing the underside of a daily supply fixed at 0.7517-0.7451. Building a case for a short entry is difficult, however, due to weekly action reflecting more of a bullish stance from weekly demand at 0.7438-0.7315. Not only this, but there’s room on the weekly chart seen to extend up to weekly resistance at 0.7604.
Our suggestions: Given the above points, our team is humbly going to pass on selling this market due to weekly structure (see above). All is not lost though! Should the Aussie continue to climb today, as the weekly timeframe suggests, a close above H4 supply at 0.7514-0.7486 would be interesting. This move would, as far as we can see, achieve the following:
- Remove offers from the current H4 supply and open the trapdoor for a rally up to the 0.76 handle (a nice take-profit target which coincides beautifully with weekly resistance at 0.7604).
- Clear offers around the current daily supply area and likely set the stage for a continuation move up to the weekly resistance at 0.7604.
- A retest of the H4 supply as demand would, as long as a lower timeframe buying signal was seen (please see the top of this report for confirming techniques), be enough for us to consider buying this market as let’s not forget that we’re actually buying alongside weekly flow (see above).
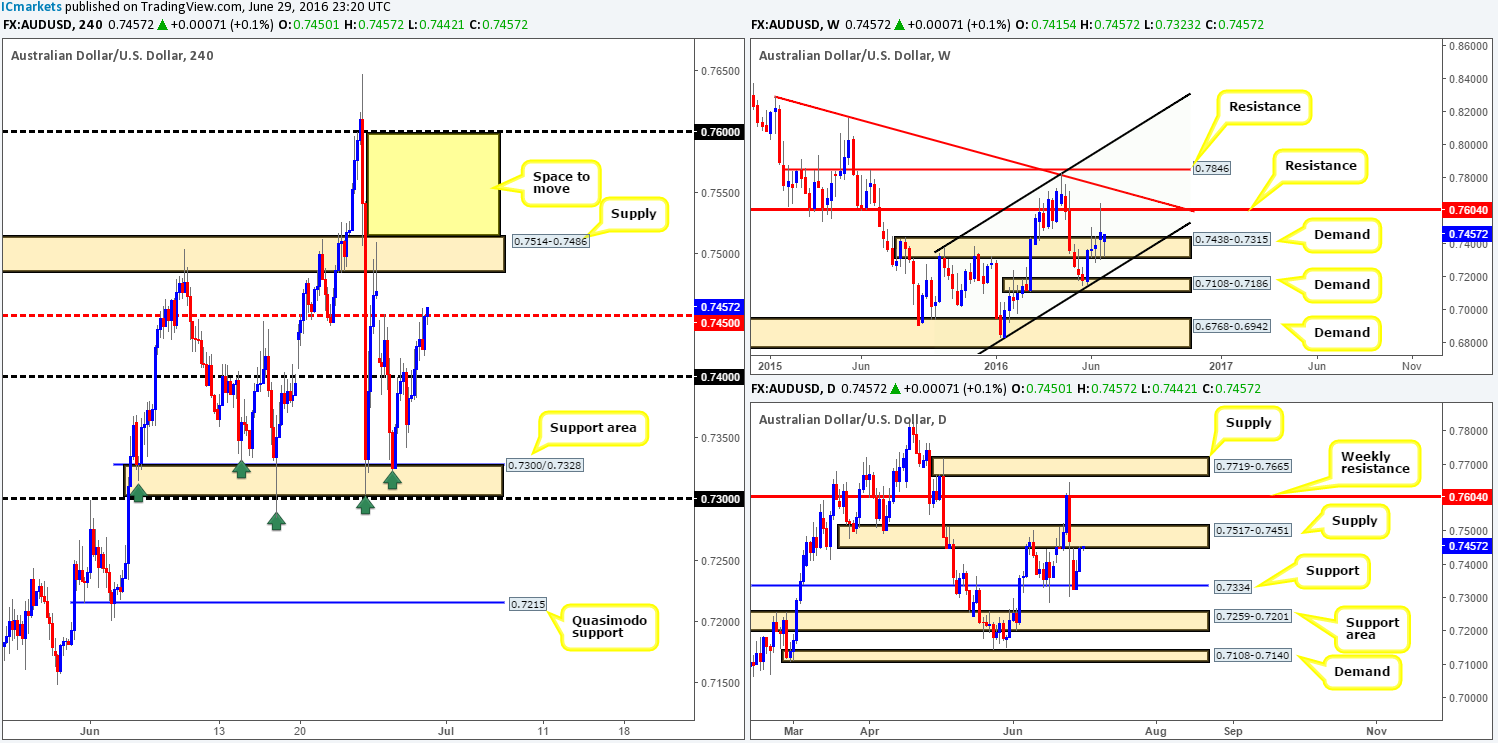
Levels to watch/live orders:
- Buys: Watch for price to consume H4 supply at 0.7514-0.7486 and look to trade any retest seen thereafter (lower timeframe confirmation required).
- Sells: Flat (Stop loss: N/A).
USD/JPY:
Beginning with the weekly timeframe this morning, USD bids have so far remained consistent following the rebound off of the weekly support penciled in at 101.32. On top of this, further buying from current price is possible according to the weekly chart as resistance does not come into view until we reach 103.22.
Despite weekly price showing room for a move higher, daily action is still seen loitering around the 102.79 band – a daily resistance that has significant history. According to the weekly picture, a break above this line could take place which would, as far as we can see, open the gates for price to challenge daily supply registered at 103.50-103.89 (positioned just above the current weekly resistance line).
During the course of yesterday’s sessions on the H4 chart, buyers found support around the 102.30 mark going into the early hours of European trading. This propelled the pair north, reaching highs of 102.93. This morning’s action, nevertheless, has rallied to connect with the 103 handle, which, as you can see, has so far responded firmly.
Our suggestions: Put simply, we’re going to be looking for lower timeframe sell entries between the 103 handle and the small H4 resistance area at 103.50-103.60 (green box) today, as let’s not forget that this area also houses the aforementioned weekly resistance line. A suitable entry would be either a break of a demand followed by a subsequent retest, a trendline break/retest or simply a collection of well-defined selling wicks around the higher timeframe area. We would also advise being conservative with your stop by placing it above the H4 supply zone since this will give the trade room to breathe.

Levels to watch/live orders:
- Buys: Flat (Stop loss: N/A).
- Sells: 103/103.50-103.60 [Tentative – confirmation required] (Stop loss: dependent on where one confirms this area).
USD/CAD:
Bolstered by a strong rally over in the oil market, the USD/CAD pair tumbled over 90 pips lower throughout yesterday’s sessions, surpassing the key 1.30 level and clocking a low of 1.2931 by the close. Technically, this sell-off should not come as much of a surprise since the Loonie has been trading from both a weekly supply at 1.3295-1.3017, and a daily supply drawn from 1.3218-1.3086.
Our suggestions: With weekly bears now dominating and daily price recently closing beyond daily support at 1.2970 (now acting resistance), this market could, according to the daily timeframe, stretch down as far as daily demand seen at 1.2653-1.2753. However, thanks to the recent selling, H4 action is seen trading just ahead of H4 support at 1.2911, which is positioned just above the 1.29 handle. Therefore, selling this market will only be possible for us on a close below 1.29.
Should this come to fruition today, we’d also require price to retest 1.29 as resistance along with a lower timeframe sell signal to avoid being whipsawed. For those who agree with our approach, you may want to check out the top of this report for a list of the lower timeframe entry techniques that we use.
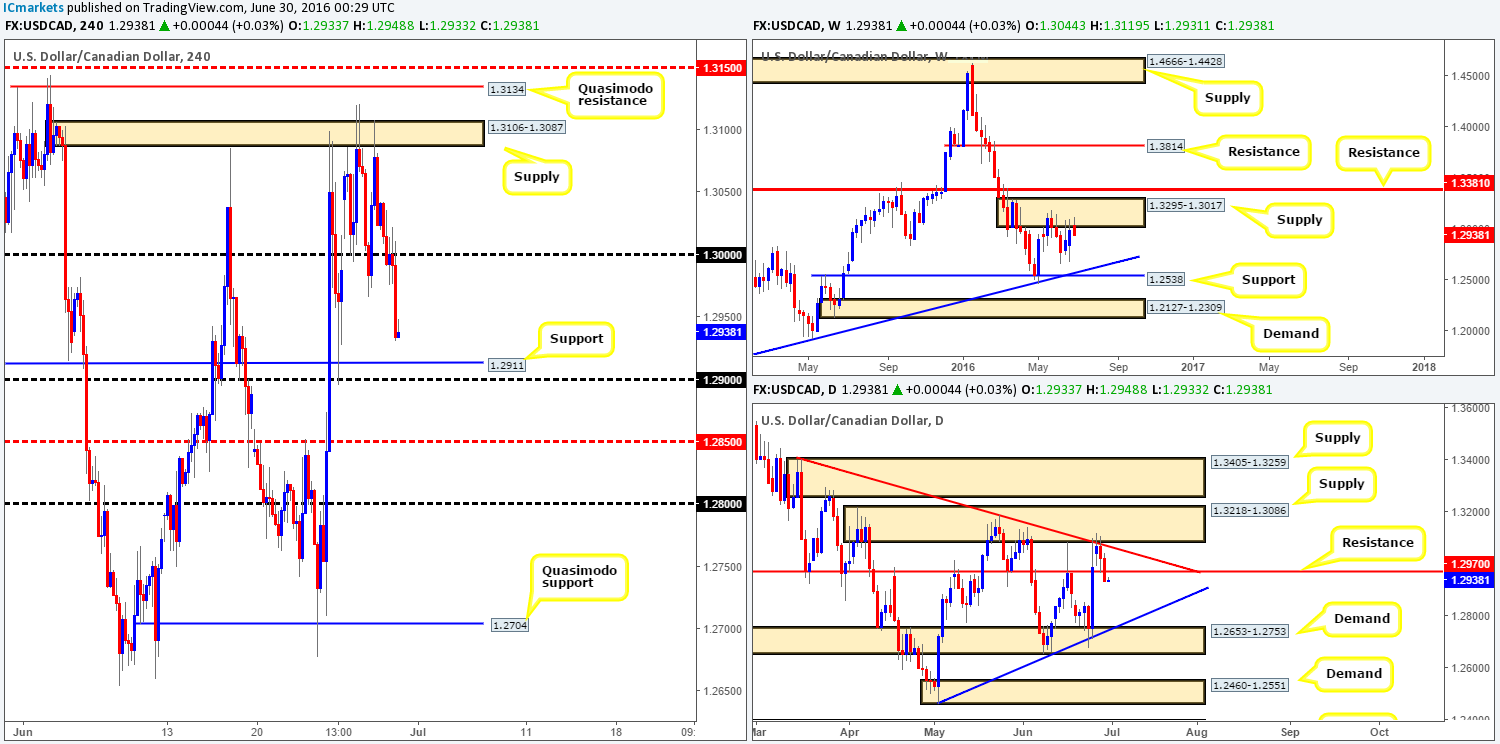
Levels to watch/live orders:
- Buys: Flat (Stop loss: N/A).
- Sells: Watch for price to consume the 1.29 handle and look to trade any retest seen thereafter (lower timeframe confirmation required).
USD/CHF:
Weekly movement shows that the Swissy remains bid following last week’s bullish move from just above weekly support at 0.9508. In the event that the buyers remain supportive of this market, there’s very little resistance ahead until price connects with weekly supply coming in at 1.0092-0.9928. In support of the weekly chart, daily price is currently retesting daily support at 0.9785, and similar to the weekly timeframe, shows room to appreciate up to 0.9900 (located just below the current weekly supply base).
Over on the H4 chart, however, the buyers and sellers are currently seen battling for position around the 0.98 handle, which was a number we were initially looking to go long from yesterday. Our team has still not given up on this level given the strong bullish tone coming in from the higher timeframes (see above)
Our suggestions: Ideally, we want price to trade above 0.98 today as this will, as far as we can see, clear the path north up to H4 resistance at 0.9862, followed closely by the 0.99 hurdle (not only a round number but also a clear daily resistance). Buy trades above 0.98 are only possible for us with the backing of a lower timeframe buy signal. This could be in the form of either a break of supply followed by a retest, a trendline break/retest or simply a collection of well-defined buying tails off of 0.98.

Levels to watch/live orders:
- Buys: 0.98 region [Tentative – confirmation required] (Stop loss: dependent on where one confirms this area).
- Sells: Flat (Stop loss: N/A).
DOW 30:
An unrelenting squeeze to the upside took place yesterday, consequently taking out H4 resistance at 17600 (now acting support) during its onslaught. It was only once price jabbed into H4 resistance at 17769 have we seen this market print a bearish candle. With that in mind, here is what we see right now:
- Weekly price is, thanks to yesterday’s round of buying, trading above a weekly resistance area coming in at 17446-17606. If this zone holds as support there’s little resistance, as far as we can see, to stop prices from continuing to rally north up to the weekly resistance area at 18365-18158.
- Down on the daily chart there is space for this market to continue on its northerly trail up to at least the daily Quasimodo resistance at 18018, followed closely by the daily resistance area at 18186-18117.
Our suggestions: In light of the above points, selling this market is no longer attractive. With that being said, our attention is now focused on a break above the current H4 resistance line. Assuming this does come into view and price retests this barrier as support, a long trade (with lower timeframe confirmation – see the top of this report) is possible, targeting the H4 Quasimodo resistance line at 17946, followed closely by the daily Quasimodo resistance line at 18018.

Levels to watch/live orders:
- Buys: Watch for price to consume H4 resistance at 17769 and look to trade any retest seen thereafter (lower timeframe confirmation required).
- Sells: Flat (Stop loss: N/A).
Gold:
In recent trading, we can see that the yellow metal extended its bounce from H4 support at 1310.3 to highs of 1327.6. However, it was around this point, the US open, that we saw the tables begin to turn as sellers drove prices down to lows of 1316.1 by the close. Although the current H4 support barrier is located nearby the top-side of weekly demand at 1307.4, there’s still a good chance gold will drop lower in order to cross swords with daily support drawn from 1301.5, since the H4 support line at 1310.3 has been visited twice now. Therefore, we’ll pass on looking for buys from here today and concentrate on the daily support barrier below at 1301.5 for possible long opportunities.
Our suggestions: Place an alert around the current daily support line. In the event that it is triggered, we’d advise looking for lower timeframe buying opportunities around this region, targeting the underside of the current H4 support (which will be resistance at that time). For those who are not sure on how to enter down on the lower timeframes, please see the top of this report for a list of techniques we use.

Levels to watch/live orders:
- Buys: 1301.5 region [Tentative – confirmation required] (Stop loss: dependent on where one confirms this area).
- Sells: Flat (Stop loss: N/A).


