
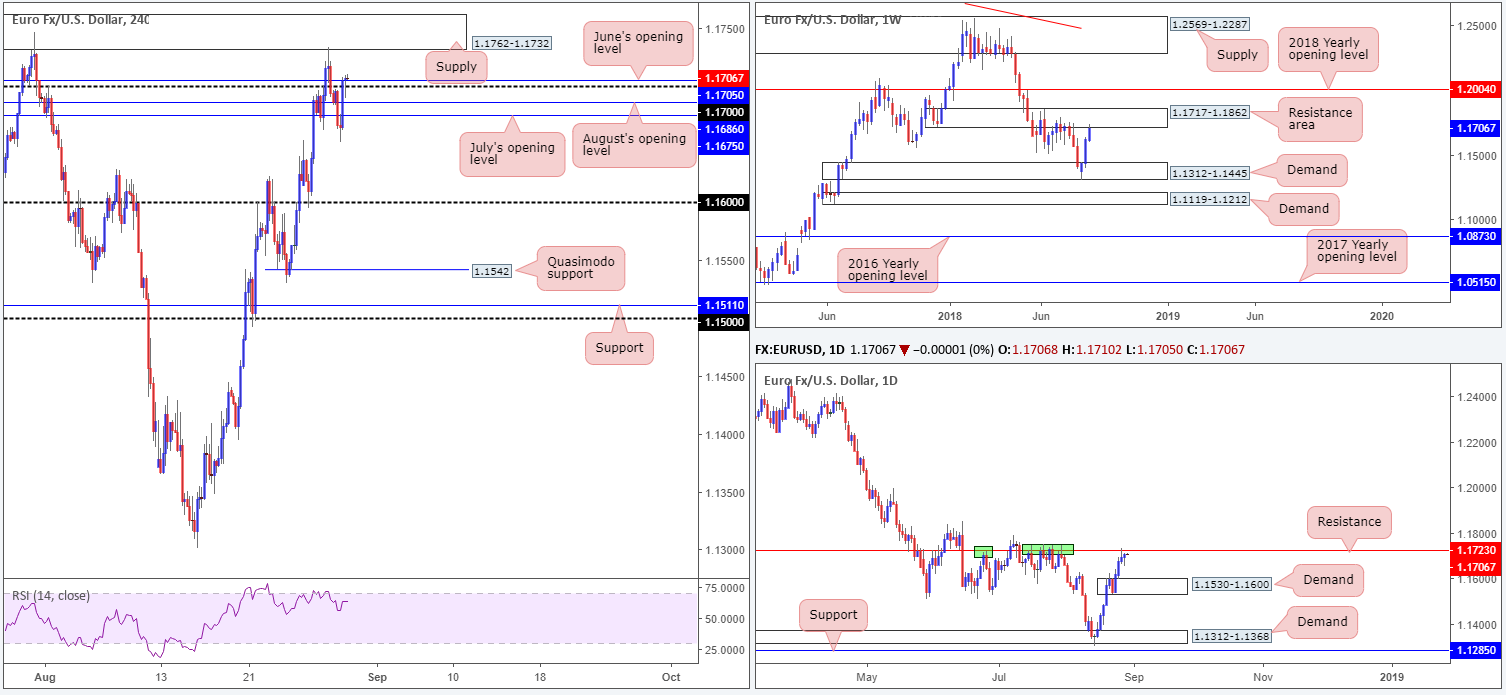
EUR/USD:
Risk appetite elbowed its way back into the spotlight on Wednesday, pressuring the greenback to lower ground and pulling the EUR/USD back above 1.17. Yesterday’s optimism largely came about following news that EU’s chief negotiator Barnier is ready to offer the UK a partnership arrangement no other 3rd party has.
As can be seen on the H4 chart this morning, the single currency traded as low as 1.1652 during Europe’s morning session, though printed a swift comeback in the early hours of US trading to highs of 1.1710. Note the closing H4 candle took shape in the form of a bullish pin-bar pattern that not only closed above June’s opening level at 1.1707, but also retested 1.17 as support. This firmly places supply at 1.1762-1.1732 in the firing range today.
The technical story over on the bigger picture, however, shows weekly activity shaking hands with a resistance area plotted at 1.1717-1.1862, along with daily price hovering just south of a resistance level coming in at 1.1723.
Areas of consideration:
Seeing as how both weekly and daily price are trading off clear resistances at the moment, buying the break/retest of 1.17 is not considered a high-probability setup as you’d effectively be buying into higher-timeframe sellers. Instead, the H4 supply at 1.1762-1.1732 is likely of interest to many for shorts this morning (positioned 10 pips above the current daily resistance and seen within the lower limits of the weekly resistance area).
Aggressive traders will probably be looking to enter short around the lower edge of the supply with stop-loss orders tucked a few pips above the upper edge. Conservative traders, on the other hand, may want to consider waiting and seeing if H4 price (or on the lower timeframes if you prefer) forms a bearish candlestick signal prior to pulling the trigger. Stop-loss orders can then be positioned either above the candlestick extreme or beyond the upper edge of supply.
Today’s data points: German prelim CPI m/m; Spanish flash CPI y/y; German Buba President Weidmann speaks; US core PCE price index m/m.
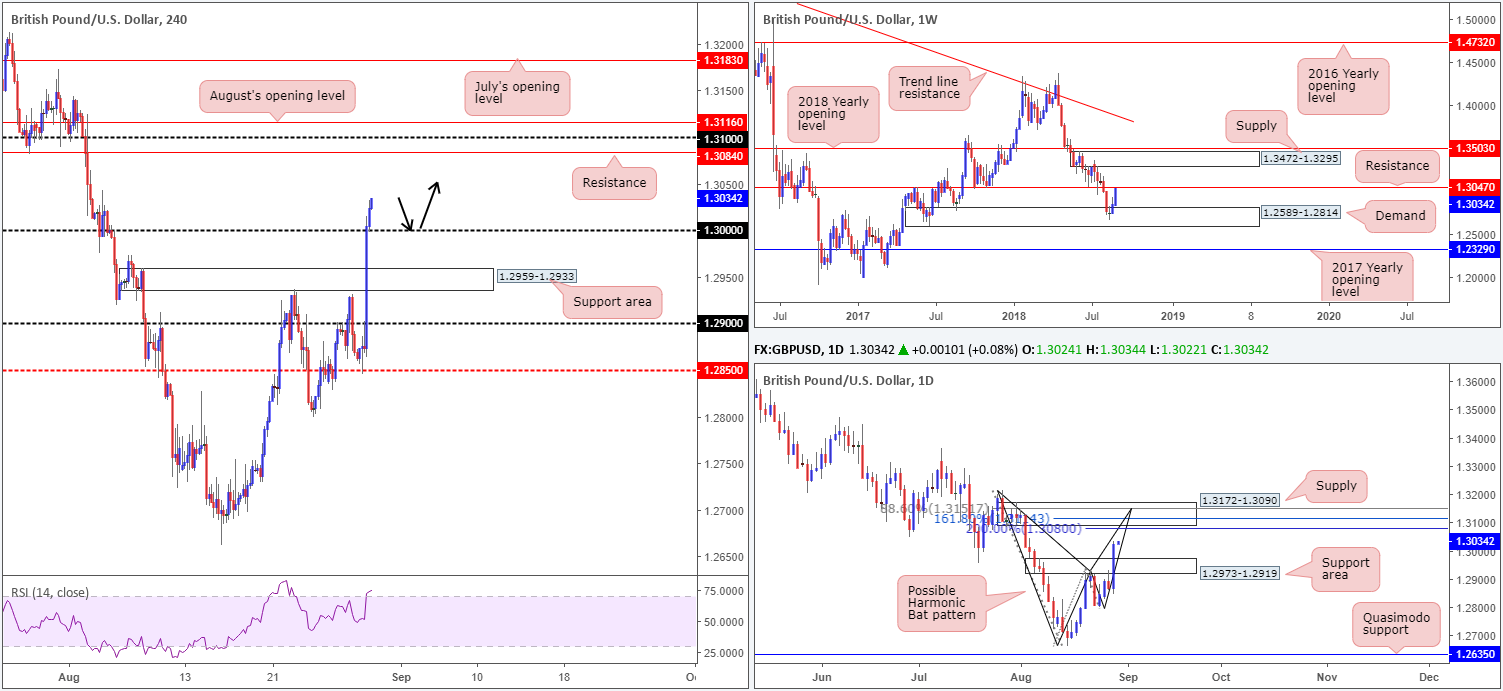
GBP/USD:
The British pound launched itself north on Wednesday, up 1.21% on the day, as EU’s chief Brexit negotiator Barnier announced the EU is ready to offer the UK a partnership arrangement no other 3rd party has.
While yesterday’s optimism saw a number of H4 technical resistances consumed, including the key figure 1.30, and shows room to possibly stretch as far north as resistance at 1.3084 today, both weekly and daily price are seen nearing critical resistances. Weekly movement, thanks to yesterday boost, is seen within striking distance of a key resistance level penciled in at 1.3047. A break beyond this weekly barrier has daily supply at 1.3172-1.3090 to target. Aside from this zone being considered strong supply, it also converges with a possible harmonic bat completion.
Areas of consideration:
A firm retest of 1.30 as support (ideally in the shape of a bullish candlestick signal) could be something to consider for possible longs today. Be that as it may, though, one would have to be prepared to reduce risk to breakeven and possibly take some profits off the table ahead of weekly resistance mentioned above at 1.3047. A break of this level has the H4 resistance at 1.3084 to target, followed by the underside of daily supply at 1.3090 and then the 1.31 handle/August’s opening level at 1.3116 seen on the H4 timeframe.
Today’s data points: US core PCE price index m/m.
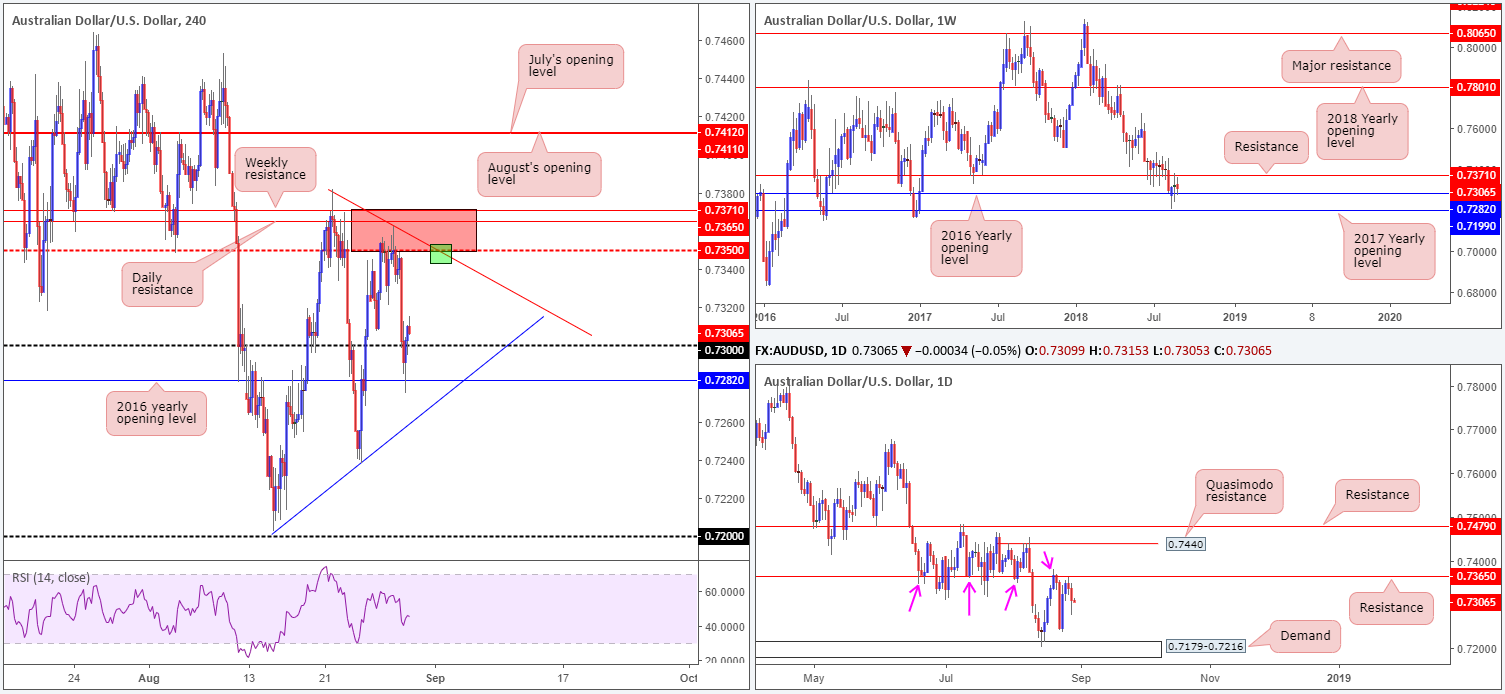
AUD/USD:
As expected, the AUD/USD held ground within the red H4 zone seen at 0.7371/0.7350 on Wednesday (comprised of a weekly resistance level at 0.7371, a daily resistance level at 0.7365 and a H4 mid-level resistance at 0.7350). The move lower from this zone was swift, momentarily surpassing the 0.73 handle on the H4 timeframe and crossing swords with the 2016 yearly opening level at 0.7282 (plotted on the weekly timeframe), ending the day a couple of pips back above 0.73. Well done to any of our readers who managed to jump aboard this bearish train!
Weekly price action remains tightly confined between resistance at 0.7371 and the aforementioned 2016 yearly opening level. Daily resistance at 0.7365 continues to prove itself a worthy contender. Further selling from current price has the demand area printed at 0.7179-0.7216 to target.
Areas of consideration:
The underside of the red H4 sell zone at 0.7350 remains of interest this morning for additional shorting opportunities, given we are trading back above 0.73. This time, however, a H4 trend line resistance (etched from the high 0.7381) is seen intersecting with this level (green area). To be on the safe side, though, placing stop-loss orders above the overall red sell zone (0.7371) is still recommended as this allows the trade some room to breathe.
Today’s data points: AUD private capital expenditures q/q and building approvals m/m; US core PCE price index m/m.
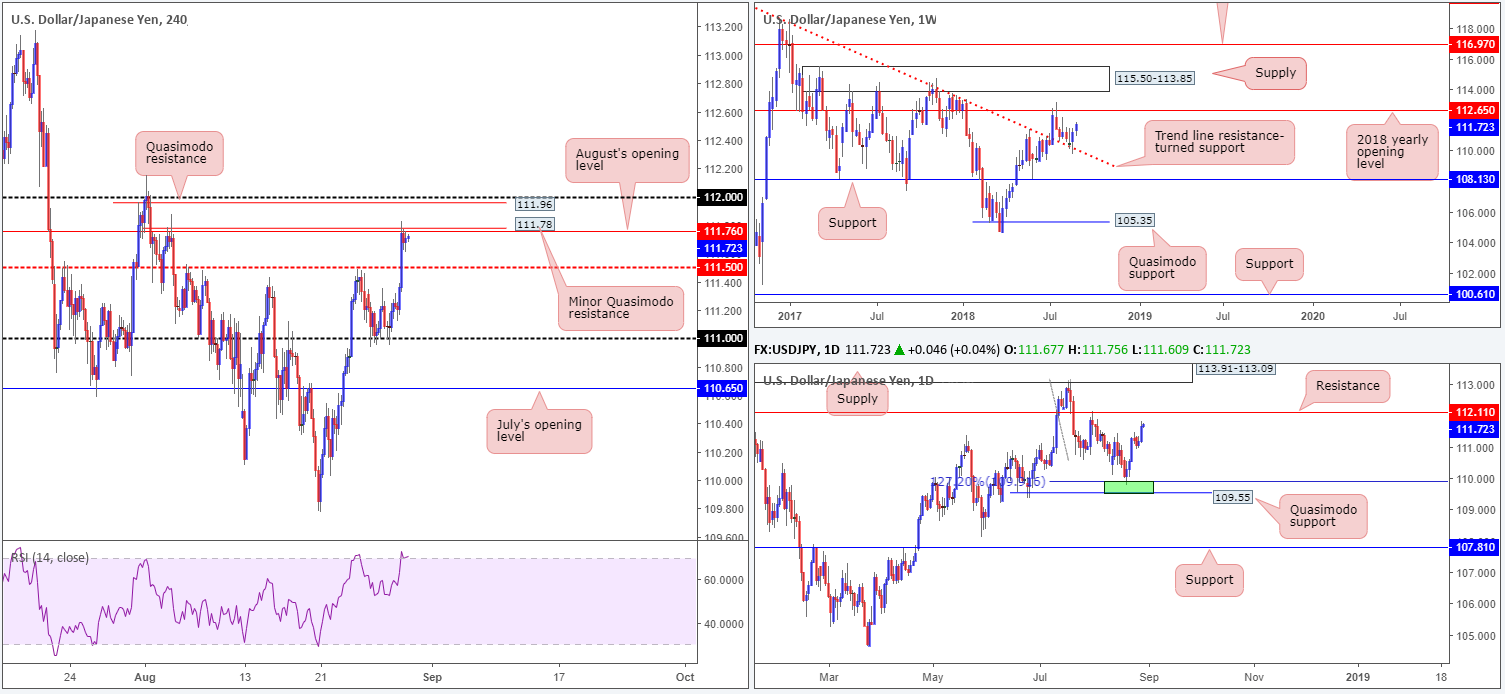
USD/JPY:
The USD/JPY extended its upside presence on Wednesday, as traders offloaded the safe-haven yen amid renewed market optimism following news that EU’s chief negotiator Barnier is ready to offer the UK a partnership arrangement.
The H4 candles firmly took out the mid-level resistance barrier at 111.50 yesterday, allowing price action to challenge August’s opening level at 111.76 and nearby minor Quasimodo resistance at 111.78. Directly above these levels, another Quasimodo resistance is seen at 111.96, followed closely by the 112 handle.
Weekly movement, as you can see, retested a trend line resistance-turned support (taken from the high 123.57) last week in the form of a strong bullish candle and is currently seen building on gains, as we write. Further buying from current price has the 2018 yearly opening level at 112.65 to target. In terms of the daily timeframe, the next obvious upside target on this scale does not come into view until resistance at 112.11.
Areas of consideration:
Those who entered long off the 111 handle without additional candlestick confirmation (this was a possible buy level highlighted in previous reports), well done for hanging in there – just incredible risk/reward!
Moving forward, selling from August’s opening level mentioned above on the H4 timeframe at 111.76 is chancy, given both weekly and daily action portend higher prices. According to the overall picture, shorts from the 112 handle are appealing as this level sits just beneath the current daily resistance level at 112.11. Waiting for additional candle confirmation before pulling the trigger, however, is something to consider. We say this due to the threat of weekly price pulling this market towards the 2018 yearly opening level at 112.65.
Today’s data points: US core PCE price index m/m.
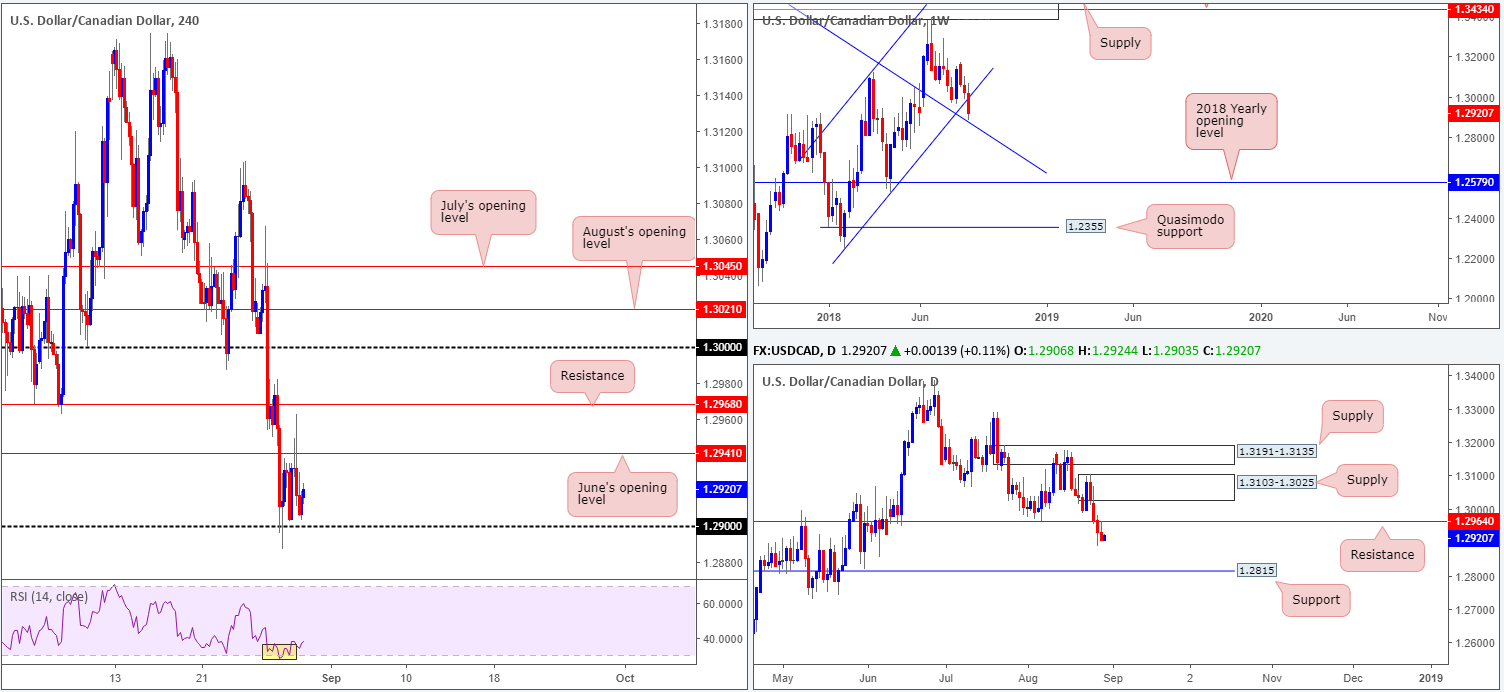
USD/CAD:
In recent sessions the USDCAD attempted to trade higher, though failed to sustain gains beyond June’s opening level seen on the H4 timeframe at 1.2941. The 1.29 handle, as you can see, also remains in the fold as a potential support this morning. A break of this level, nevertheless, would likely clear the river south towards 1.2836: a minor H4 Quasimodo support level not seen on the screen.
Daily price recently broke beneath support at 1.2964 and came within a few pips of retesting the underside of this base as resistance yesterday (missed it by less than 2 pips). Further selling on this scale has the support penciled in at 1.2815 in view. Meanwhile, up on the weekly timeframe, traders may have also noticed weekly price is seen trading within shouting distance of a trend line resistance-turned support (etched from the high 1.4689).
Areas of consideration:
In essence, we have weekly price suggesting longs may be the order of the day if we connect with the noted trend line support. On the other hand, though, daily price displays room to probe as far south as support mentioned above at 1.2815, while H4 action is seen bottoming ahead of the 1.29 handle. Based on this, it appears neither a long nor short is attractive at the moment.
Intraday, however, do keep eyes on June’s opening level mentioned above at 1.2941 and the 1.29 handle today. Both levels may offer traders an opportunity to trade for a bounce.
Today’s data points: US core PCE price index m/m; CAD GDP m/m.
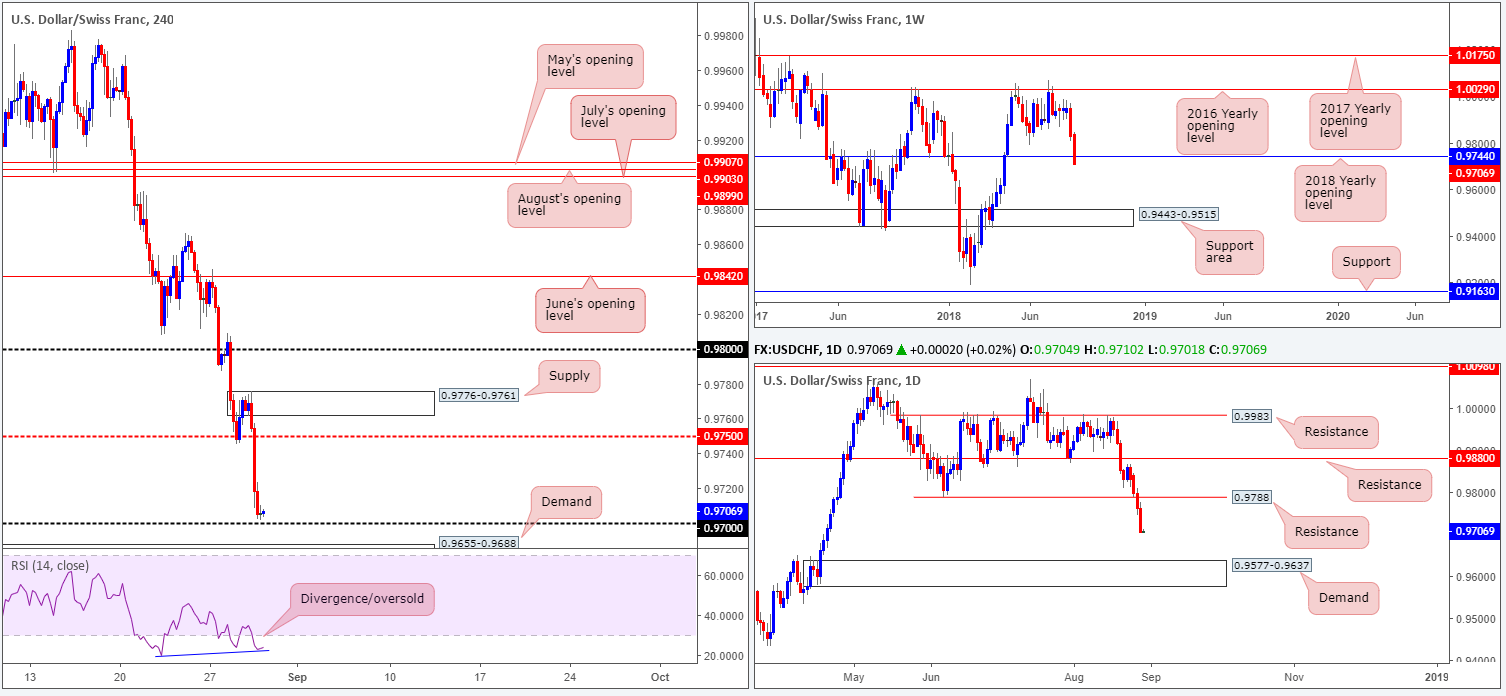
USD/CHF:
Using a top-down approach this morning, we can see weekly price recently engulfed the 2018 yearly opening level at 0.9744 in strong fashion. A decisive close beneath this area will likely indicate this market could be in for more selling in the near future, targeting as far south as the weekly support area coming in at 0.9443-0.9515. Meanwhile, on the daily timeframe, limited support is observed until we reach demand penciled in at 0.9577-0.9637.
Across the charts, H4 movement is seen trading just north of the 0.97 handle, shadowed closely by a H4 demand base at 0.9655-0.9688. Also worth noting on this scale is the H4 RSI indicator displaying divergence out of oversold territory.
Areas of consideration:
From a technical standpoint, both weekly and daily timeframes suggest selling may be the path to take. Unfortunately, though, H4 structure is positioned nearby supportive structures: the 0.97 handle and H4 demand at 0.9655-0.9688.
Should the USD/CHF attempt to pare losses today and retest the underside of 0.9750: a H4 mid-level resistance, shorting from this angle, or even the H4 supply zone seen above it at 0.9776-0.9761, could be an option.
Today’s data points: US core PCE price index m/m; CHF KOF economic barometer.
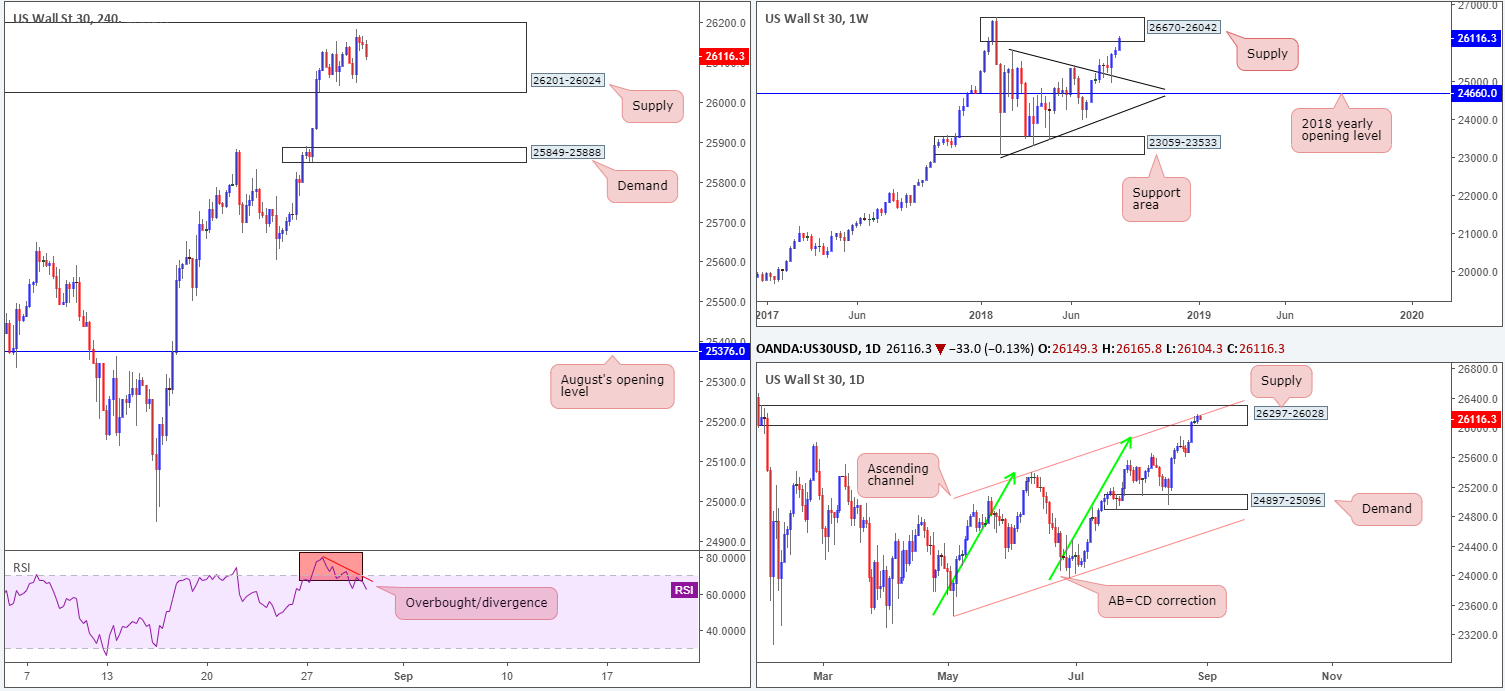
Dow Jones Industrial Average:
On the whole, the DJIA’s technical structure remains unchanged in terms of H4, daily and weekly timeframes this morning. US equities, although attempted to push higher yesterday, failed to break free from the walls of a H4 supply zone coming in at 26201-26024. Also worth remembering on the H4 scale is the RSI is seen displaying a strong overbought/divergence reading at the moment.
In addition to the current H4 supply, weekly and daily action also exhibit strong supply in play. Weekly price recently engaged with the lower edge of a supply at 26670-26042, following a strong retest off a trend line resistance-turned support (etched from the high 25807). In terms of daily supply seen at 26297-26028, not only does this zone intersect with a daily channel resistance (taken from the high 25399), it is also glued to the underside of the aforesaid weekly supply area.
Areas of consideration:
In light of the strong emphasis on supply from each timeframe, a pullback is likely on the cards we believe.
Should traders be looking to initiate short positions within the current H4 supply, waiting for H4 candle confirmation in the shape of a full or near-full-bodied bear candle before pulling the trigger is advised. Stops can be positioned either beyond the rejection candle’s wick or the H4 supply area itself, with the first area of concern (or take-profit zone) likely to reside around the H4 demand area seen at 25849-25888.
Today’s data points: US core PCE price index m/m.
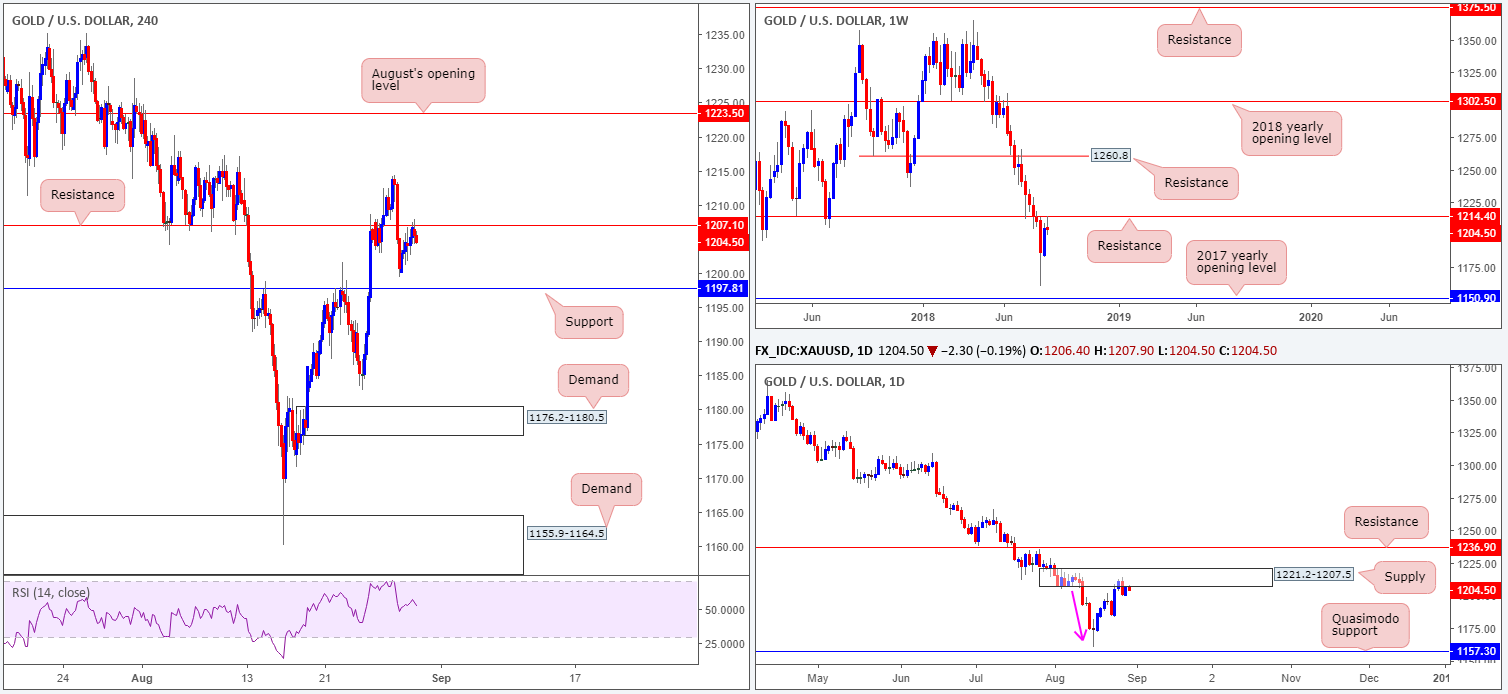
XAU/USD (Gold)
The higher-timeframe picture on bullion this morning remains pretty much unchanged. Weekly action recently retested the underside of resistance at 1214.4 and sold off nicely. On this timeframe, the current candlestick is portraying a reasonably nice-looking bearish pin-bar formation. Couple this with daily price trading from supply at 1221.2-1207.5 in the shape of a bearish engulfing pattern, we have ourselves some strong sellers in the mix we believe.
Over on the H4 timeframe, we can see the candles left support at 1197.8 unchallenged and modestly advanced towards resistance at 1207.1. As you can see, this level has held its ground so far. For those who read Wednesday’s report you may recall the team highlighting 1207.1 as a possible sell zone, targeting H4 support mentioned above at 1197.8 as the initial take-profit level. Well done to any of our readers who managed to get aboard this move.
Areas of consideration:
Aside from the short off of H4 resistance at 1207.1, additional selling opportunities beneath H4 support at 1197.8 are potentially in the offing today. A H4 close below here, followed up with a successful retest would, according to the overall picture, likely be sufficient enough to warrant shorts (stops best positioned beyond the retesting candle’s wick), targeting August 24 low at 1182.9, followed closely by H4 demand at 1176.2-1180.5.
The use of the site is agreement that the site is for informational and educational purposes only and does not constitute advice in any form in the furtherance of any trade or trading decisions.
The accuracy, completeness and timeliness of the information contained on this site cannot be guaranteed. IC Markets does not warranty, guarantee or make any representations, or assume any liability with regard to financial results based on the use of the information in the site.
News, views, opinions, recommendations and other information obtained from sources outside of www.icmarkets.com.au, used in this site are believed to be reliable, but we cannot guarantee their accuracy or completeness. All such information is subject to change at any time without notice. IC Markets assumes no responsibility for the content of any linked site. The fact that such links may exist does not indicate approval or endorsement of any material contained on any linked site.
IC Markets is not liable for any harm caused by the transmission, through accessing the services or information on this site, of a computer virus, or other computer code or programming device that might be used to access, delete, damage, disable, disrupt or otherwise impede in any manner, the operation of the site or of any user’s software, hardware, data or property.


