
A note on lower timeframe confirming price action…
Waiting for lower timeframe confirmation is our main tool to confirm strength within higher timeframe zones, and has really been the key to our trading success. It takes a little time to understand the subtle nuances, however, as each trade is never the same, but once you master the rhythm so to speak, you will be saved from countless unnecessary losing trades. The following is a list of what we look for:
- A break/retest of supply or demand dependent on which way you’re trading.
- A trendline break/retest.
- Buying/selling tails/wicks – essentially we look for a cluster of very obvious spikes off of lower timeframe support and resistance levels within the higher timeframe zone.
- Candlestick patterns. We tend to stick with pin bars and engulfing bars as these have proven to be the most effective.
We typically search for lower-timeframe confirmation between the M15 and H1 timeframes, since most of our higher-timeframe areas begin with the H4. Stops are usually placed 3-5 pips beyond confirming structures.
EUR/USD:
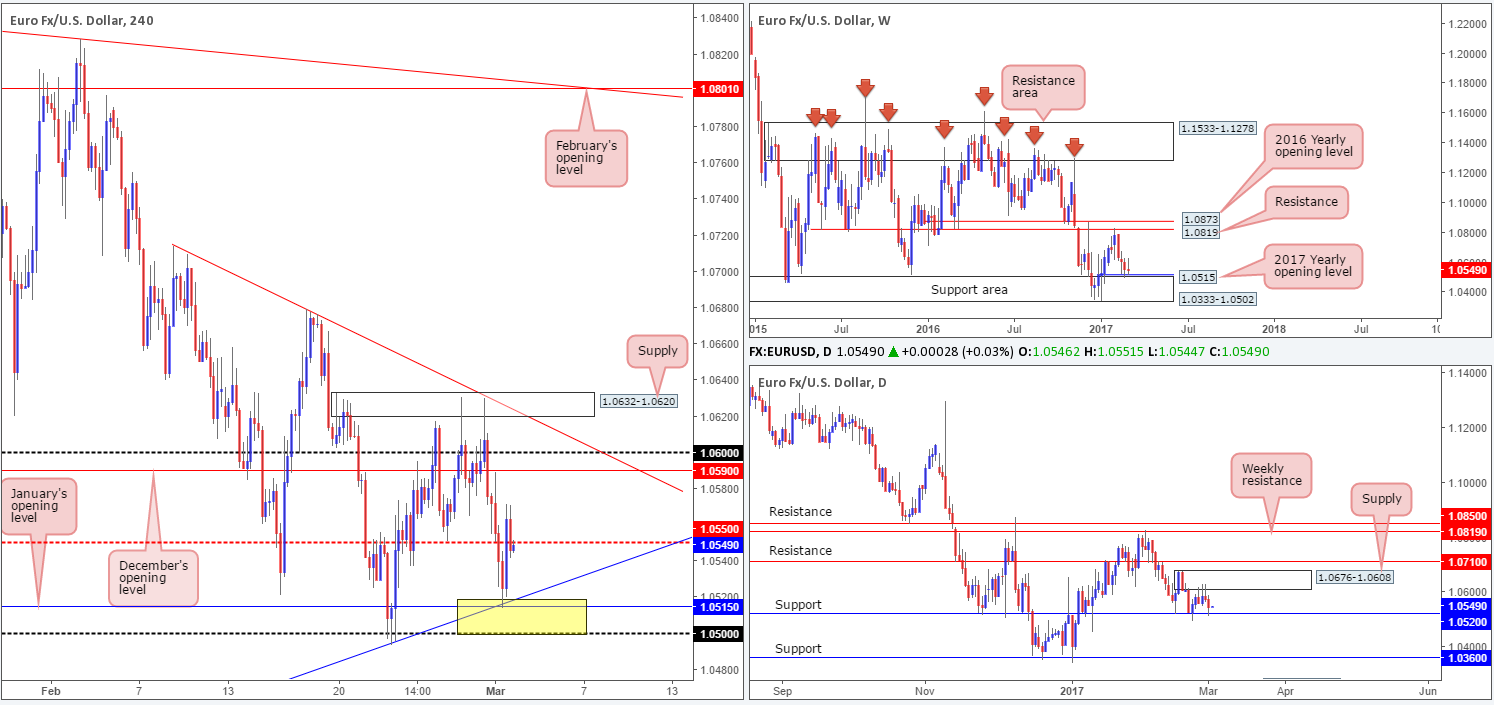
For those who read Wednesday’s piece you may recall that our desk underlined the 1.05/1.0520 area (yellow H4 rectangle) as a promising buy zone. The reason for selecting this base was due to the following converging structures: a round number at 1.05, a H4 trendline support taken from the low 1.0339, January’s opening level at 1.0515, daily support at 1.0520 and let’s not forget that all of this is further reinforced by the weekly support area at 1.0333-1.0502. As is evident from the H4 chart the zone held beautifully! Well done to any of our readers who managed to jump aboard this move.
Going forward, we can see that the H4 candles are now kissing the underside of the H4 mid-way number 1.0550. This level, in our humble opinion, is likely going to give way since there is not only a daily support currently in motion, but also a yearly opening level as well (see above). The next upside objective beyond this mid-way point is December’s opening level at 1.0590, shadowed closely by 1.06, and then the H4 supply at 1.0632-1.0620 that happens to merge with a H4 trendline resistance extended from the high 1.0714.
Our suggestions: Despite H4 price trading at a mid-level resistance, we would not be comfortable selling this market. A H4 close above this number, followed by a retest and a lower-timeframe confirming signal would, however, be something of interest. Ultimately, we’d be looking for either the following to take shape on the lower timeframes to confirm this line: an engulf of supply followed by a retest as demand, a trendline break/retest or simply a well-defined collection of buying tails printed around 1.0550. We typically search for lower-timeframe confirmation between the M15 and H1 timeframes, since most of our higher-timeframe areas begin with the H4. Stops are usually placed 3-5 pips beyond confirming structures.
Data points to consider: EUR CPI data at 10am. US Jobless claims at 1.30pm GMT.
Levels to watch/live orders:
- Buys: Watch for a H4 close above 1.0550 and look to trade any retest seen thereafter ([we would also advise waiting for a lower-timeframe confirming signal to form following the retest before looking to execute a trade] stop loss: dependent on where one confirms the level).
- Sells: Flat (stop loss: N/A).
GBP/USD:
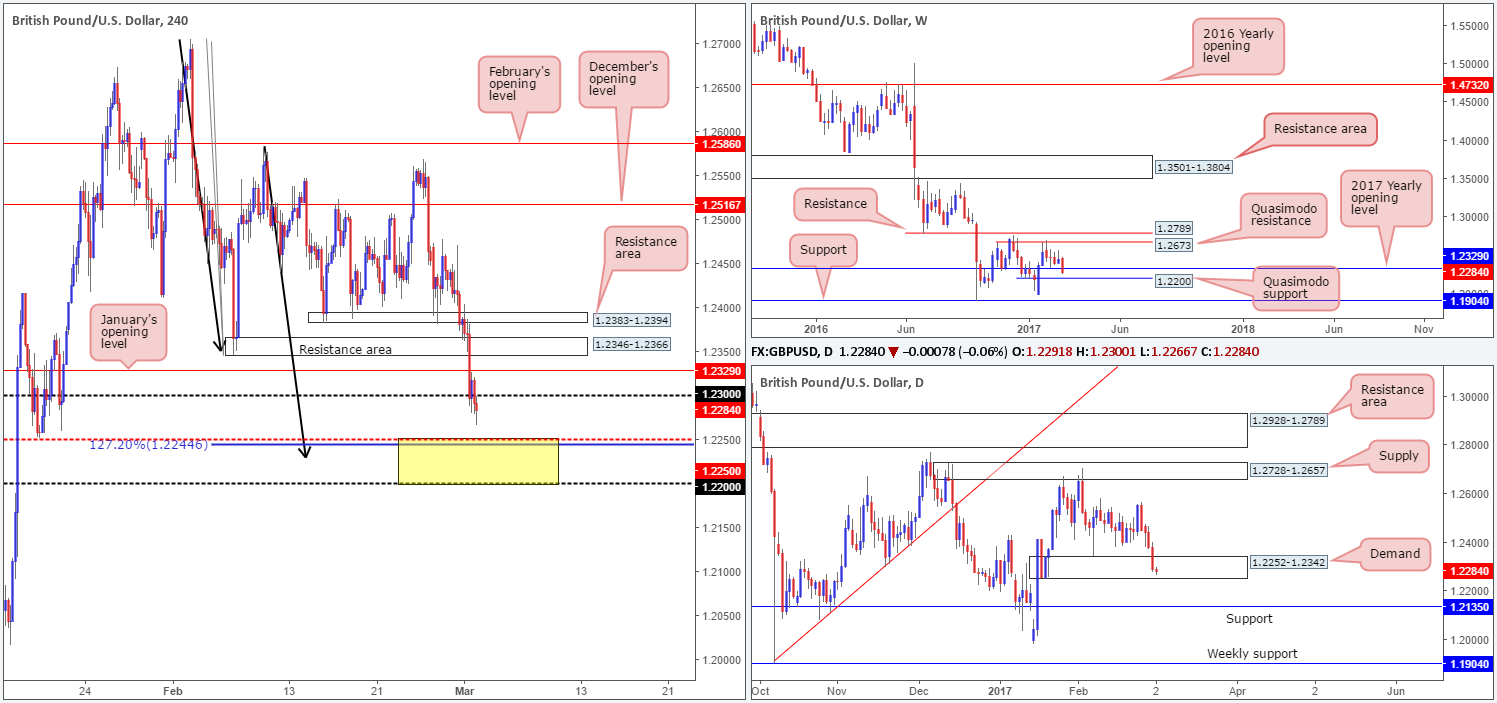
The pair, as you can see, sustained further losses during the course of yesterday’s sessions. After enduring and finally conquering the 1.23 handle in recent trade, the H4 mid-level support at 1.2250 is in firing range. What’s interesting here is the fact that this H4 level also fuses with a H4 AB=CD 127.2% Fib ext. at 1.2244 taken from the high 1.2706, and of course, the nearby 1.22 handle (yellow box). This – coupled with price also trading within the lower limits of a daily demand seen at 1.2252-1.2342, and also considering that 1.22 represents a weekly Quasimodo support, we believe the bulls may make an appearance from here today.
Our suggestions: Quite simply, watch for buyer intent to form within the above noted H4 yellow zone. We personally will want to see a reasonably sized H4 bull candle form, before pulling the trigger. Of course, this does not guarantee a winning trade, but what it will do is show buyer intent within a high-probability reversal zone.
Data points to consider: UK construction PMI at 9.30am. US Jobless claims at 1.30pm GMT.
Levels to watch/live orders:
- Buys: 1.22/1.2250 ([wait for a reasonably sized H4 bull candle to form before looking to pull trigger here] stop loss: ideally beyond the trigger candle).
- Sells: Flat (stop loss: N/A).
AUD/USD:
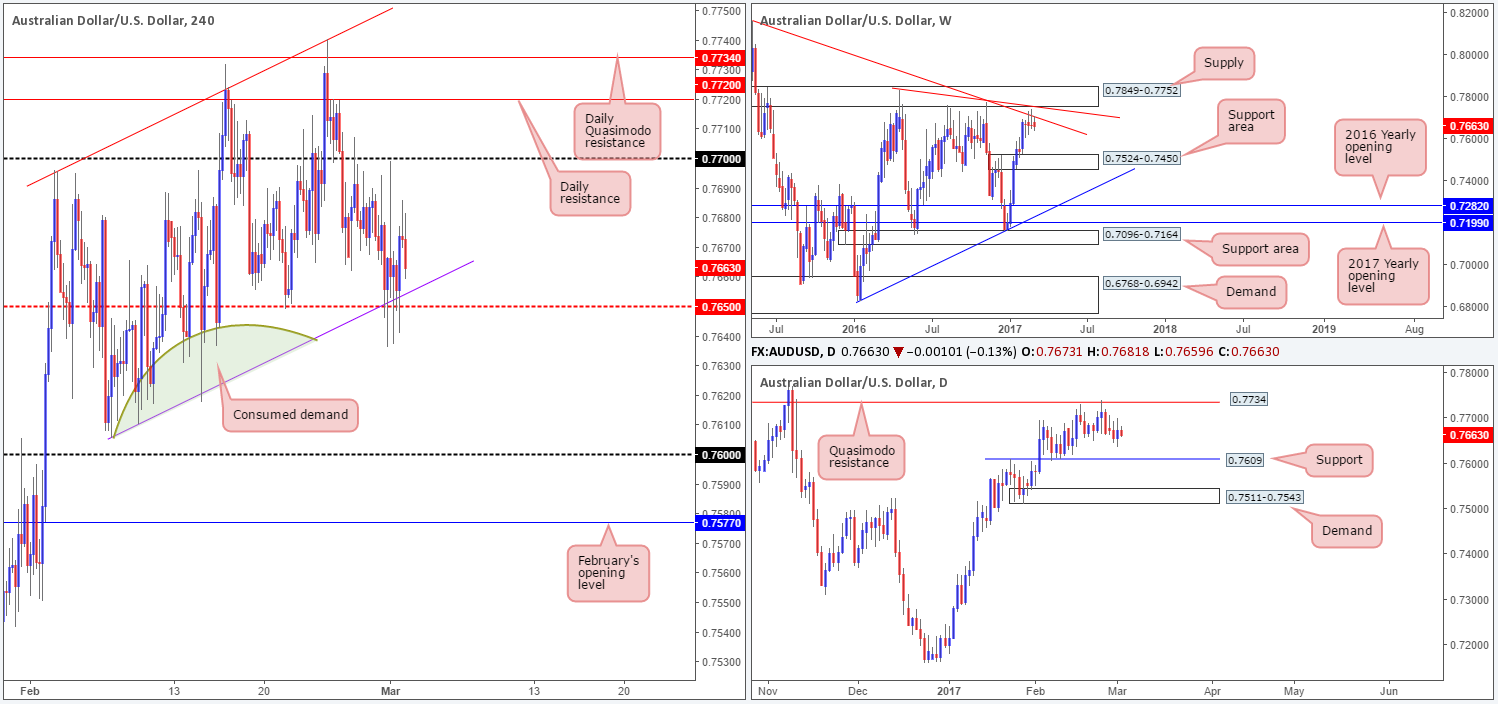
Bolstered by stronger-than-expected Aussie GDP and Chinese manufacturing data, the commodity-linked currency gravitated north to a high of 0.7699 in the early hours of yesterday’s session. As can be seen from the H4 chart, an array of H4 buying tails printed from the H4 mid-level support at 0.7650, and its intersecting H4 channel support line taken from the low 0.7605.
Despite this, we feel that this area is on the verge of giving way. Our reasoning lies within the higher-timeframe structures. Over on the weekly chart, price is currently selling off from a weekly trendline resistance stretched from the high 0.8163, and shows room to trade as far down as the weekly support area drawn from 0.7524-0.7450. Along the same vein, daily structure indicates that there is space to continue selling off down to a daily support level coming in at 0.7609. Also noteworthy on the H4 chart is that we see very little active demand to left of current price beyond the H4 0.7650 line (see green arc).
Our suggestions: With the above points in mind, our desk will not be looking to buy from the 0.7650 region today. Instead, we’ll be watching for a H4 close beyond this number. Should this be followed up with a retest and a reasonably sized H4 bearish candle, we’ll look to short, targeting the 0.76 region (which, as we’re sure you’re aware by now, also represents the daily support level mentioned above).
Data points to consider: Australian housing data and trade balance at 12.30am. US Jobless claims at 1.30pm GMT.
Levels to watch/live orders:
- Buys: Flat (stop loss: N/A).
- Sells: Watch for a H4 close below 0.7650 and look to trade any retest seen thereafter ([we would also advise waiting for a reasonably sized H4 bear candle to form following the retest before looking to execute a trade] stop loss: ideally beyond the trigger candle).
USD/JPY:
Try as it might, the USD/JPY bulls couldn’t muster enough strength to breach the 114 handle going into yesterday’s US session, and as a result, pulled back to a low of 113.47. However, in recent hours the bulls managed to push to a high of 114.15, and are, at the time of writing, seen trading above 114.
Although the buyers look in good form at the moment, this momentum will likely diminish should price continue to rally beyond 114. Not only is there a reasonably strong H4 trendline resistance taken from the high 115.62 seen just above here, but there is also the daily resistance area coming in at 115.62-114.60 and a H4 mid-way resistance at 114.50 to contend with.
Our suggestions: On account of the above notes, we will be looking for shorting opportunities (lower-timeframe confirmation – see the top of this report) around the H4 mid-level resistance drawn from 114.50, which, as you can see, sits a mere 10 pips beneath the lower edge of the daily resistance area mentioned above.
Data points to consider: US Jobless claims at 1.30pm GMT.

Levels to watch/live orders:
- Buys: Flat (stop loss: N/A).
- Sells: 114.50 region ([wait for a lower-timeframe signal to form before looking to pull the trigger] stop loss: dependent on where one confirms the zone).
USD/CAD:
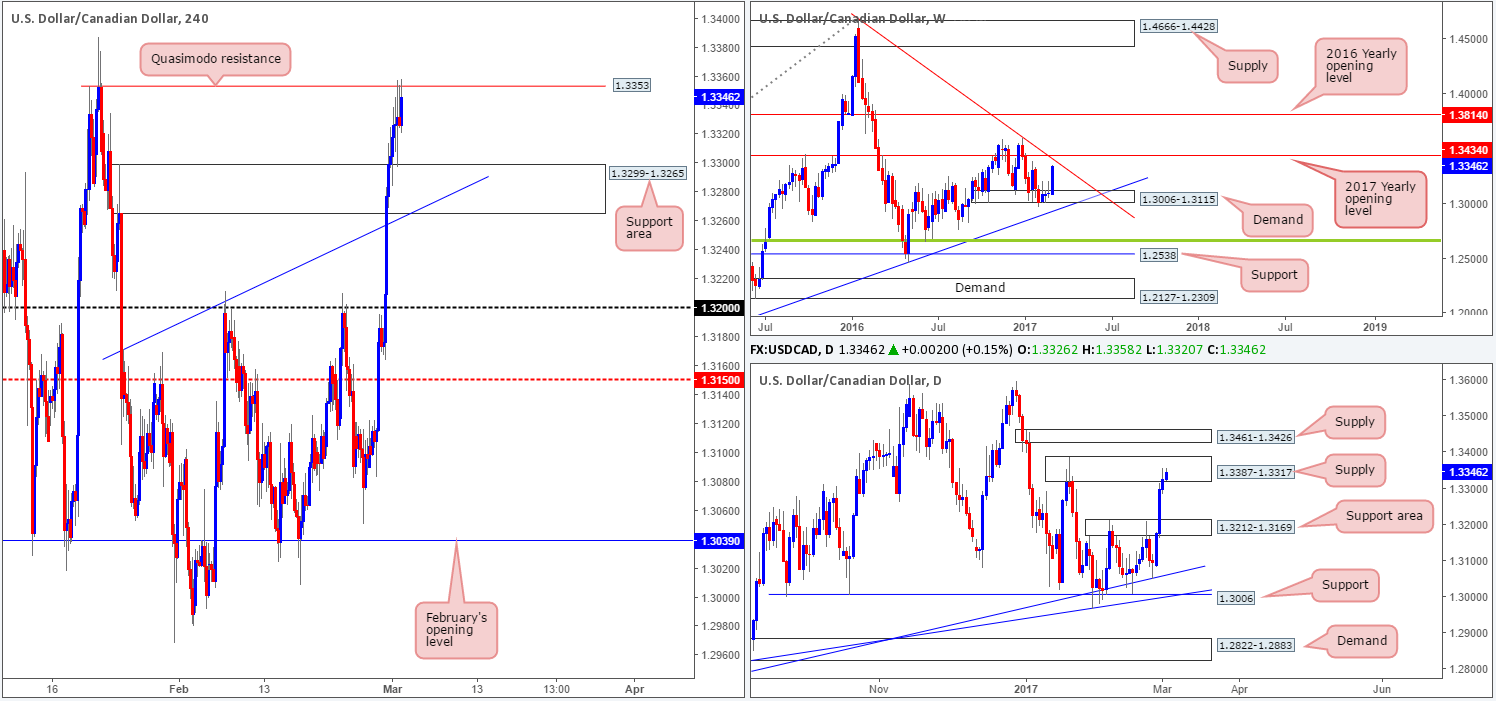
The USD/CAD rallied for a third consecutive day yesterday, resulting in price clipping the underside of a H4 Quasimodo resistance level at 1.3353. This barrier, as mentioned in Wednesday’s report, is firmly located within the walls of a daily supply zone coming in at 1.3387-1.3317.
While we believe the current H4 level could force this unit to test the nearby H4 support area at 1.3299-1.3265, it may be worth noting that the weekly chart shows room to rally up to 1.3434: a 2017 yearly opening level that happens to intersect with a weekly trendline resistance coming in from the high 1.4689.
Our suggestions: To take advantage of any selloff seen from the aforementioned H4 Quasimodo resistance line, we would strongly recommend waiting for at least a lower-timeframe confirming sell signal to form beforehand (see the top of this report).
Data points to consider: US Jobless claims at 1.30pm. Canadian GDP data at 1.30pm GMT.
Levels to watch/live orders:
- Buys: Flat (stop loss: N/A).
- Sells: 1.3353 region ([wait for a lower-timeframe signal to form before looking to pull the trigger] stop loss: dependent on where one confirms the zone).
USD/CHF:
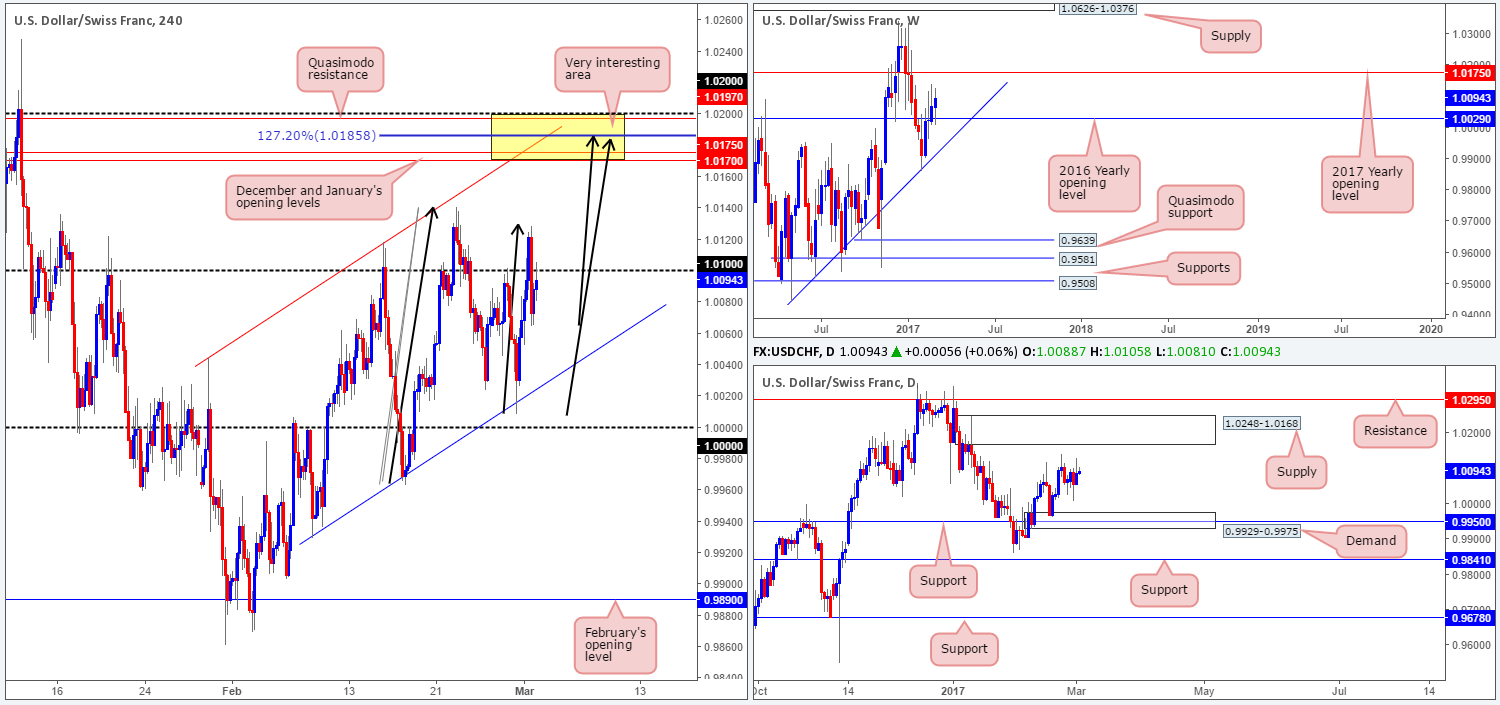
In recent sessions, the Swissy pair aggressively pushed through the 1.01 handle and tapped a high of 1.0129. The buyers, however, failed to sustain gains beyond this number and dropped to a low of 1.0065 going into the later hours of the US segment.
As of now, we see little reason to short the 1.01 level since there is a far more attractive area above (in yellow) at 1.02/1.0170.The zone comprises of the following converging structures: both December and January’s opening levels at 1.0170/1.0175, a potential H4 AB=CD 127.2% Fib ext. at 1.0185, another potential minor H4 AB=CD symmetrical formation completing also around the 1.0185 region (see black arrows), an upper H4 channel resistance line pegged from the high 1.0044, a H4 Quasimodo resistance at 1.0197, a 1.02 psychological handle and let’s not forget that all of this is seen housed within the daily supply zone coming in at 1.0248-1.0168.
Our suggestions: In light of this confluence, our team will, dependent on the time of day, look to sell from the H4 127.2% Fib ext. level with stops placed a few pips above 1.02.
Data points to consider: US Jobless claims at 1.30pm GMT.
Levels to watch/live orders:
- Buys: Flat (stop loss: N/A).
- Sells: 1.0185 region ([an area one could possibly trade at market] stop loss: 1.0205).
DOW 30:
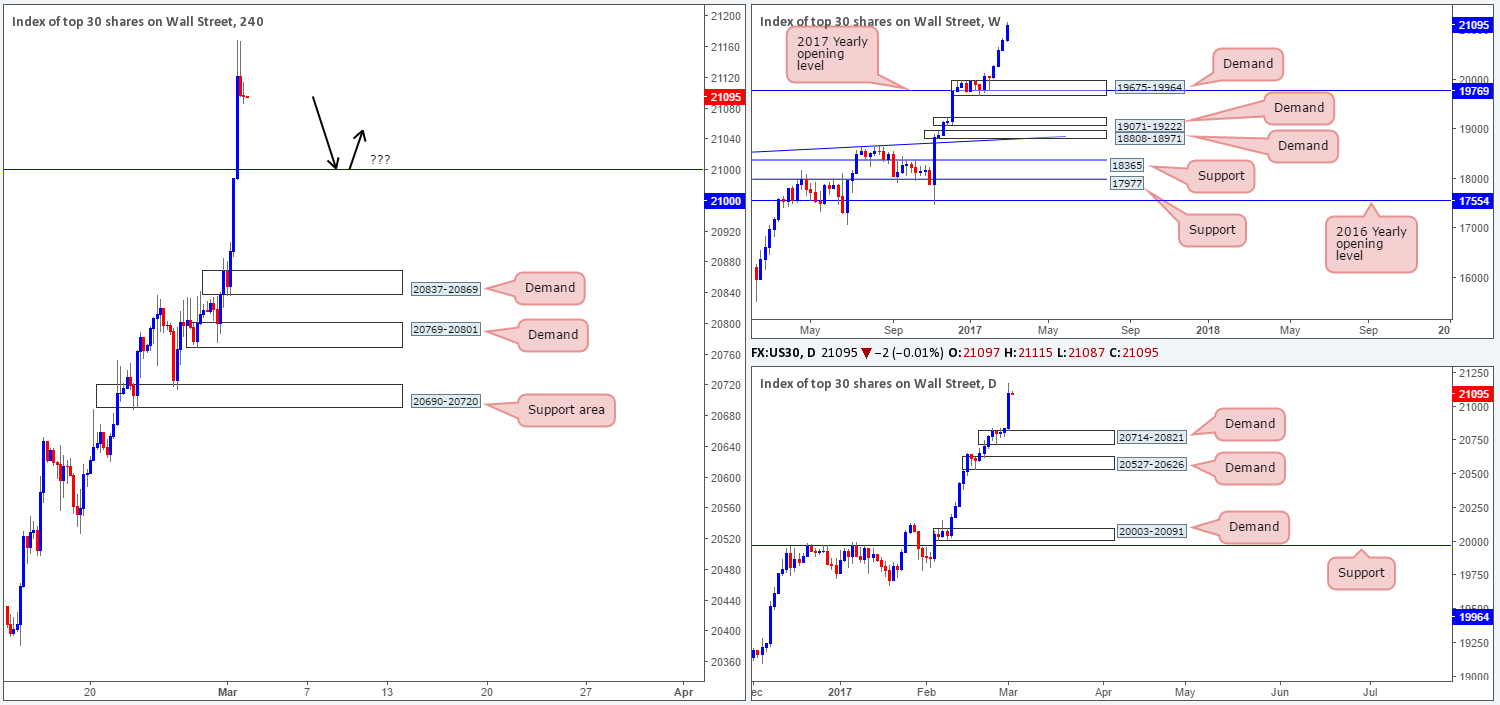
US equities surged over 250 points (open/close) yesterday, crossing the 21000 hurdle and tapping fresh record highs of 21170! The big question for us now is, where do we go from here? Well, given that there is absolutely no weekly resistance levels in sight, the best we can do for the time being is continue looking to ‘buy the dips’. The closest higher-timeframe area can be seen at 20714-20821: a daily demand zone.
Over on the H4 chart, the next downside support target can be seen at the 21000 mark. Although this zone boasts no higher-timeframe (structural) convergence, it is still a widely watched number in this market and thus could form a support! Therefore, it remains of interest to our desk today.
Our suggestions: Just to be clear here though, placing pending orders at 21000 is not advised, since there’s little stopping price from ignoring this area and heading to the H4 demand zone below at 20837-20869. Waiting for additional confirmation such as a lower-timeframe buy signal (see the top of this report) or a reasonably sized H4 bull candle is, at least in our opinion, the safer, more logical, path to take.
Data points to consider: US Jobless claims at 1.30pm GMT.
Levels to watch/live orders:
- Buys: 21000 region ([waiting for additional confirmation is advised before looking to execute a trade] stop loss: dependent on how one chooses to confirm the zone).
- Sells: Flat (stop loss: N/A).
GOLD:
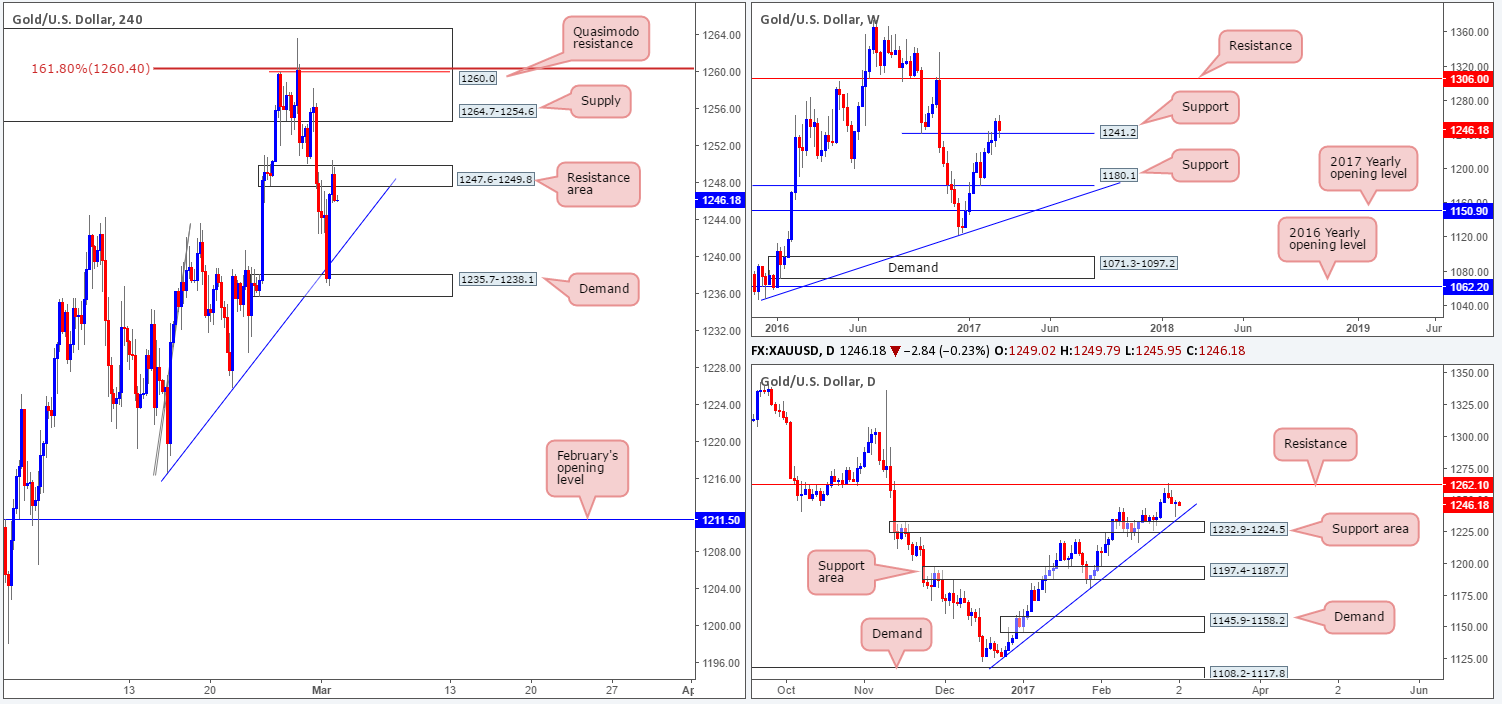
Coming in from the top this morning, we can see that price is currently retesting the weekly support level seen at 1241.2. Providing that the bulls are able to defend this line, this could lead to a move north up to weekly resistance pegged at 1306.0. Looking down to the daily candles, yesterday’s action printed a beautiful-looking daily bullish pin bar, which pierced into the above noted weekly support line. The next upside objective on this scale, nevertheless, stands at 1262.1: a daily resistance barrier. Swinging over to the H4 chart, H4 action is currently capped between a H4 ascending trendline support taken from the low 1216.5 and a H4 resistance area drawn from 1247.6-1249.8.
Our suggestions: Quite frankly, there is still not much room for the H4 candles to stretch their legs at present. A push above the 1247.6-1249.8 zone shows little room for maneuver given the overhead H4 supply at 1264.7-1254.6. A selloff from this zone has not only the H4 trendline support to contend with, but there’s also a H4 demand sitting nearby at 1235.7-1238.1. As such, in the absence of clearer price action our desk will humbly take a back seat today and look to reassess going into tomorrow’s session.
Levels to watch/live orders:
- Buys: Flat (stop loss: N/A).
- Sells: Flat (stop loss: N/A).


