
EUR/USD:
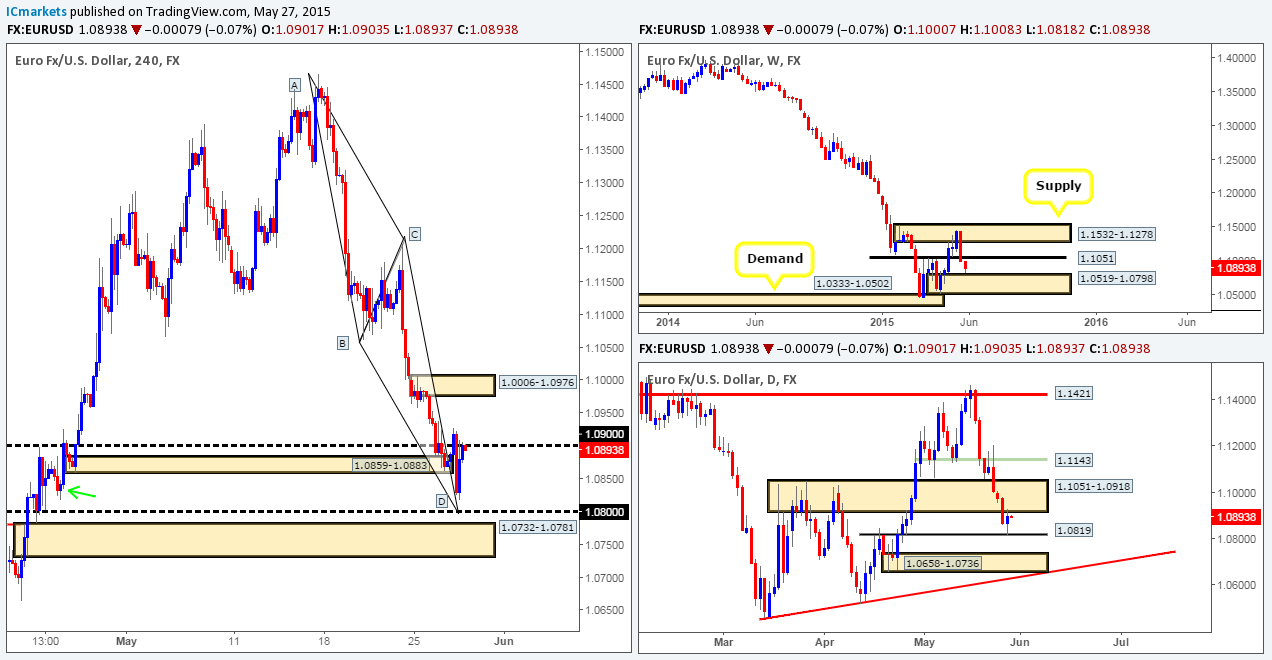
Weekly view: Recent events show that buying interest came into the market twenty or so pips from above a weekly demand area seen at 1.0519-1.0798.
Daily view: From this angle, we can see that the latest bullish activity likely stems from price reacting off of a minor daily swap level coming in at 1.0819, which has consequently forced price to connect with the lower limits of a daily swap zone positioned at 1.1051-1.0918.
4hr view: The 4hr timeframe shows that price initially attempted to trade higher from the 4hr demand area at 1.0859-1.0883 during the early hours of the European session, and at one point even managed to close above 1.0900. However, as you can see this buying came to an abrupt end when aggressive sellers pushed the Euro south during London’s morning session, consequently engulfing the current 4hr demand zone and attacking a 4hr demand area seen marked with a green arrow at 1.0818-1.0848. This was an area we initially considered insignificant – how wrong we were! The market rallied deep from within this zone back up to 1.0900, which will be a key level for us going in to today’s sessions.
A cut above this number, would, in effect, be our cue to begin watching for price to retest this level as support. Should this occur, we’d then begin looking for lower timeframe confirmation to potentially buy up to the 4hr supply area seen at 1.0006-1.0976 (seen deep within the aforementioned daily swap zone).
If1.0900 is respected as resistance, however, we could see price sell off down to 1.0800, or even the 4hr demand area seen just below it at 1.0732-1.0781 (located just above the aforementioned daily demand area), which also marks the completion point for an AB=CD pattern from the high 1.1465 – an absolutely beautiful area to be looking to go long from. With regards to selling from 1.0900 – even with lower timeframe confirming price action, this would be too risky for us since price is too close to weekly demand (see above) for out liking.
Levels to watch/live orders:
- Buys: 1.0800/ 1.0732-1.0781 [Tentative – waiting for confirmation here is recommended] (Predicative stop-loss orders seen at: dependent on where one confirms this area).
- Sells: Flat (Predicative stop-loss orders seen at: N/A).
GBP/USD:
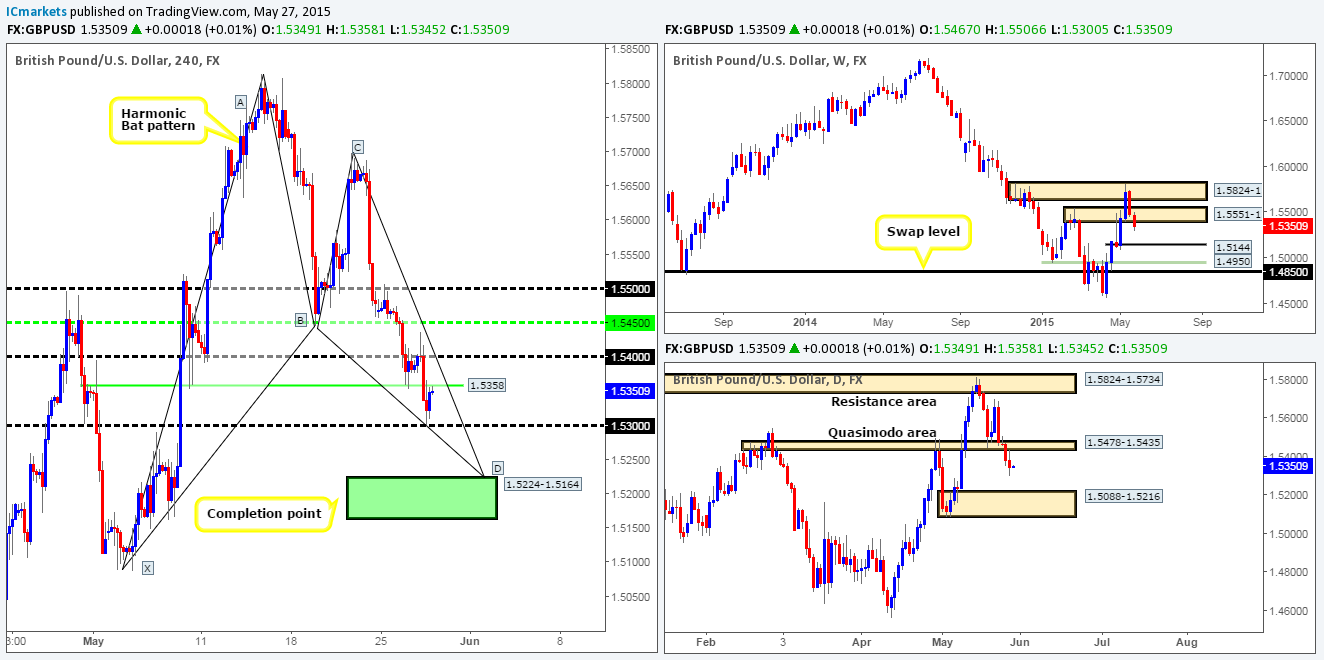
Weekly view: The weekly timeframe shows that price recently pushed below the weekly swap area coming in at 1.5551-1.5391. This has potentially opened the gates for further selling down to 1.5144 – a recent level where serious weekly buyers came into the market.
Daily view: Yesterday’s action saw price retest the recently broken daily Quasimodo swap area at 1.5478-1.5435 as resistance, and as a result continued to sell off. Providing that the sellers can continue with this tempo, we see very little reason why price will not cross swords with the daily demand zone seen just below at 1.5088-1.5216 (surrounds the weekly buy level 1.5144).
4hr view: During yesterday’s sessions, we can see price aggressively took out the 4hr Quasimodo swap barrier at 1.5358 and connected very nicely with the round number 1.5300, which was clearly enough to support a counter- attack back up to 1.5358.
At this point in time, we have no interest in buying this pair. There is just far too much 4hr resistance to chop through (1.5358/1.5400/1.5450/1.5500), and on top of that, price has just recently taken out higher-timeframe supportive structures (see above). Therefore, in our opinion, this is a sellers’ market at least until we reach the Harmonic Bat completion area seen in green at 1.5224-1.5164 (located around the upper limits of the aforementioned daily demand area). Does this mean we’d consider selling from 1.5358? For us personally, the simple answer is, no, unless of course we could find a lower timeframe entry that allowed us to use a small stop of around 15 pips. We would, however, consider selling the break and retest of 1.5300 though, at least until we reached the Harmonic reversal zone, which is the point where we’ll exit any shorts we may have and begin looking for confirmed (lower timeframe) longs.
Levels to watch/ live orders:
- Buys: Flat (Predicative stop-loss orders seen at: N/A).
- Sells: Flat (Predicative stop-loss orders seen at: N/A).
AUD/USD:
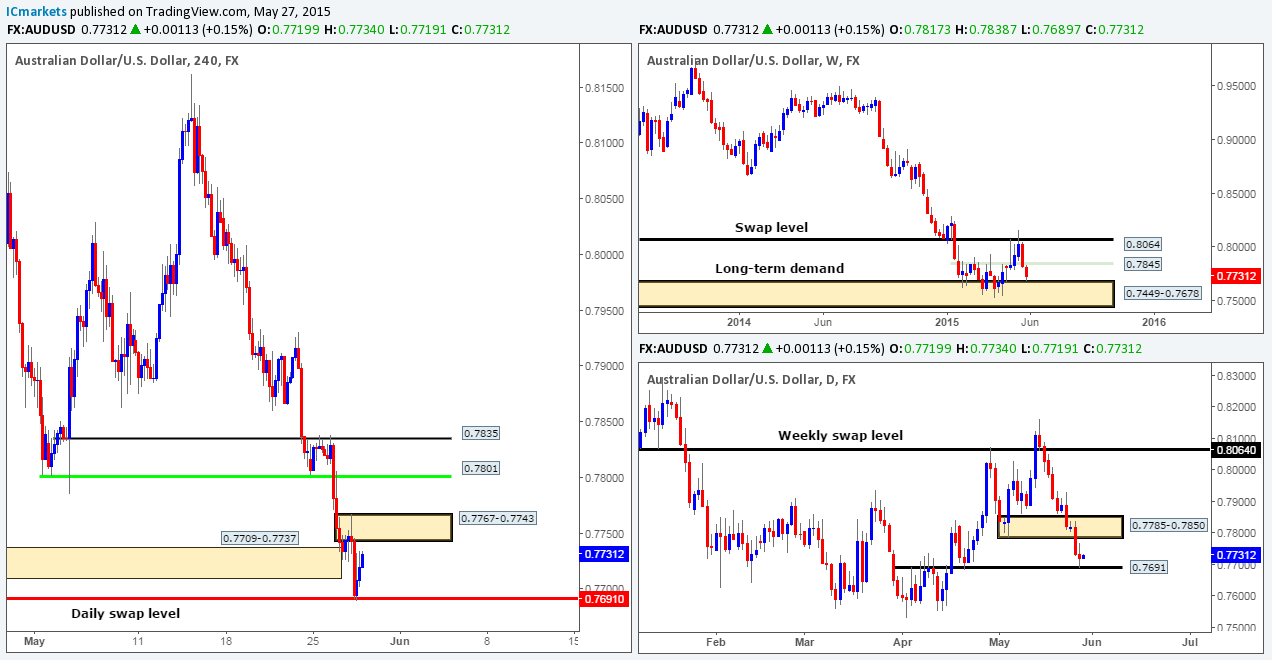
Weekly view: The weekly scale reveals that price recently came within ten or so pips to connecting with the weekly demand area seen at 0.7449-0.7678.
Daily view: The daily timeframe on the other hand, shows that the Aussie pair shook hands with a daily swap level coming in at 0.7691. The reaction from this zone, however, was not really much to get excited about in our opinion as both sides of the market seemed indecisive.
4hr view: For those of you who read our last report on this pair, you may recall us mentioning to be prepared for price to fake below the 4hr demand zone at 0.7709-0.7737 into the daily swap level seen just below at 0.7691. As you can see this did indeed happen, unfortunately though, we were unable to find a suitable entry long on the lower timeframes – well done to anyone who did!
At the time of writing, the buyers continue to press forward, which will very likely see them greet the 4hr supply area seen at 0.7767-0.7743 very soon. This supply zone is a key area in our opinion. Should we see price continue to surge above this zone, this will likely suggest this market is headed higher to at least 0.7801. If this 4hr supply zone is respected, however, this could be early signs that there is weakness present, and price may continue to sell off, as it has done so aggressively since the 14/05/15.
With all of the above taken into consideration, our team has decided to put this pair on the back burner for the time being, until further development is seen.
Levels to watch/ live orders:
- Buys: Flat (Predicative stop-loss orders seen at: N/A).
- Sells: Flat (Predicative stop-loss orders seen at: N/A).
USD/JPY:
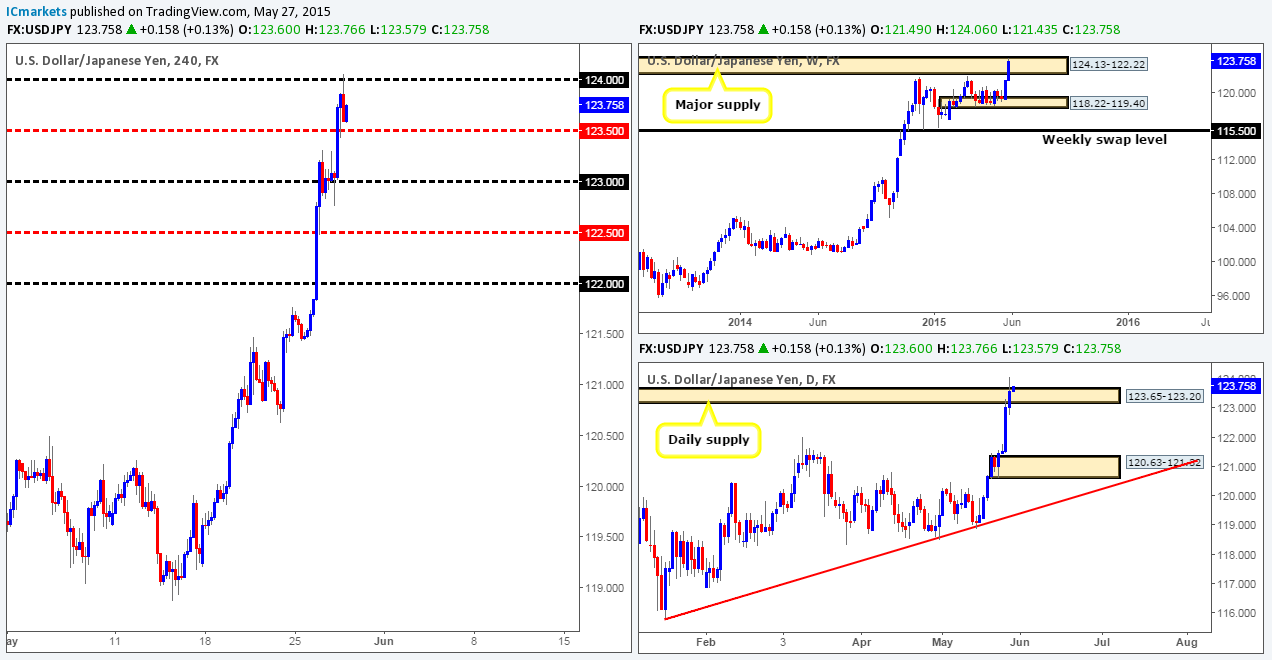
Weekly view: From this angle, we can see that the USD/JPY pair continues to drive higher into the major weekly supply area coming in at 124.13-122.22.
Daily view: Yesterday’s action shows that price aggressively broke above a long-term daily supply area seen at 123.65-123.20 (located deep within the aforementioned weekly supply zone). Nonetheless, until today’s candle closes, it is very difficult to tell whether this was a push higher to continue advancing, or a fakeout to push lower… It will be interesting to see what the 4hr timeframe has to say about this…
4hr view: Amid yesterday’s sessions, a 4hr pin-bar candle formed as price retested 123.00 as support. This, as you can see, saw the USD/JPY violently rally north during London’s morning session, taking out the mid-level number 123.50, and shortly after connecting with 124.00, which so far has held this market lower.
Given that price remains trading within higher timeframe supply (see above) at the moment – albeit hanging on by a thread, we could still see price sell off. Nevertheless, all the while price trades between 124.00 and 123.50, our finger will firmly stay off the trigger. In the event that we see a break below 123.50 today, this could suggest further downside may ensue down towards 123.00. We’ll only consider shorting this break if a retest of 123.50 is seen along with lower timeframe confirmation – the risk/reward will need to be at least 2:0 for us to be interested here. If price manages to get above 124.00 and hold firm, however, this will likely suggest that the bulls intend to continue pushing this market north, since most of the selling pressure from within the aforementioned higher-timeframe supply zones would likely be consumed by then.
Levels to watch/ live orders:
- Buys: Flat (Predicative stop-loss orders seen at: N/A).
- Sells: Flat (Predicative stop-loss orders seen at: N/A).
USD/CAD:
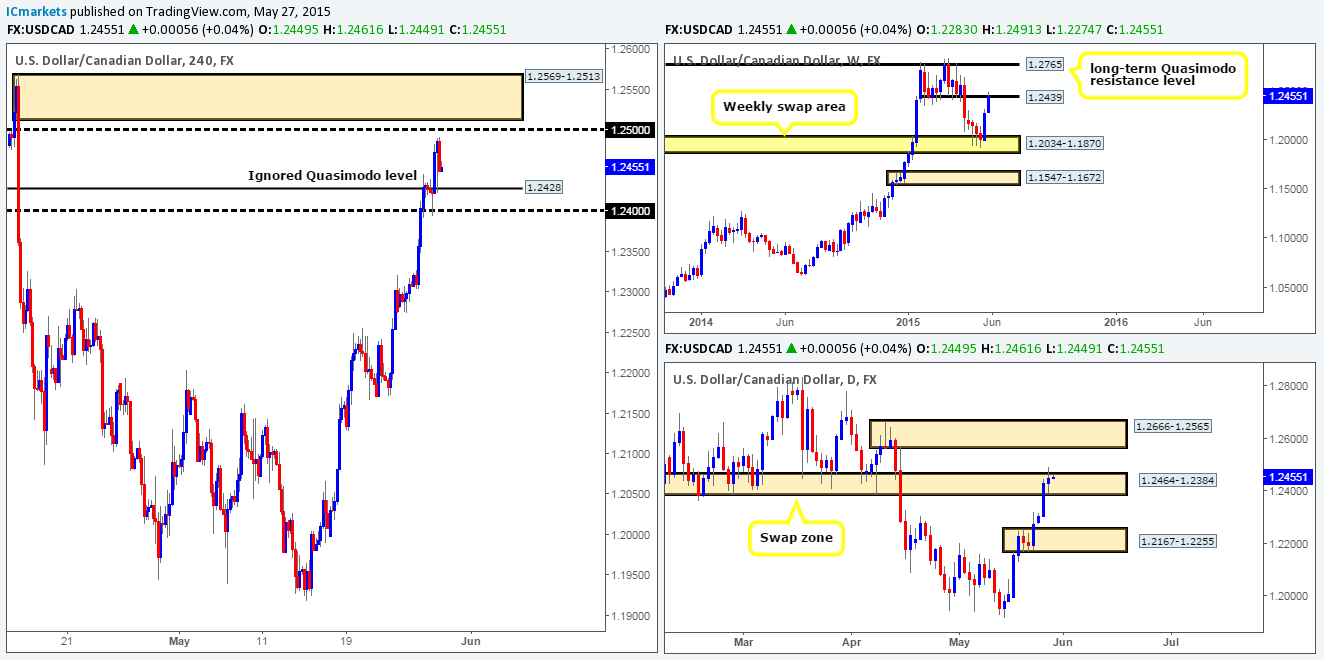
Weekly view: Last week’s rebound from the weekly swap area at 1.2034-1.1870 has so far seen the market extend further north, which as a result has forced price to punch into a weekly swap level seen at 1.2439.
Daily view: The daily timeframe shows that the buyers and sellers continue to battle for position within a daily swap area coming in at 1.2464-1.2384.
4hr view: Wednesday’s sessions show that price beautifully retested 1.2400 as support right around the London open, and from there on aggressively broke above and retested the 4hr ignored Quasimodo level as support at 1.2428.
On the condition that price remains above 1.2428 today, there’s a good chance that this pair will look to test 1.2500. Nonetheless, we would not consider 1.2500 a good sell level. The reason for why comes from there being a nice looking 4hr supply area at 1.2569-1.2513 (located just below daily supply at 1.2666-1.2565) sitting just above it which has ‘fakeout zone’ written all over it. Once/if price tests 1.2500, a quick spike/fakeout above this number will highly likely be seen. This will trigger buy stops, which is of course liquidity to sell into from the 4hr supply area. We’re quite confident a reaction will take place from this 4hr supply zone, so our team has set a pending sell order just below it at 1.2509, with a stop placed above at 1.2574.
Levels to watch/ live orders:
- Buys: Flat (Predicative stop-loss orders seen at: N/A).
- Sells: 1.2509 (Predicative stop-loss orders seen at: 1.2574).
USD/CHF:
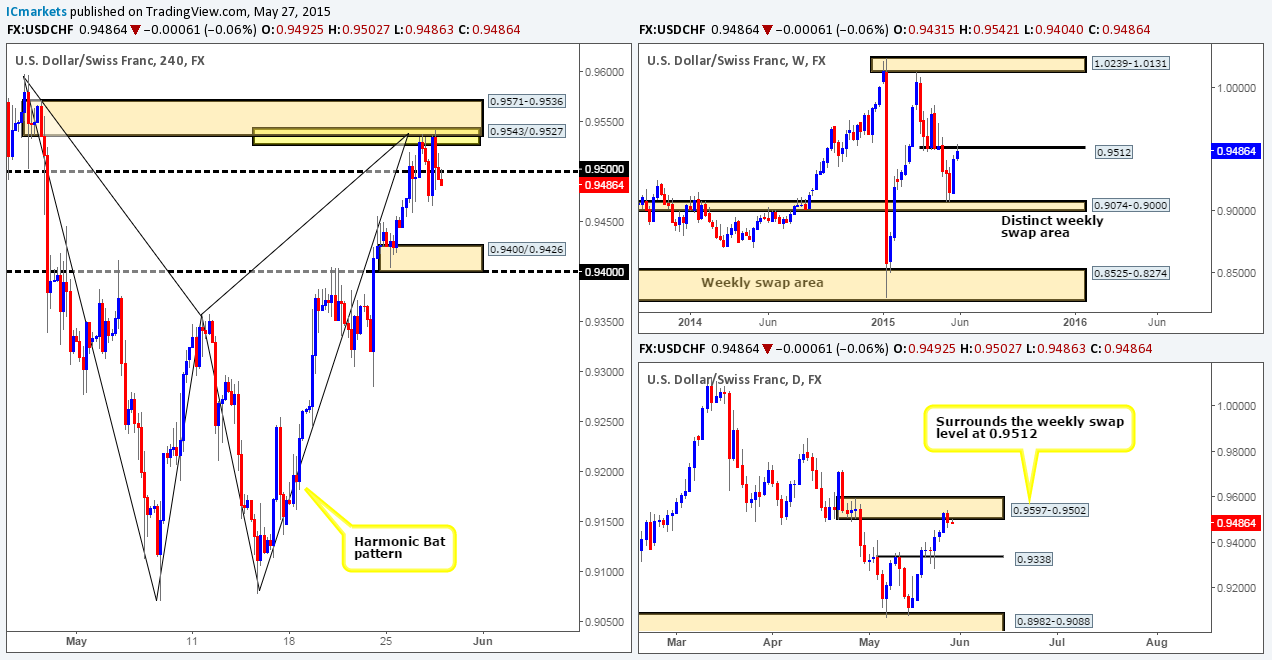
Weekly view: The weekly timeframe shows that price is now trading around a weekly swap level positioned at 0.9512.
Daily view: Following the recent buying seen on this pair yesterday, price is now trading within a fresh daily supply area coming in at 0.9597-0.9502 (encapsulates the aforementioned weekly swap level). Assuming that a sell off ensues from this zone, it is likely we’ll see this market head towards the daily swap level 0.9338.
4hr view: After price shook hands with the 4hr supply area at 0.9571-0.9536, we can see selling interest is certainly present. This should not really come as much of a surprise since this 4hr supply zone not only converges with a Harmonic Bat reversal zone seen at 0.9543/0.9527, but is also located around weekly and daily timeframe resistive structures (see above). Unfortunately, we were unable to find an entry south at this 4hr supply zone. Nonetheless, we have just managed to catch a small short (0.9496) on the retest of 0.9500 as resistance – a 30 minute bearish pin-bar candle was our trigger (0.9502/0.9495). The reasoning behind entering short here is simply because we believe the majority of demand to be consumed (check out the demand consumption tails at 0.9466/0.9459/0.9454) below until price reaches the 0.9400/0.9426 region.
Levels to watch/ live orders:
- Buys: Flat (Predicative stop-loss orders seen at: N/A).
- Sells: 0.9496 [Live] (Predicative stop-loss orders seen at: 0.9505).
US 30:
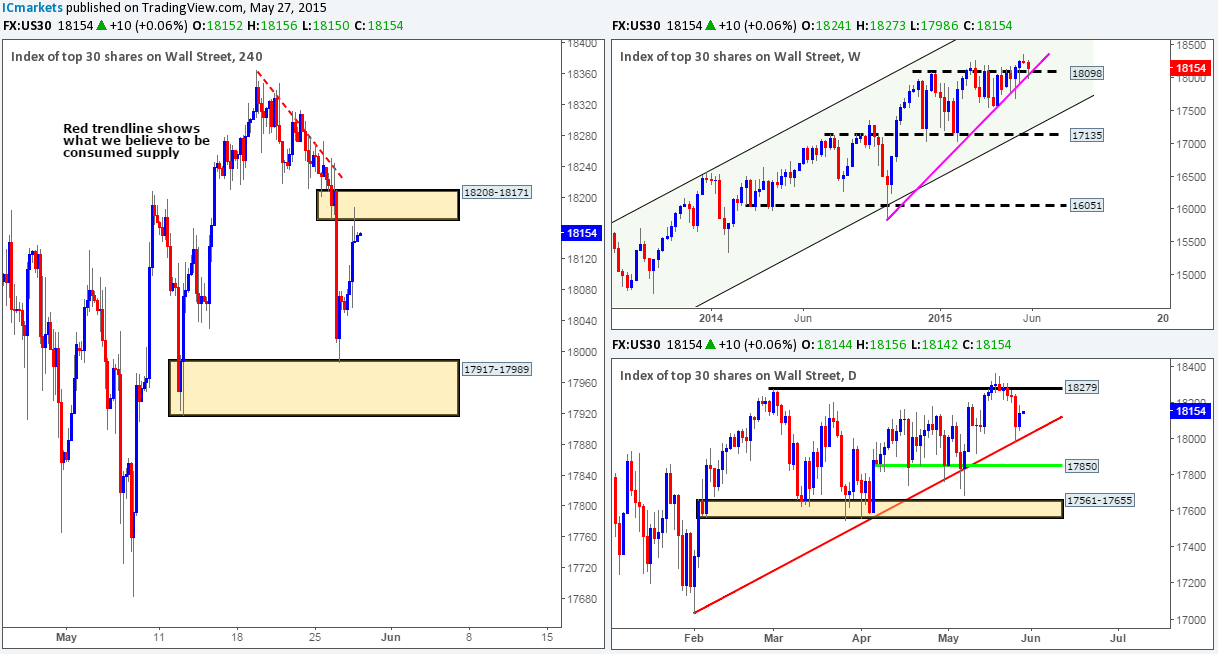
Weekly view: The weekly timeframe shows that price is currently respecting the 18098 barrier as support, which, as you can see, also converges just beautifully with the weekly trendline extended from the low 15849.
Daily view: From this viewpoint, we can see that price rebounded from the daily trendline support taken from the low 17033. Assuming that the buyers can hold out above this line, it’s possible we may see price attack the 18279 region again.
4hr view: The 4hr timeframe shows some very interesting price action. The recent advance north has seen the DOW greet 4hr supply positioned at 18208-18171, which is a very significant zone in our opinion. Check out how price reacted to this area – a nice looking selling tail formed, but what occurred after? Not a lot! In fact, there was no follow-through selling (should be expected since we’re currently trading from higher timeframe support [see above]) seen at all. This leaves us with the question – what next? Well, should the market continue to rally north, we’ll likely see the aforementioned 4hr supply area taken out, here’s where it gets interesting! Above this supply is nothing but consumed sellers as far as we can see. The wicks that you see poking above the red trendline was likely the work of pro money spiking north to fill any unfilled sell orders to continue shorting this market, thus once/if price reaches this area, the market should slice through this congested zone like a hot knife through butter.
So, what we’re ideally looking to happen to today is price break above the 4hr supply zone and hold firm. This will be our cue to begin zooming down to the lower timeframes and check to see if we have corresponding lower timeframe confirming price action. If so, we are going to enter long and target at least 18340.
Levels to watch/ live orders:
- Buys: Flat (Predicative stop-loss orders seen at: N/A).
- Sells: Flat (Predicative stop-loss orders seen at: N/A).
XAU/USD (Gold)
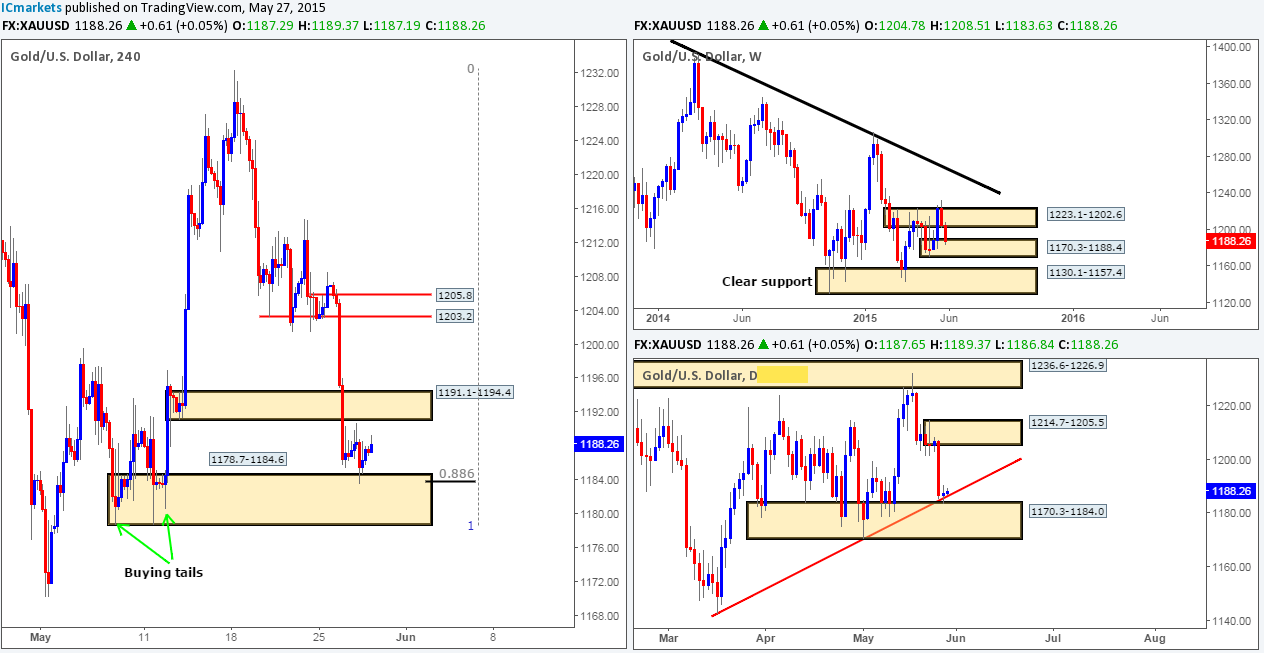
Weekly view: Following last week’s fakeout above the weekly supply area seen at 1223.1-1202.6, the gold market has so far continued to sell off, consequently driving head first into a small weekly demand area at 1170.3-1188.4.
Daily view: The daily timeframe shows that price is currently tackling the top side of a daily buy area at 1170.3-1184.0, which also converges nicely with a daily trendline taken from the low 1142.5.
4hr view: For those who read our previous report on gold, you may recall us mentioning to keep a close eye on the 4hr buy zone coming in at 1178.7-1184.6 (located just within the daily buy area at 1170.3-1184.0). This area was particularly attractive since it boasts deep Fibonacci support at 0.886, and also shows distinct pro money activity in the form of buying tails seen at 1178.7 and 1180.6 (indicating unfilled buy orders may still be lurking within and around this zone) earlier this month.
Unfortunately, we were unable to pin point a buy signal here on the lower timeframes, well done to anyone who did! The rebound from the 4hr buy area has so far encountered very little opposition. This will likely continue until price connects with the recently broken 4hr demand area (now supply) at 1191.1-1194.4, where a decision will need to be made. If gold manages to convincingly break above this opposing 4hr zone (potential buying opportunity may present itself if this area is retested), then there’s a good chance that the market will continue to rally towards 1203.2/1205.8 region.
On the other hand, should traders decide to reverse price from the oncoming 4hr swap area, we would have no interest in selling here since we would not really feel comfortable shorting into higher timeframe areas of support (see above).
Levels to watch/ live orders:
- Buys: Flat (Predicative stop-loss orders seen at: N/A).
- Sells: Flat (Predicative stop-loss orders seen at: N/A)
