
A note on lower timeframe confirming price action…
Waiting for lower timeframe confirmation is our main tool to confirm strength within higher timeframe zones, and has really been the key to our trading success. It takes a little time to understand the subtle nuances, however, as each trade is never the same, but once you master the rhythm so to speak, you will be saved from countless unnecessary losing trades. The following is a list of what we look for:
- A break/retest of supply or demand dependent on which way you’re trading.
- A trendline break/retest.
- Buying/selling tails/wicks – essentially we look for a cluster of very obvious spikes off of lower timeframe support and resistance levels within the higher timeframe zone.
- Candlestick patterns. We tend to only stick with pin bars and engulfing bars as these have proven to be the most effective.
For us, lower timeframe confirmation starts on the M15 and finishes up on the H1, since most of our higher timeframe areas begin with the H4. Stops usually placed 5-10 pips beyond your confirming structures.
EUR/USD:
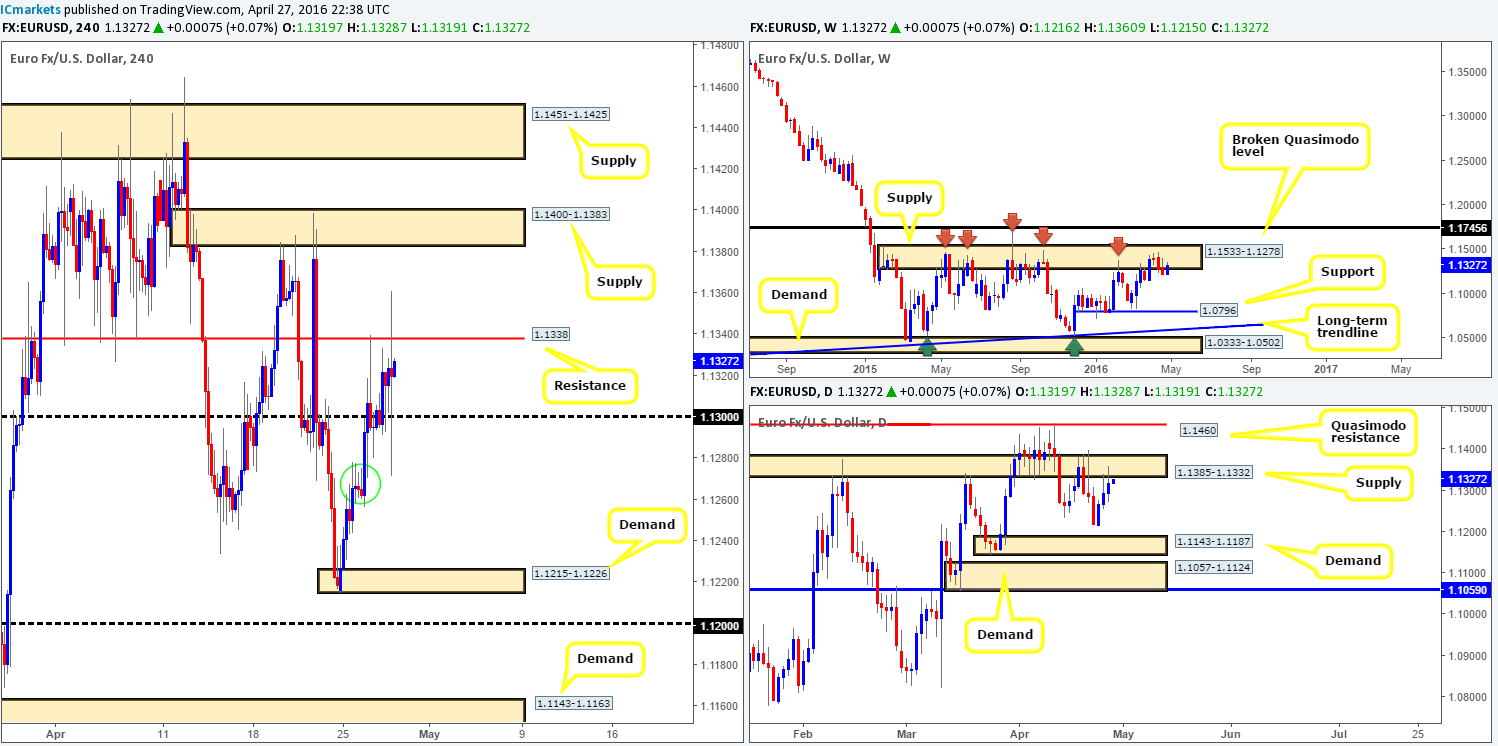
The aftermath of yesterday’s FOMC meeting which ended with rates left unchanged sparked a relatively volatile reaction, with the single currency quickly striking highs of 1.1360 and lows of 1.1270. Despite this, as can be seen from the H4 chart, price remains trading between H4 resistance at 1.1338 and the psychological support 1.1300. Looking solely at the H4 picture, a break above 1.1338 could set the stage for a continuation move north up to H4 supply coming in at 1.1400-1.1383. A break below 1.1300, nonetheless, is interesting. Yesterday’s low 1.1270 likely consumed a truckload of bids from the H4 demand seen marked with a green circle at 1.1256-1.1278, so a close beyond 1.1300 could force this market down to as far as H4 demand at 1.1215-1.1226.
Over on the higher-timeframe picture, however, the weekly chart still shows the buyers and sellers battling for position within supply drawn from 1.1533-1.1278. As we’ve mentioned before, this area has held the single currency lower since May 2015, so the bulls will likely have their work cut out for them if they intend on pushing this market higher! Down on the daily chart, price continues to stab into supply given at 1.1385-1.1332.
Therefore, purely from a structure perspective, a break below the 1.1300 line is more likely today in our opinion. However, it could still potentially go either way as a break above the H4 resistance 1.1338 and a subsequent rally to H4 supply at 1.1400-1.1383 would not really alter the aforementioned higher-timeframe structure a great deal.
Given the points made above, we feel there’s opportunity to trade this pair both long and short today with a slight edge, of course, being seen to the downside:
- Watch for price to close above the H4 resistance 1.1338 and look to trade any retest seen thereafter (lower timeframe confirmation preferred), targeting H4 supply at 1.1400-1.1383.
- Watch for price to close below the 1.1300 handle and look to trade any retest seen thereafter (lower timeframe confirmation preferred), targeting H4 demand at 1.1215-1.1226.
Levels to watch/live orders:
- Buys: Watch for price to close above the H4 resistance 1.1338 and look to trade any retest seen thereafter (lower timeframe confirmation preferred).
- Sells: Watch for price to close below the 1.1300 handle and look to trade any retest seen thereafter (lower timeframe confirmation preferred).
GBP/USD:
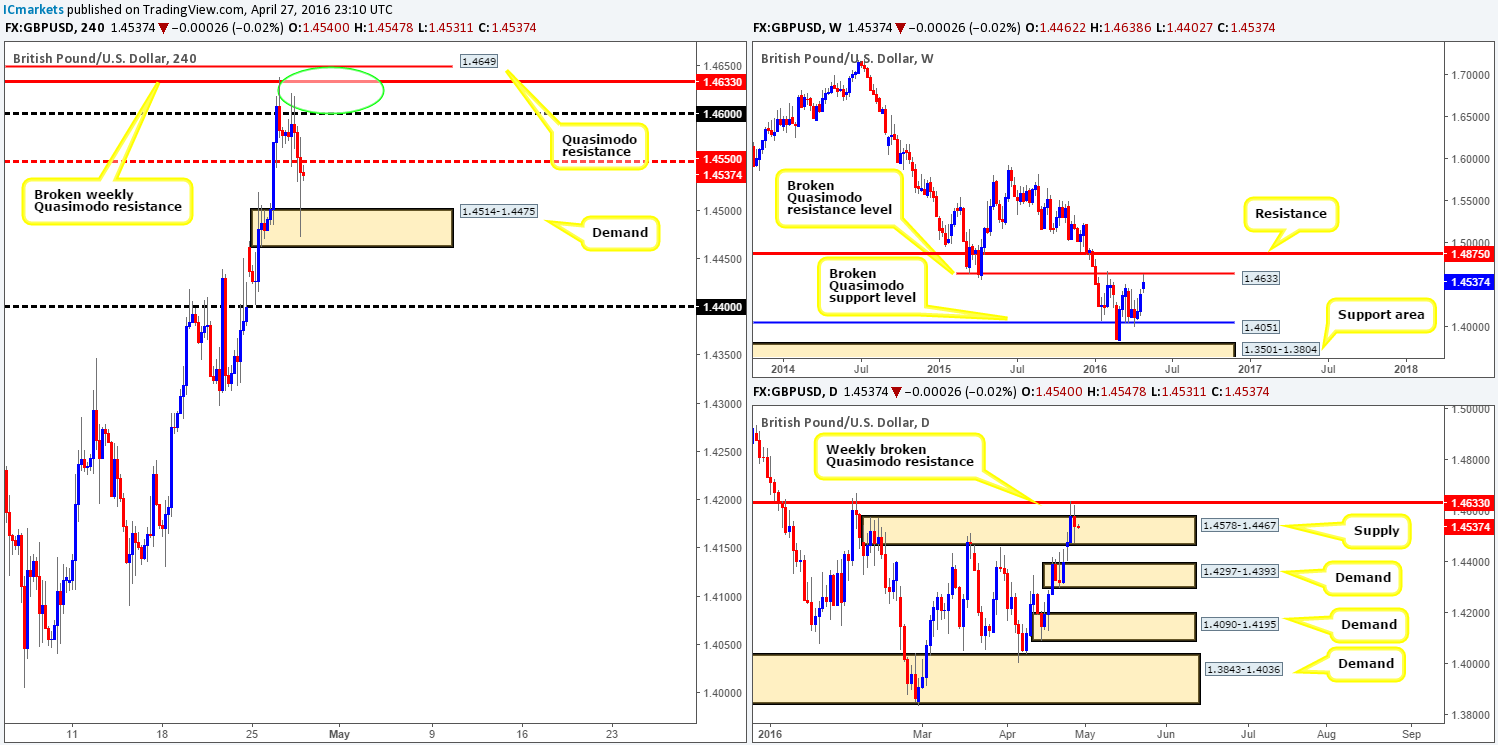
In our previous report (see link below) we wrote about the possibility of a sell-off from the 1.4649/1.4600 region (green circle) due to it comprising of the following structures:
- A H4 Quasimodo resistance level at 1.4649.
- A broken weekly Quasimodo resistance level seen at 1.4633.
- Psychological resistance 1.4600.
With the help of the FOMC yesterday where rates were left unchanged, H4 action, as you can see, plunged lower. Well done to any of our readers who managed to jump in on this one before the selling commenced. The first take-profit target of 1.4550 was quickly achieved, whilst the second target at H4 demand drawn from 1.4514-1.4475 was realized following a knee-jerk reaction caused by the news.
Technically, we still believe this market is heading down to at least the 1.4400 handle which sits on top of daily demand at 1.4297-1.4393 – the next downside target on this timeframe. With the H4 demand at 1.4514-1.4475 likely weak from yesterday’s attack, it’s very possible 1.4400 will be achieved sometime today. With that being the case, we’re going to be looking for selling opportunities around the H4 mid-way resistance 1.4550. Waiting for lower timeframe confirmation from 1.4550 is something that we’d require to see, nevertheless (despite the higher-timeframe picture being positioned at a weekly resistance – see above), to avoid any unnecessary fakeouts through this fixed level (for confirmation techniques, please see the top of this report).
Levels to watch/live orders:
- Buys: Flat (Stop loss: N/A).
- Sells: 1.4550 region [Tentative – confirmation required] (Stop loss: dependent on where one confirms this area).
AUD/USD:
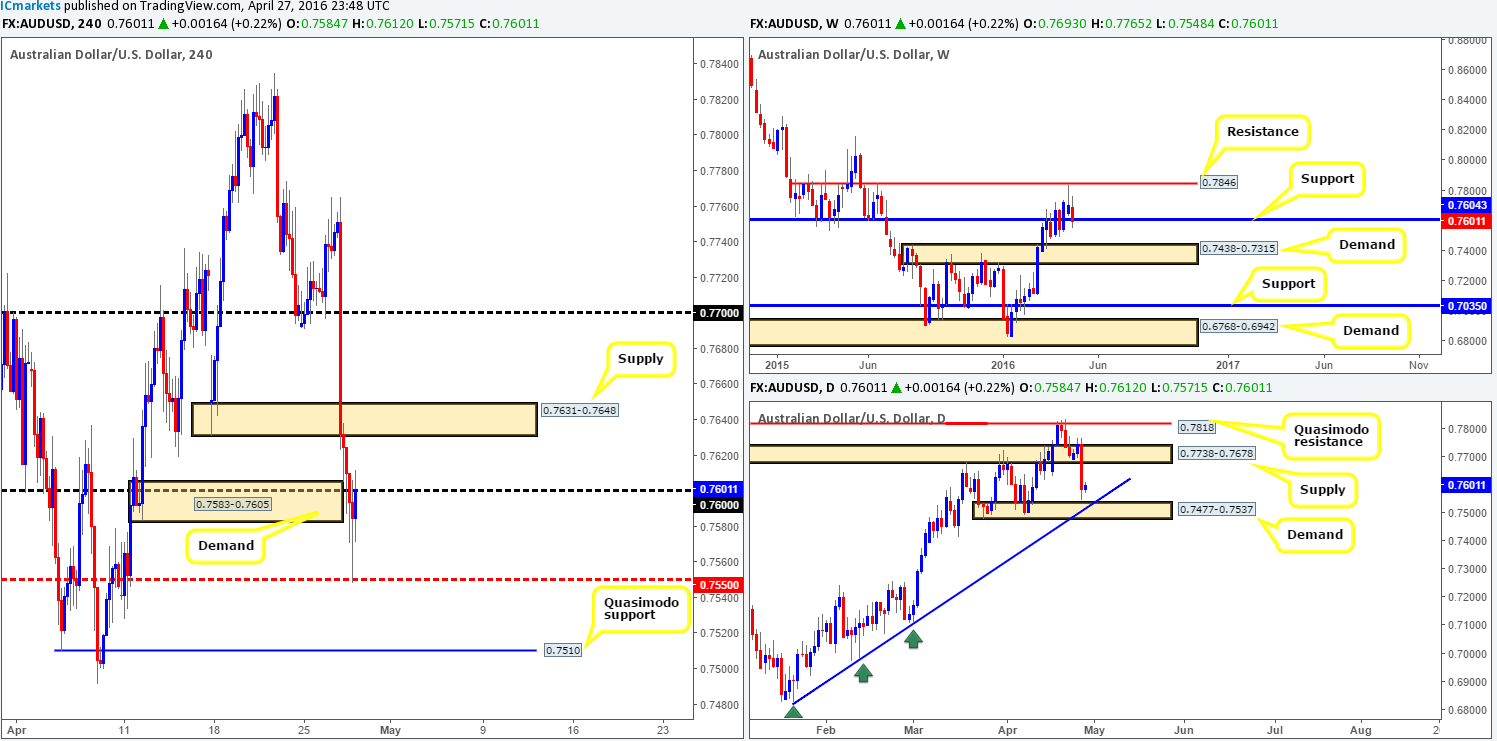
It was certainly not a good day for anyone long the Aussie dollar yesterday! In the early hours of trading Australian CPI data came in lower than expected, consequently sending the commodity currency screaming to lows of 0.7658. This downside momentum was further boosted by the FOMC, which, as you can see, sent the pair to lows of 0.7548 where price eventually bottomed out and slightly reversed into the close. H4 demand at 0.7631-0.7648 (now acting supply) was consumed, and H4 demand just below it at 0.7583-0.7605 suffered a very nasty whipsaw through to the H4 mid-way support 0.7550.
In light of the recent events what direction do we see this market heading today? Well, with the weekly chart now trading around support at 0.7604 and the daily price trading only a stone’s throw away from demand coming in at 0.7477-0.7537, we feel the upside has more potential. That being said though, the H4 chart shows a rather cramped path north at the moment! Not only do we have 0.7600 in the way, but there is also the recently broken H4 demand-turned supply at 0.7631-0.7648 to contend with. Given this, the only buy levels we see worthy of consideration today are seen lower down on the scale:
- A pullback to the H4 mid-way support 0.7550 could prove a nice barrier to buy from today. We would advise waiting for the lower timeframes to confirm buying strength resides here prior to risking capital (for confirmation techniques, please see the top of this report), nevertheless, since a fakeout through to the daily demand sitting just below at 0.7477-0.7537 could take place. And that brings us on to the next level…
- The H4 Quasimodo support at 0.7510 which is housed beautifully within the above said daily demand base. Dependent on the time of day, one may consider entering here at market as long as there are strict trade management rules in place!
Levels to watch/live orders:
- Buys: 0.7550 region [Tentative – confirmation required] (Stop loss: dependent on where one confirms this area). 0.7510 [Possible market entry here dependent on the time of day] (Stop loss: 0.7489).
- Sells: Flat (Stop loss: N/A).
USD/JPY:
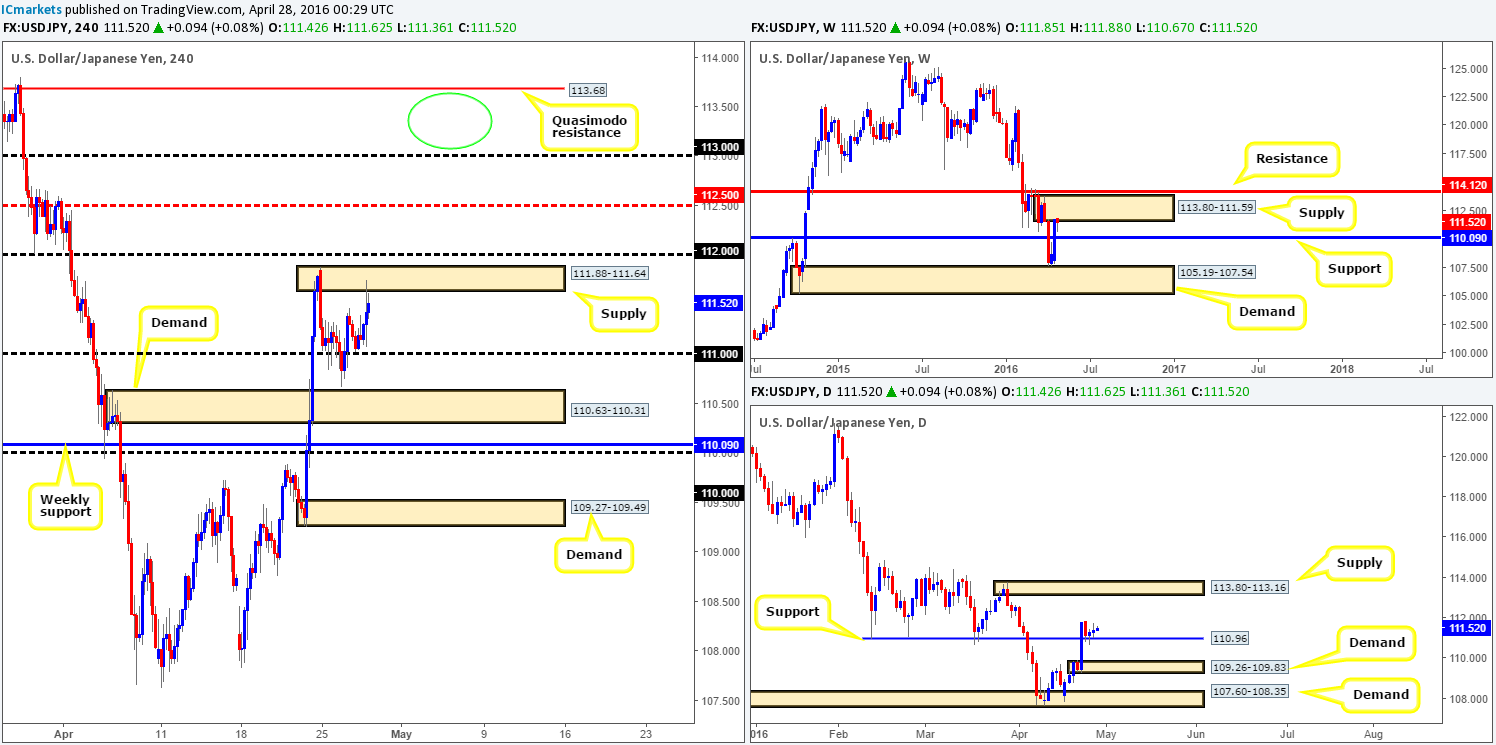
Reporting from the weekly chart this morning, the bears appear to be struggling to hold ground after recently connecting with supply drawn from 113.80-111.59. Consequent to this we may see a push higher into this zone before any serious selling is seen. On the flip side, daily price has been holding firm above support seen at 110.96 since the beginning of the week. To our way of seeing things at the moment, there’s potential for this market to drive north from here up to daily supply chalked in at 113.80-113.16 (positioned within the extremes of the aforementioned weekly supply). Moving across to the H4 chart, price edged higher yesterday after the Fed decided to leave rates unchanged. The pair rose to highs of 111.75, placing the USD/JPY beneath H4 supply coming in at 111.88-111.64 (weekly high point).
Unless price is able to clear not only this H4 supply and the psychological resistance above it at 112.00, it would be difficult for us to become buyers in this market. Should a close higher come to fruition, nonetheless, this would likely open the gates for the action to test at least the H4 mid-way resistance 112.50, and also allow one to trade any confirmed retest seen at 112.00 (for confirmation techniques, please see the top of this report). Yes, buying from here would entail entering long into weekly supply, but with daily support holding and price breaking above 112.00, we feel it’s enough to condone a buy. The ultimate target above 112.00 is seen between the H4 Quasimodo resistance line at 113.68 and psychological resistance 113.00 (green circle), since at that point you’d be trading at the underside of the daily supply mentioned above at 113.80-113.16.
Levels to watch/live orders:
- Buys: Watch for price to consume 112.00 and look to trade any retest seen thereafter (lower timeframe confirmation required).
- Sells: Flat (Stop loss: N/A).
USD/CAD:
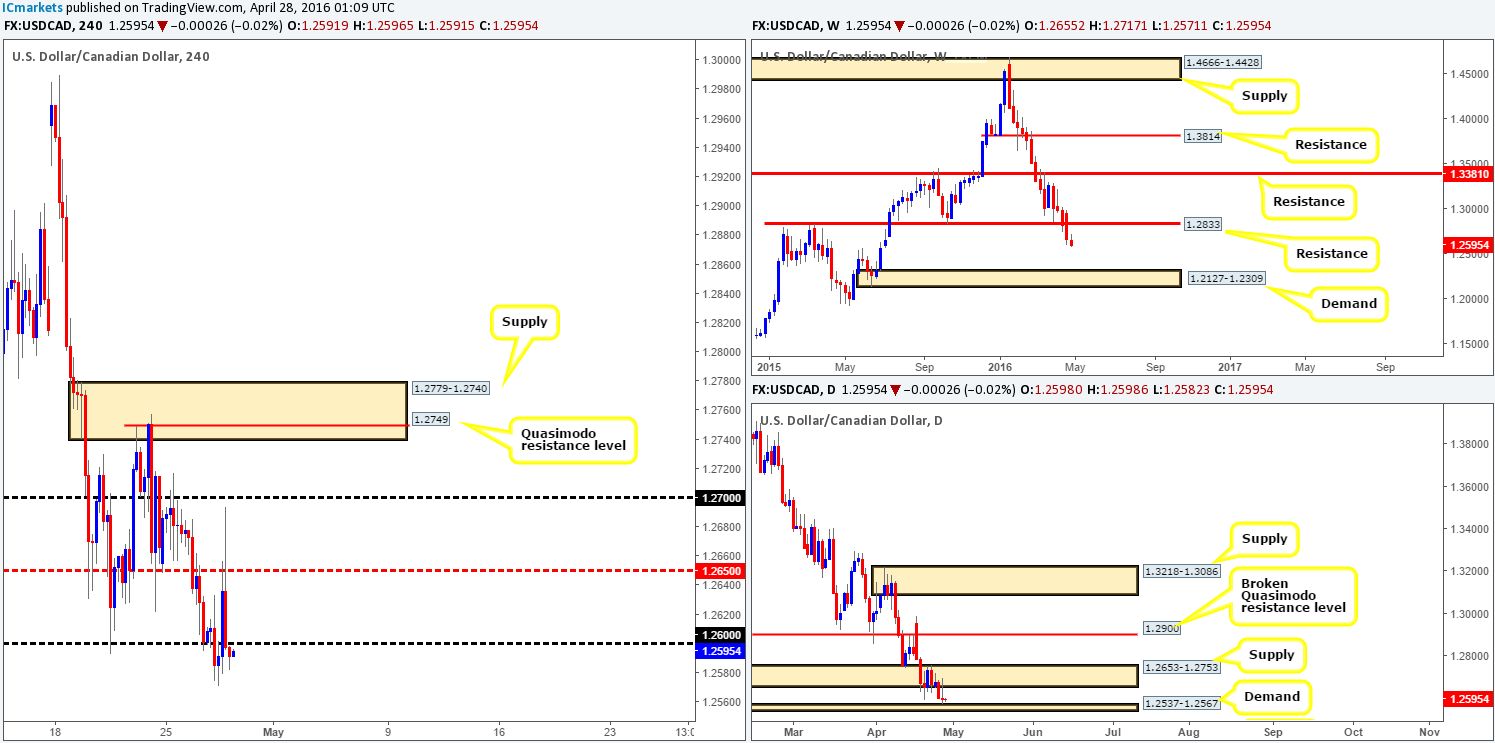
During the course of yesterday’s sessions, the Fed’s decision to leave interest rates unchanged strengthened the U.S. dollar, bringing the Loonie to highs of 1.2694. Despite this, the pair quickly reversed and pushed price down to lows of 1.2595 on the day.
With weekly support at 1.2833 out of the picture now, there is, as we mentioned in previous reports, likely room for a continuation move south down towards demand at 1.2537-1.2567. Before the sellers can push this market as low as this though, daily demand at 1.2537-1.2567, which is now within touching distance, will need to be consumed. A close below here would, in our estimation, suggest further downside towards daily demand at 1.2309-1.2397, which sits on top of the aforementioned weekly demand.
On account of the above points, here is what we have logged going forward:
- Assuming that price remains below 1.2600 today, one could look for this market to retest this number as resistance, potentially laying a foundation for a short trade down to H4 support coming in at 1.2538. In order for us to be permitted to trade this move, we’d need to see a lower timeframe sell entry form around 1.2600 (for confirmation techniques, please see the top of this report) to avoid any potential fakeout through this fixed level. Should this come to fruition, the first take-profit target would be at the H4 mid-way point 1.2550 which is where we’ll also look to reduce risk, since at that point price would be positioned within daily demand at 1.2537-1.2567. The second take-profit target, for us, is the H4 support we mentioned above at 1.2538, essentially marking the extreme point of the daily demand mentioned above. In the event that price reaches this low, we plan on leaving some of our position open here due to the possibility that price could break through this daily demand and continue lower.
Levels to watch/live orders:
- Buys: Flat (Stop loss: N/A).
- Sells: 1.2600 region [Tentative – confirmation required] (Stop loss: dependent on where one confirms this area).
USD/CHF:
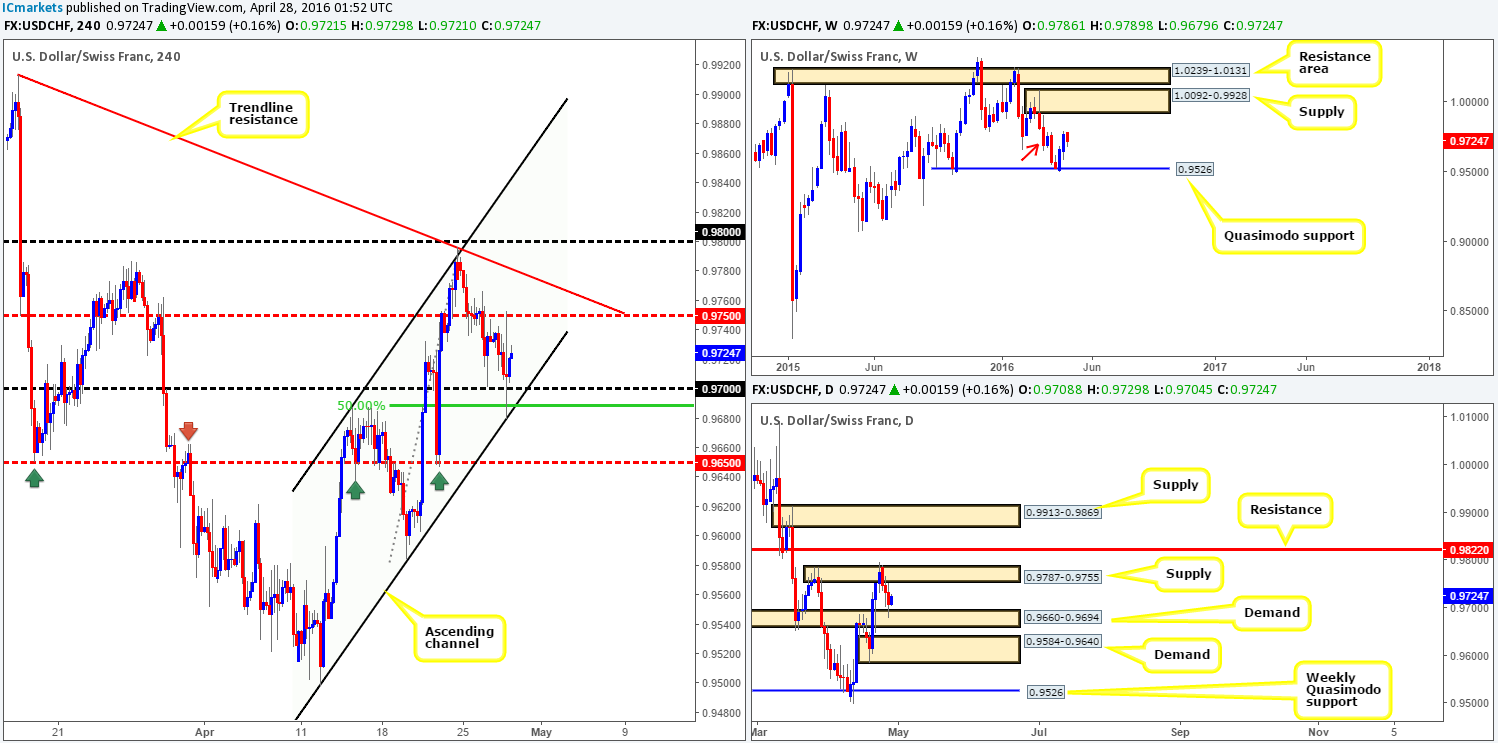
Starting from the top this morning, we can see that since price spiked above weekly supply seen marked with a red arrow at 0.9787-0.9695, the Swissy took on a more bearish stance. However, considering how strong price rallied from the weekly Quasimodo support at 0.9526 beforehand, we feel further upside is still possible towards weekly supply drawn at 1.0092-0.9928. In-line with this expectation, daily action reveals that price respected demand coming in at 0.9660-0.9694 yesterday, and now appears to be heading north to retest a recently breached supply at 0.9787-0.9755. Beyond this area, the next line of trouble on this timeframe falls in at 0.9822 – a clear resistance level.
Skimming across to the H4 chart, the Fed’s recent decision to leave interest rates unchanged saw price spike to highs of 0.9753, followed by a quick sell-off to lows of 0.9679. As a result, this pair is now confined between the H4 mid-way resistance 0.9750 and psychological support 0.9700. Nevertheless, in view of the higher-timeframe picture (see above) and the fact that price not only bounced from 0.9700, but also a H4 50.0% Fibonacci level at 0.9688 as well as a H4 channel support line extended from the low 0.9498, price is likely headed higher. Entering long at current price, nonetheless, would not be something we would be interested in since the risk/reward would be awfully skewed! The most logical approach, as far as we can see, would be to wait and see if price can retest the 0.9700 region again before hitting 0.9750 since this would be our first take-profit target, and it is also the underside of daily supply at 0.9755!
Levels to watch/live orders:
- Buys: 0.9700 region [Tentative – confirmation required] (Stop loss: dependent on where one confirms this area).
- Sells: Flat (Stop loss: N/A).
DOW 30:
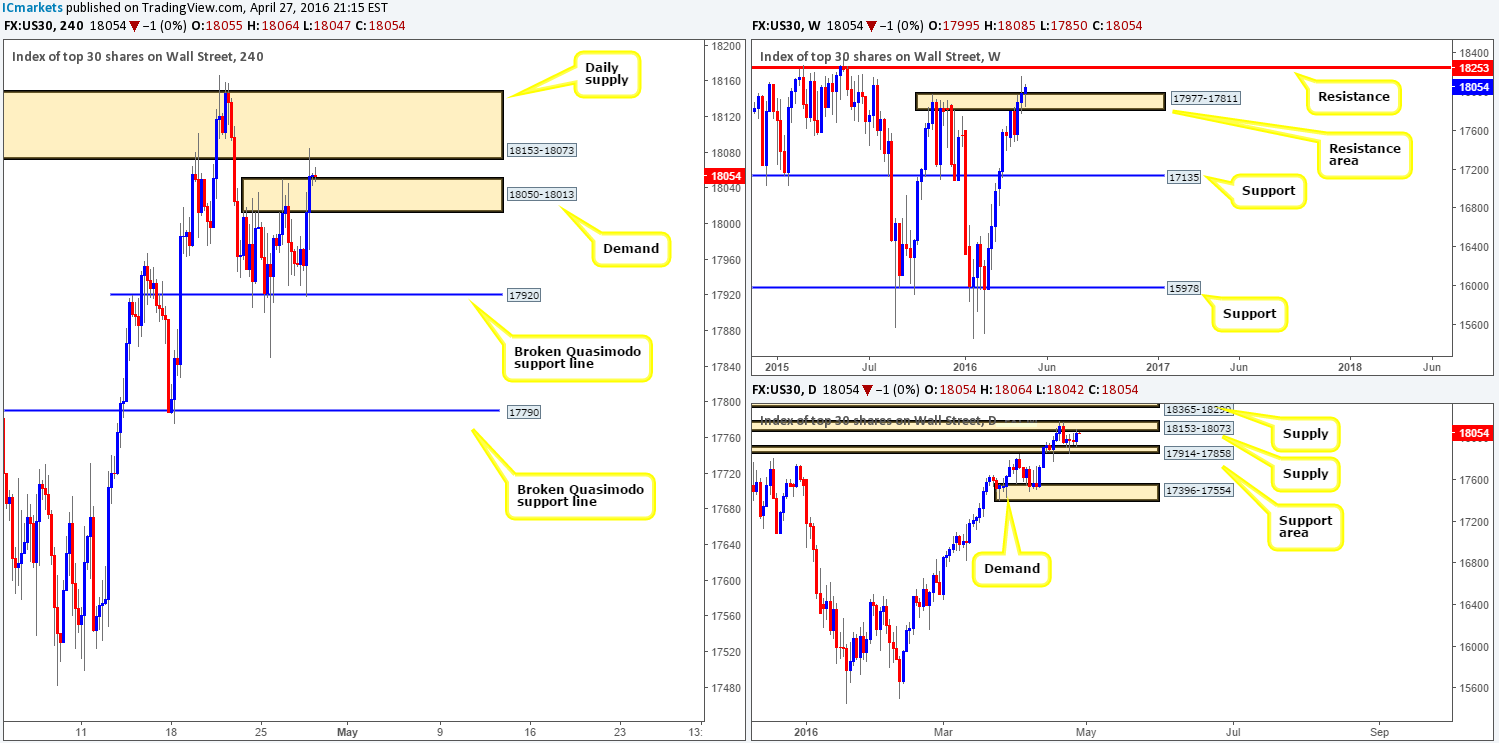
For those who read our previous report on the DOW (see link below) you may recall that we mentioned to watch for a possible buy entry on a pullback into the broken H4 Quasimodo support seen at 17920. As we can all see from the H4 chart, this played out perfectly. Well done to any of our readers who managed to jump in on this one as we unfortunately missed it!
Consequent to this recent bounce north and following the Fed’s latest decision to leave rates unchanged yesterday, U.S stocks appreciated in value up to daily supply seen at 18153-18073. Now, with this daily supply suffering a break last Thursday, there’s potential for this unit to drive further north in our opinion. On top of this, look across to the weekly chart – see how price is trading ABOVE the resistance area coming in at 17977-17811, indicating possible intent to push higher to the 18253 mark.
So where does this leave us today? Well, the best we feel we can do right now is watch and see how price responds to the current H4 demand base at 18050-18013 after connecting with the aforementioned daily supply. On the assumption we are able to pin down a lower timeframe buy setup around this region, we may, given what we’re seeing on the higher timeframes at the moment, buy from here. Ultimately, our final take-profit target would be the weekly resistance level discussed above at 18253, but in between here we’d look to trail price behind support structures formed on the M30 and above.
Levels to watch/live orders:
- Buys: 18050-18013 [Tentative – confirmation required] (Stop loss: dependent on where one confirms this level).
- Sells: Flat (Stop loss: N/A).
XAU/USD:
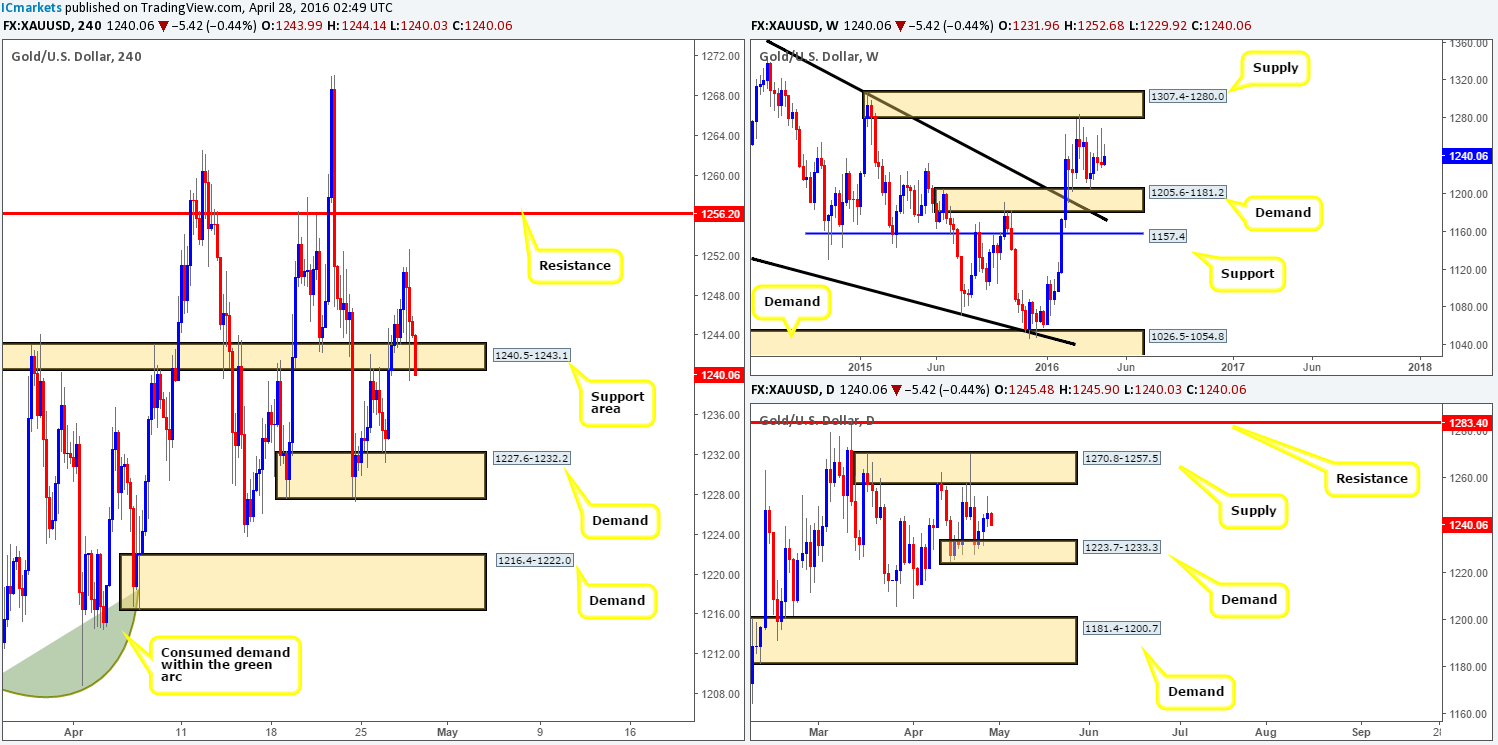
For the majority of yesterday’s trading, the yellow metal was seen advancing north. However, the tables began to turn when the Federal Reserve announced that interest rates would be left unchanged, forcing Gold down to lows of 1239.4 on the day.
As of this point both the weekly and daily charts are showing little direction. From the weekly angle, price is seen capped between supply drawn from 1307.4-1280.0 and demand coming in at 1205.6-1181.2. Similarly, daily price is also capped between a small demand base at 1223.7-1233.3 and a supply zone taken from 1270.8-1257.5.
With this in mind, the H4 chart shows that price is currently ravaging the support area given at 1240.5-1243.1. In the event that bids are weak within this zone, which we believe they are, it is very possible that price will drift lower to connect with the demand zone seen at 1227.6-1232.2 (sits within the aforementioned daily demand). Therefore, a trade opportunity might be at hand should price retest the underside of the current H4 support area following a close lower. Waiting for lower timeframe confirmation before pulling the trigger in this situation would be advisable due to there being little confluence seen from the higher-timeframe structures (see above).
Levels to watch/live orders:
- Buys: Flat (Stop loss: N/A).
- Sells: Watch for price to consume 1240.5-1243.1 and look to trade any retest seen thereafter (lower timeframe confirmation required).


