
EUR/USD:
The Fed took to the stage on Wednesday and unanimously voted to hike interest rates by 25 bps, as anticipated. The central bank also removed the reference in its statement that policy is ‘accommodative’. The dovish reaction to the rate decision and forecasts is likely a result of the fact the Fed’s new 2021 dot looks for rates to be between 3.25-3.50%.
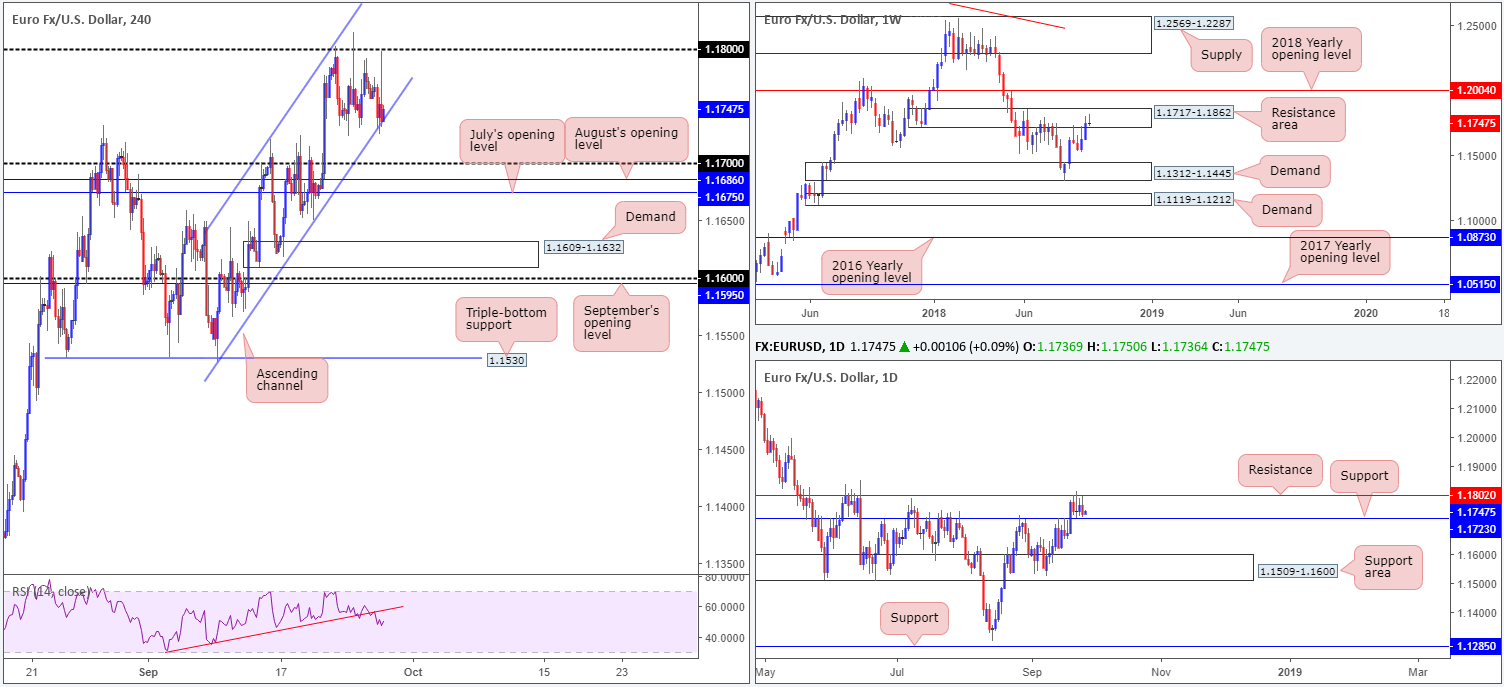
From a technical perspective, the single currency remains capped beneath its 1.18 handle on the H4 timeframe. To the downside, a H4 channel support (extended from the low 1.1525) elbowed its way into the spotlight amid US trade and remained supportive into the closing bell. A break of this barrier could witness a move south towards its 1.17 handle, which also happens to be shadowed closely by two monthly opening levels (July’s opening level at 1.1675 August’s opening level at 1.1686). Initial thoughts from this timeframe is a possible long off the channel floor.
The story over on the bigger picture, nevertheless, show sellers may have the upper hand on the weekly scale as price recently shook hands with a notable resistance area coming in at 1.1717-1.1862. In addition to this, daily movement displays room to trade as low as 1.1723: a support level that’s positioned a touch beneath the aforementioned H4 channel support.
Areas of consideration:
A long from the current H4 channel support faces overhead resistance out of the weekly timeframe, though at the same time is somewhat bolstered by the nearby support on the daily timeframe at 1.1723.
The fact daily support is located a few pips beneath the H4 channel could indicate a fakeout play may be on the menu today. Should traders witness a H4 bullish pin-bar formation take shape that pierces through the current H4 channel support and taps the aforementioned daily support, a long in this market, targeting 1.18 as the initial port of call, is certainly an option that can be considered.
Today’s data points: German prelim CPI m/m; M3 money supply y/y; ECB president Draghi speaks; US core durable goods orders m/m; US final GDP q/q; Fed’s Powell speaks.
GBP/USD:
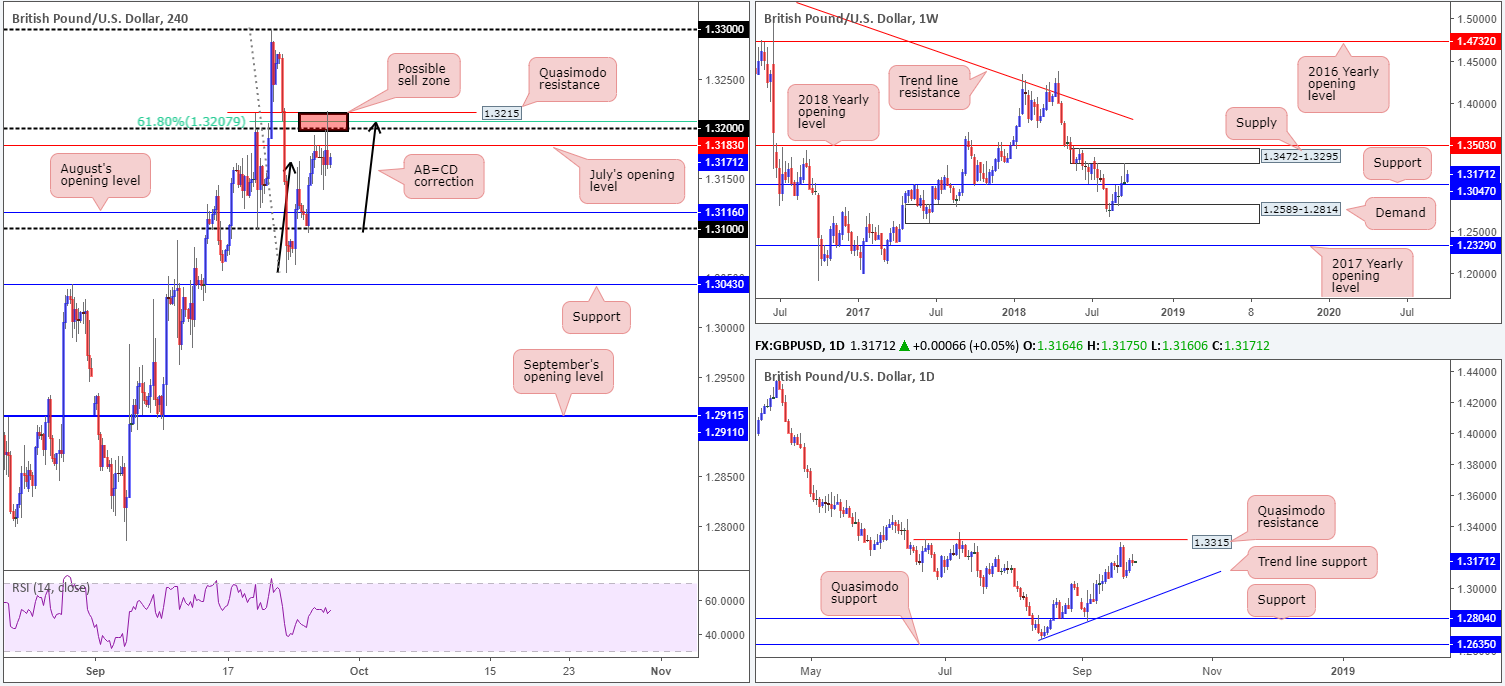
Pound sterling peaked at 1.3217 on Wednesday, following the Federal Reserve’s monetary policy announcement and swiftly pared intraday gains to the 1.3160 neighbourhood.
For folks who read Wednesday’s briefing you may recall the team highlighted 1.3215/1.32 on the H4 timeframe as a possible sell zone. Made up of a H4 Quasimodo resistance level plotted at 1.3215, a 61.8% H4 Fib resistance value at 1.3207, the 1.32 handle and a H4 AB=CD formation, this area managed to withstand any bullish attack thrown at it. Well done to those who managed to take advantage of this move, as the unit concluded the day sub 1.3183: July’s opening level, which subsequently may have set the stage for a potential move south towards August’s opening level at 1.3116 today.
In terms of where we stand on the higher timeframes, limited structure is in play right now. The daily timeframe exhibits potential to press as far south as trend line support (etched from the low 1.2661), and as high as a Quasimodo resistance at 1.3315. It may also be of interest to some traders the daily chart ended Wednesday’s session forming an indecision candle. In regards to the weekly timeframe, support rests at 1.3047 and supply enters the fray around the 1.3472-1.3295 region.
Areas of consideration:
Given the market concluded trade beneath July’s opening level at 1.3183 in the shape of a H4 bearish pin-bar formation, further selling could be observed today. Aggressive traders may look to enter short at current price and position stops a few pips above July’s open level/the 1.32 handle, whereas conservative traders could look to incorporate the bearish pin-bar’s wick (1.3217) as a location to help facilitate stop-loss placement. Either way, the initial take-profit target on the H4 scale falls in around August’s opening level at 1.3116.
Today’s data points: US core durable goods orders m/m; US final GDP q/q; Fed’s Powell speaks.
AUD/USD:
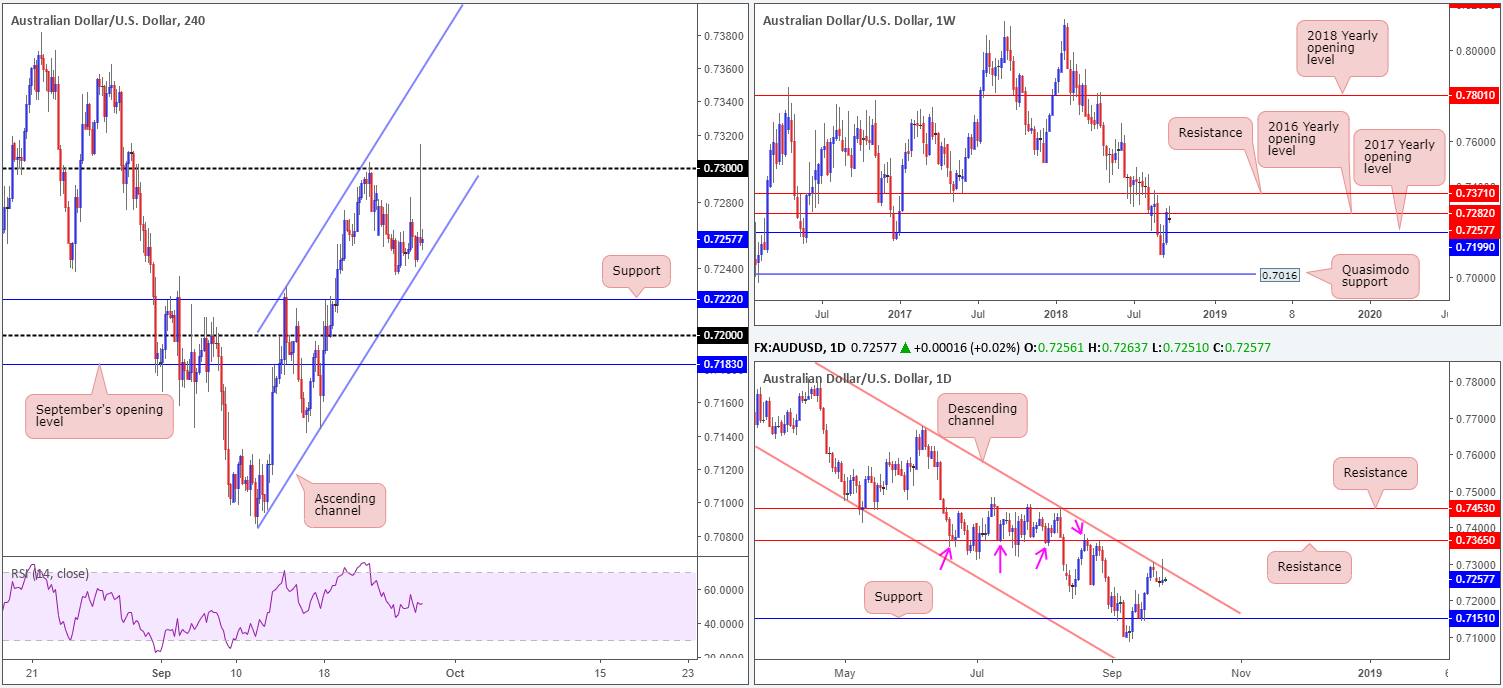
The Australian dollar rose in response to the Fed announcing a 25bps rate hike yesterday, reaching highs not seen since August 30. The move, however, failed to sustain gains beyond its 0.73 handle on the H4 timeframe, swiftly pulling the market back to 0.7250s. Despite this, the H4 candles remain compressing within its ascending channel (0.7085/0.7229).
While intraday traders’ focus may be drawn to the current channel formation, the higher timeframes communicate a bearish tone at the moment. Weekly price is seen languishing beneath its 2016 yearly opening level at 0.7282, though do bear in mind the next downside target on this scale falls in around the 2017 yearly opening level at 0.7199. Alongside this, traders may also want to acknowledge daily price fading a long-term channel resistance (penciled in from the high of 0.8135) in the shape of a bearish pin-bar formation.
Areas of consideration:
In terms of tradable opportunities, a long off the H4 channel support is chancy given where we’re coming from on the bigger picture. A short on the break of this channel, however, is also problematic, with H4 support priced in nearby at 0.7222, followed closely by the 0.72 handle (remember this number represents the 2017 yearly opening level on the weekly timeframe).
As far as we can see, the higher timeframes portend lower prices, with the H4 lacking space to maneuver. With this in mind, unless you’re comfortable with H4 support being seen close by, remaining on the sidelines may be the only alternative.
Today’s data points: US core durable goods orders m/m; US final GDP q/q; Fed’s Powell speaks.
USD/JPY:
In recent news, the Federal Reserve rose rates to 2.00%-2.25%, as expected. Chair Powell also offered an upbeat vibe on the US economy and thinks policy is still accommodative. Although this allowed the US dollar index to eke out a gain, the USD/JPY explored lower levels.
For those who read Wednesday’s briefing you may recall the team underlined 113.14/113 as a possible area for shorts. Comprised of a H4 Quasimodo resistance at 113.14 and the 113 handle, this area managed to withstand whatever the bulls threw at it. Though H4 structure played a part, we favoured this area largely due to its connection with higher-timeframe levels. Exposed around this neighborhood was the underside of daily supply at 113.91-113.09 (merges with a 161.8% Fib ext. point at 113.08), which happens to be glued to the underside of a major weekly supply zone penciled in at 115.50-113.85.
Well done to any of our readers who managed to take advantage of yesterday’s move. Note further selling could also be on the horizon. Not only did we breach the tightly compressed H4 ascending channel (110.38/111.43), the market witnessed a daily bearish engulfing formation take shape out of the aforementioned daily supply zone. The only concern is the 2018 yearly opening level on the weekly timeframe at 112.65. This level may act as support.
Areas of consideration:
For folks already short this market from 113.14/113, well done! Those who missed the call, however, may be given a second chance to enter this market should a retest of 113 be observed (as per the pink arrows). Ultimately, the next downside target on the H4 scale can be seen at 112.44, followed then by daily support mentioned above at 112.11 and then the 112 handle.
It is recommended to wait for a bearish candlestick formation to be drawn up on the retest of 113, nevertheless, since let’s remain cognizant to the possibility of support coming in off the 2018 yearly opening level at 112.65 on the weekly timeframe.
Today’s data points: US core durable goods orders m/m; US final GDP q/q; Fed’s Powell speaks.

USD/CAD:
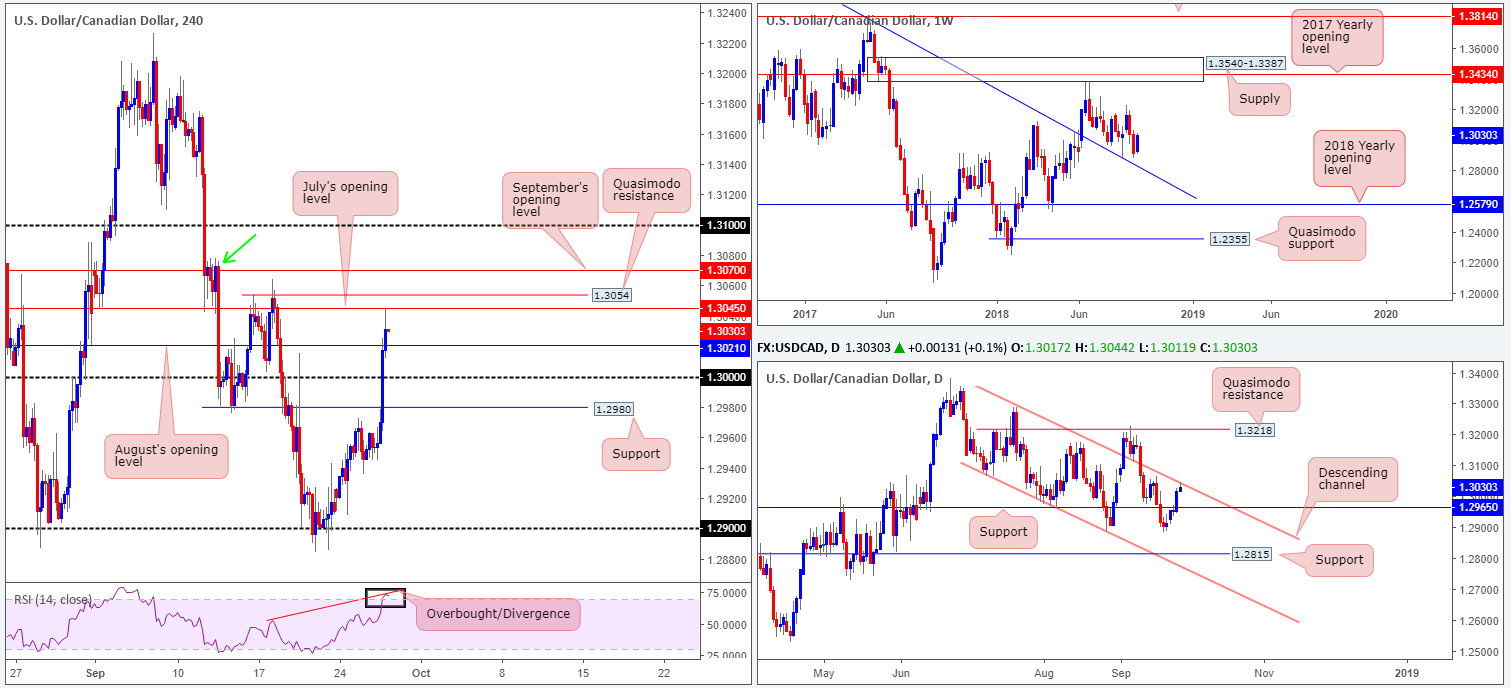
In recent sessions, the US Dollar stepped up further against the loonie following the Fed’s rate hike on Wednesday. The H4 candles, as you can see, took a run at July’s opening level drawn from 1.3045 on the H4 scale after annihilating the key figure 1.30. Note 1.3045 is shadowed closely by a Quasimodo resistance level plotted at 1.3054, and the RSI indicator is seen displaying a strong overbought/divergence reading at the moment.
As things stand on the higher timeframes, weekly price has printed a strong recovery candle this week just north of a trend line resistance-turned support (extended from the high 1.4689). Daily movement, on the other hand, is checking in with a notable channel resistance (extended from the high 1.3386).
Areas of consideration:
With daily price seen engaging with a channel resistance, this may be enough impetus to bring the unit towards 1.30 today on the H4 timeframe for a possible bounce higher. A failure of this level would likely bring the H4 support at 1.2980 into the fray, alongside its closely associated daily support at 1.2965.
As for shorts, the H4 Quasimodo resistance level at 1.3054 is attractive, offering traders the option to position stop-loss orders above the surrounding supply marked with a green arrow at 1.3078-1.3041.
Today’s data points: US core durable goods orders m/m; US final GDP q/q; Fed’s Powell speaks; BoC Gov. Poloz speaks.
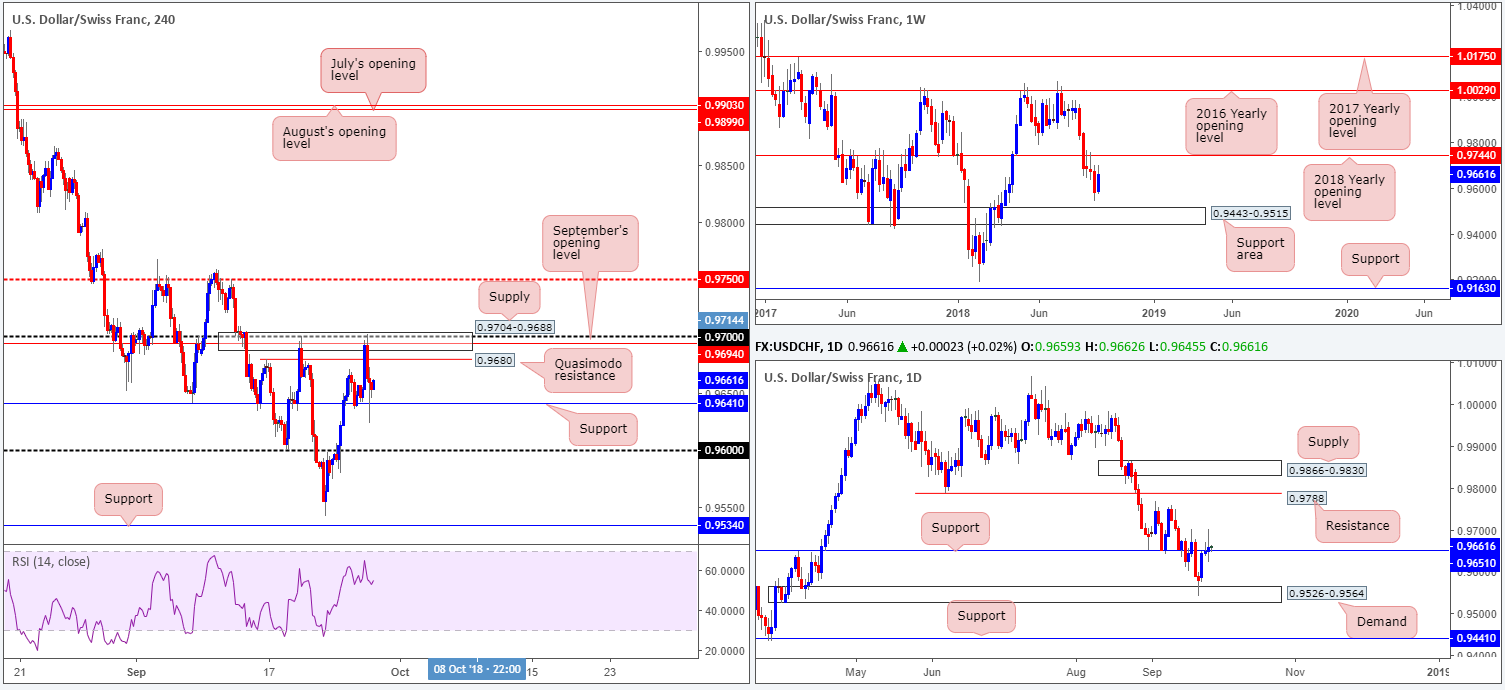
USD/CHF:
Following a late retest of H4 support at 0.9641 on Tuesday, Wednesday’s sessions observed a defined reversal off of the 0.97 handle. In yesterday’s pre-market briefing, the team highlighted H4 supply at 0.9704-0.9688 as a focus for intraday shorting opportunities. The converging structure seen within its borders: the 0.97 handle and September’s opening level at 0.9694, and the nearby H4 Quasimodo resistance at 0.9680, we thought, were likely enough to produce a bounce. In this instance our analysis proved to be correct. Well done to any of our readers who managed to jump aboard this bearish train, given price recently touched gloves with the first take-profit target at H4 support drawn from 0.9641.
Longer term, however, weekly price remains trading mid-range between its 2018 yearly opening level at 0.9744 and a support area drawn from 0.9443-0.9515. Daily resistance at 0.9651, as is evident from the chart, was taken out amid yesterday’s move higher and is now an acting support base to keep eyeballs on. Further buying from this region has 0.9750ish to target (September 11 highs), followed closely by daily resistance at 0.9788.
Areas of consideration:
Longer term, a move north to 0.9744 (the 2018 yearly opening level situated on the weekly timeframe) could be on the cards.
Intraday, however, we’ll need to get beyond 0.97 in order to reach 0.9744 on the bigger picture. And as we already know, 0.97 is surrounded by a collection of notable H4 resistances, so this may be a challenge. To the downside, a break of the current H4 support has the 0.96 handle in view.
Aside from the call to sell 0.97ish yesterday, there’s not a lot to hang one’s hat on at this time, as a retest of the noted H4 supply for a second short now faces support off the daily timeframe!
Today’s data points: US core durable goods orders m/m; US final GDP q/q; Fed’s Powell speaks.
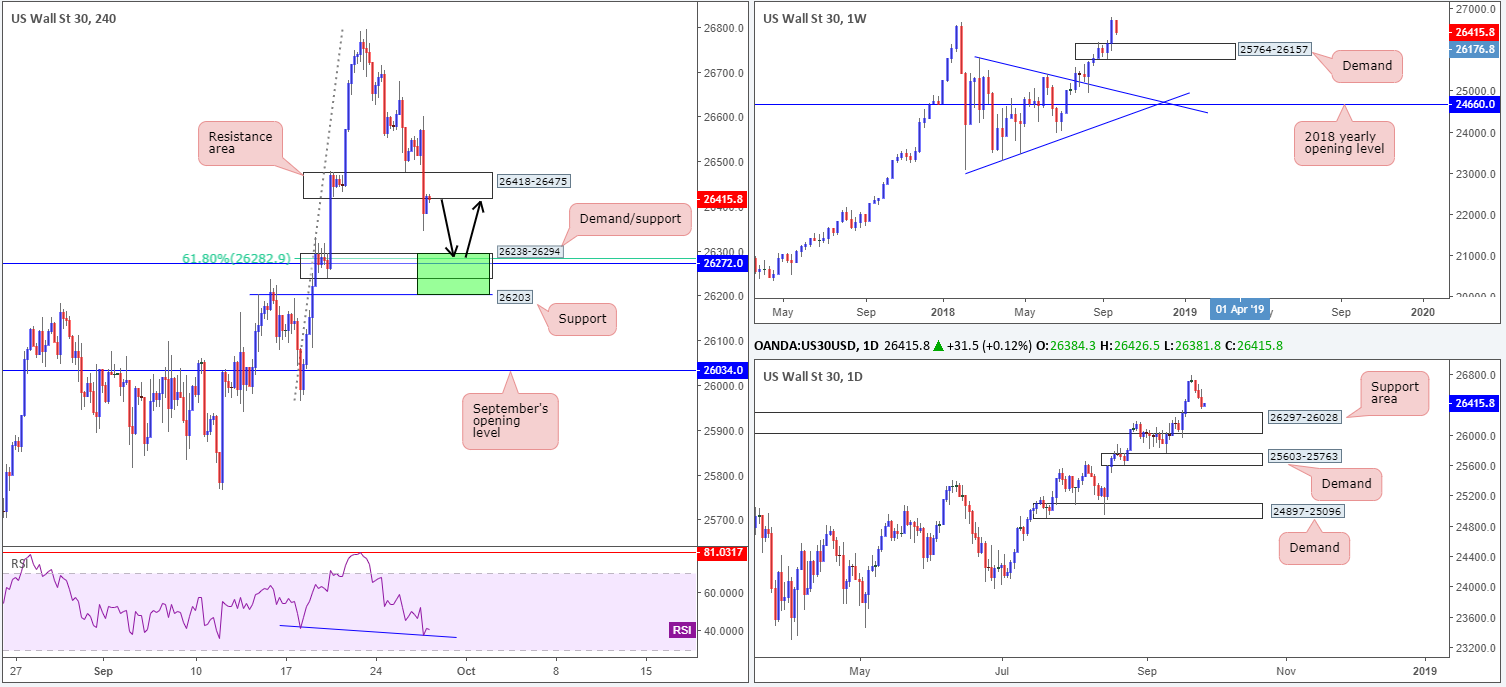
Dow Jones Industrial Average:
The impact of Wednesday’s FOMC rate decision sent US equities to lower ground, consequently engulfing H4 demand drawn from 26418-26475 (now an acting resistance area). Assuming this base upholds as a resistance, the next area of interest on the H4 scale falls in around a H4 demand area coming in at 26238-26294. Traders might also want to note the area houses a notable H4 support level at 26272 and a 61.8% H4 Fib support value penciled in at 26282. Further to this, the H4 RSI indicator is seen displaying a divergence reading.
In addition to the above, as well as the current H4 demand zone at 26238-26294 being positioned around the top edge of a daily support area marked at 26297-26028, the daily zone itself is situated at the top edge of a weekly demand area visible from 25764-26157.
Areas of consideration:
Keeping it simple this morning, we have to go with longs from the H4 demand mentioned above at 26238-26294. Backed by higher-timeframe demands, along with housing a collection of H4 supports, this area is likely to produce something to the upside. There is one caveat to be aware of, though, and that is a possible fakeout to nearby H4 support at 26203. Therefore, stop-loss orders would be best positioned beneath this hurdle, with an initial upside target seen of 26418.
Today’s data points: US core durable goods orders m/m; US final GDP q/q; Fed’s Powell speaks.
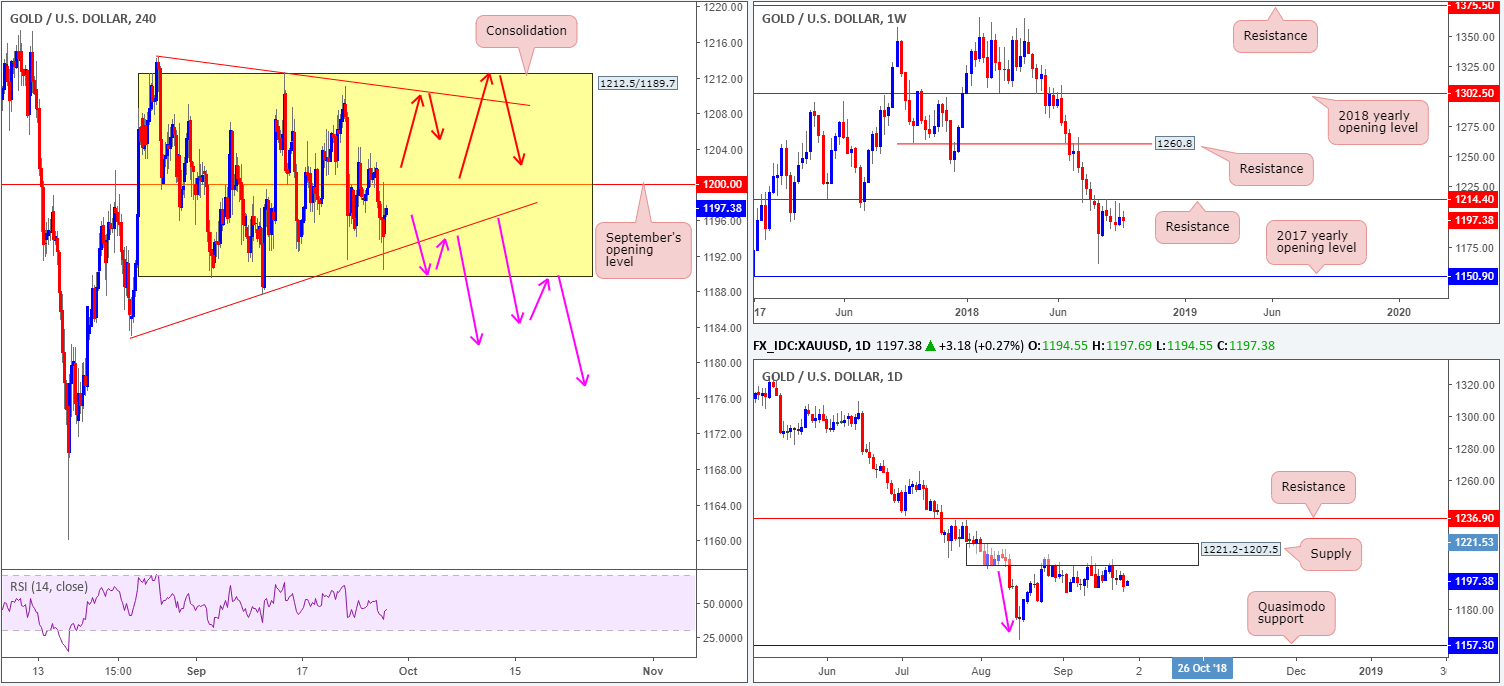
XAU/USD (Gold)
In the metals market, the price of gold deteriorated on Wednesday as the US dollar index eked out marginal gains. On the whole, however, the H4 candles continue to carve out a range between 1212.5/1189.7 (houses September’s opening level at 1200.0). Also eye catching on this scale is the converging trend lines (1182.9/1214.3), so far meeting the characteristics of a bullish pennant formation.
On a wider perspective, though, daily movement continues to respect the underside of a nice-looking supply zone at 1221.2-1207.5. Aside from the base displaying attractive downside momentum (see pink arrow), this area could also be considered the ‘decision point’ to print 2018 yearly lows of 1160.3.
As you can also see on the weekly timeframe, price remains languishing beneath a key resistance level coming in at 1214.4 in the shape of back-to-back bearish pin-bar formations. Further downside from this point could eventually stretch as far south as the 2017 yearly opening level at 1150.9.
The general bias (according to higher-timeframe structure) is pointing in a southerly direction. Therefore, a breakout of the H4 range, and potential failure of the current H4 bullish pennant pattern, will likely occur.
Areas of consideration:
On account of the above conditions, two possible scenarios are still worth noting:
- The most obvious: a breakout of the current H4 range/H4 trend line support to the downside. Following a H4 close beneath either area, a retest to the underside is certainly something to keep an eye open for as sellers may look to make an appearance here (see pink arrows). Traders are advised to wait and see if H4 price prints a bearish candlestick formation at the retest before considering a position short, since this will help avoid falling victim to fakeouts.
- Fade the upper edge of the current H4 range/trend line resistance (see red arrows). Like above, waiting for H4 price action to chalk up a bearish candlestick pattern off the top limit before pulling the trigger is recommended.
The use of the site is agreement that the site is for informational and educational purposes only and does not constitute advice in any form in the furtherance of any trade or trading decisions.
The accuracy, completeness and timeliness of the information contained on this site cannot be guaranteed. IC Markets does not warranty, guarantee or make any representations, or assume any liability with regard to financial results based on the use of the information in the site.
News, views, opinions, recommendations and other information obtained from sources outside of www.icmarkets.com.au, used in this site are believed to be reliable, but we cannot guarantee their accuracy or completeness. All such information is subject to change at any time without notice. IC Markets assumes no responsibility for the content of any linked site. The fact that such links may exist does not indicate approval or endorsement of any material contained on any linked site.
IC Markets is not liable for any harm caused by the transmission, through accessing the services or information on this site, of a computer virus, or other computer code or programming device that might be used to access, delete, damage, disable, disrupt or otherwise impede in any manner, the operation of the site or of any user’s software, hardware, data or property.


