
A note on lower timeframe confirming price action…
Waiting for lower timeframe confirmation is our main tool to confirm strength within higher timeframe zones, andhas really been the key to our trading success. It takes a little time to understand the subtle nuances, however, as each trade is never the same, but once you master the rhythm so to speak, you will be saved from countless unnecessary losing trades. The following is a list of what we look for:
- A break/retest of supply or demand dependent on which way you’re trading.
- A trendline break/retest.
- Buying/selling tails – essentially we look for a cluster of very obvious spikes off of lower timeframe support and resistance levels within the higher timeframe zone.
- Candlestick patterns. We tend to only stick with pin bars and engulfing bars as these have proven to be the most effective.
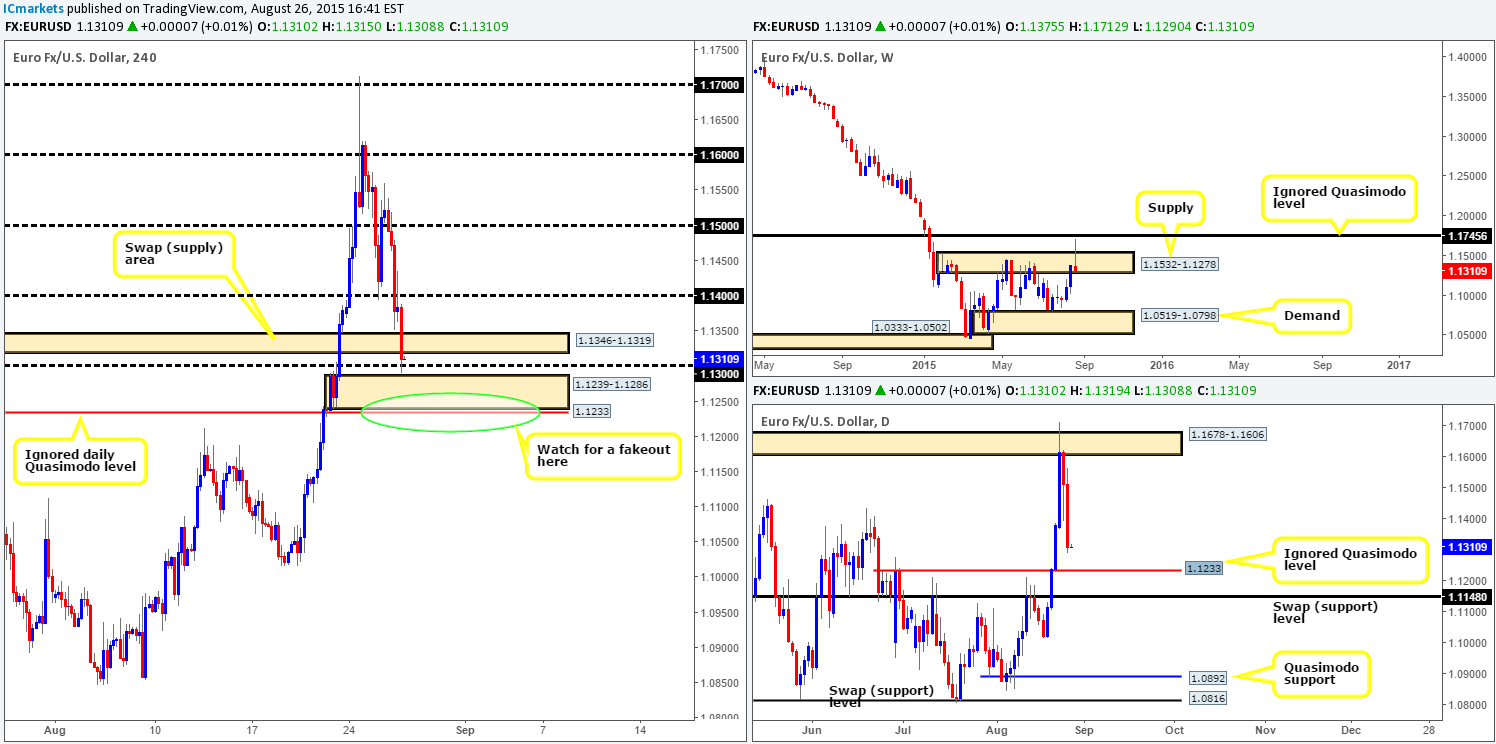
EUR/USD:
The EUR currency declined in value for a second consecutive day yesterday, losing a little over 200 pips going into yesterday’s close 1.1310. This move saw several 4hr technical levels wiped out during its onslaught, ending with price spiking through 1.1300 and missing the 4hr demand area below it at 1.1239-1.1286 by a cat’s whisker. Although price is currently trading at a potential buy zone, the field of vision from here looks rather cramped…
To start with, there is immediate 4hr supply lurking just above current price at 1.1346-1.1319. Furthermore, both the weekly and daily timeframes show there is room to continue diving south. The nearest support, as far as we can see, comes in from the daily scale at an ignored daily Quasimodo level at1.1233 (positioned just below the aforementioned 4hr demand area). This, in itself, could very well tempt well-funded traders to fake below the current 4hr demand zone and take out stops!
Therefore, given the points made above, we shall not be looking to buy this market today unless price fakes below and closes back within the current 4hr demand. Lower timeframe confirmation will still be needed following a fakeout here, however, simply because, as we mentioned above, the path south on the weekly timeframe looks clean down to weekly demand at 1.0519-1.0798. Should this long trade come to fruition, partial profits will be quickly taken at 1.1300. It would only be once/if price closes above and retests this number as support, would we then feel safe to move our stop to breakeven. It will be interesting to see what the day brings!
Levels to watch/live orders:
- Buys:Watch for a fakeout below 4hr demand at then look to enter long with lower timeframe confirmation.
- Sells:Flat (Stop loss: N/A).
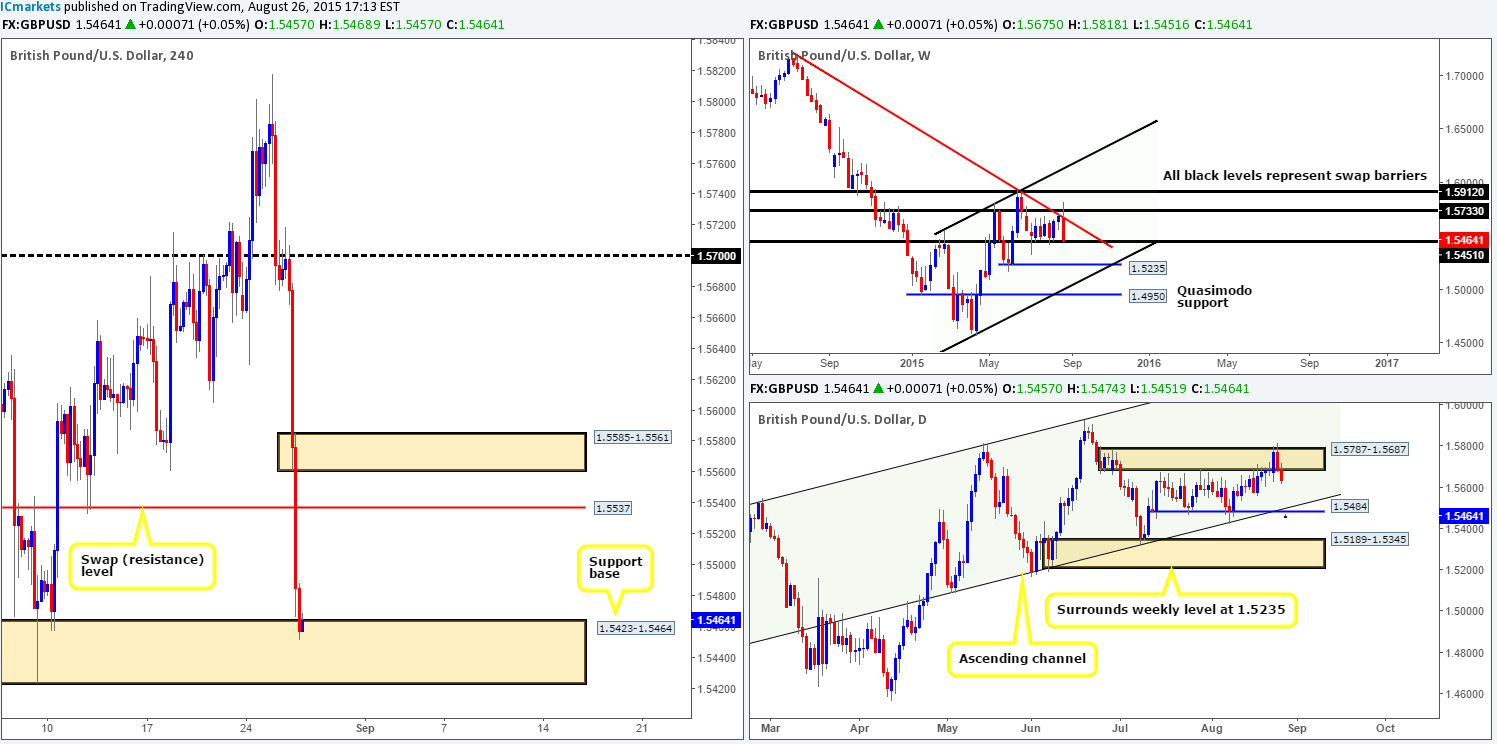
GBP/USD:
Upon opening Cable’s 4hr chart this morning, we were greeted with a sea of red candles! Similar to its bigger brother the EUR/USD, Pound Sterling lost close to 230 pips of value during yesterday’s trade. This saw price take out several 4hr technical levels and eventually collide with a 4hr support base at 1.5423-1.5464.
For those who read our previous report http://www.icmarkets.com/blog/wednesday-26th-august-daily-technical-outlook-and-review/ you may recall us mentioning that if 1.5700 gets retested as resistance, we’d then look to short this market as long as corresponding lower timeframe confirmation was seen. As you can see, this number was retested beautifully, and there was even a picture-perfect setup on the 30 minute timeframe to enter short on the retest of broken support at 1.5681. Unfortunately though, we were not at our desks at that time and MISSED THIS MOVE! Well done to any of our readers who managed to lock in some green pips here!
Consequent to this recent fall, the weekly timeframe shows price now nibbling at bids around the weekly swap (support) level at 1.5451. Meanwhile, on the daily timeframe, price closed below both the daily ascending channel (1.5089/1.5813) and a daily support level at 1.5894.
Taking all of the above into consideration, we feel that Cable will very likely bounce from the current 4hr support base today due to where price is located on the weekly timeframe. As such, our plan of attack for will simply consist of watching for lower timeframe confirmed long entries from this area. Should all go well, we’ll be looking to 1.5537 as our first take-profit base.
Levels to watch/ live orders:
- Buys: 1.5423-1.5464 [Tentative – confirmation required] (Stop loss: 1.5418).
- Sells: Flat (Stop loss: N/A).
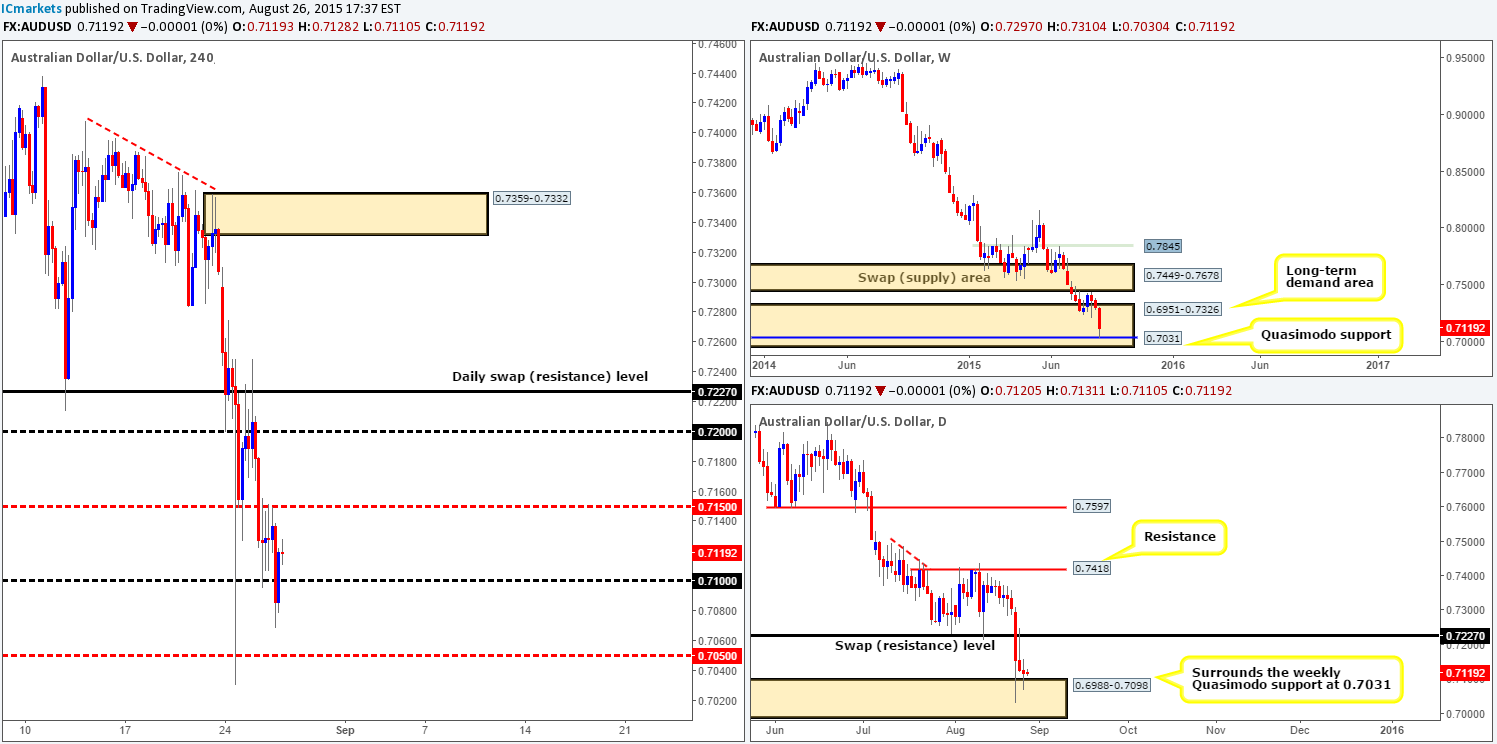
AUD/USD:
Using a top-down approach this morning, our analysis will kick-off with a look at the weekly timeframe. From this angle, price is still currently respecting the weekly Quasimodo support at 0.7031, which, as you can see, is lodged deeply within a long-term weekly demand at 0.6951-0.7326. Turning our attention to the daily chart, we can see that bids are presently supporting the daily demand zone coming in at 0.6988-0.7098. To the upside, the next area of resistance to keep an eye from here falls in at 0.7227.
Yesterday’s 4hr action, however, was a little quieter than the EUR and GBP pairs. The mid-level number 0.7150 was respected as resistance, which eventually did force price beneath 0.7100. As we write price is back trading at yesterday’s opening price level, hence the daily indecision candle printed during yesterday’s session.
Given that on both the weekly and daily timeframes price is trading around demand (see above), is the Aussie pair ready to be bought? Technically, we believe it could be. 0.7100 may provide a nice platform in which to look for confirmed longs today, as could a break above/ retest of 0.7150. However, fundamentallythis pair is suffering heavily from the recent shenanigans in China, which has only added weight to the already relatively strong downtrend it is currently in. Therefore, our team once again has decided to pass on any signals to buy this pair today and take the safest position of them all – FLAT!
Levels to watch/ live orders:
- Buys: Flat (Stop loss: N/A).
- Sells: Flat (Stop loss: N/A).
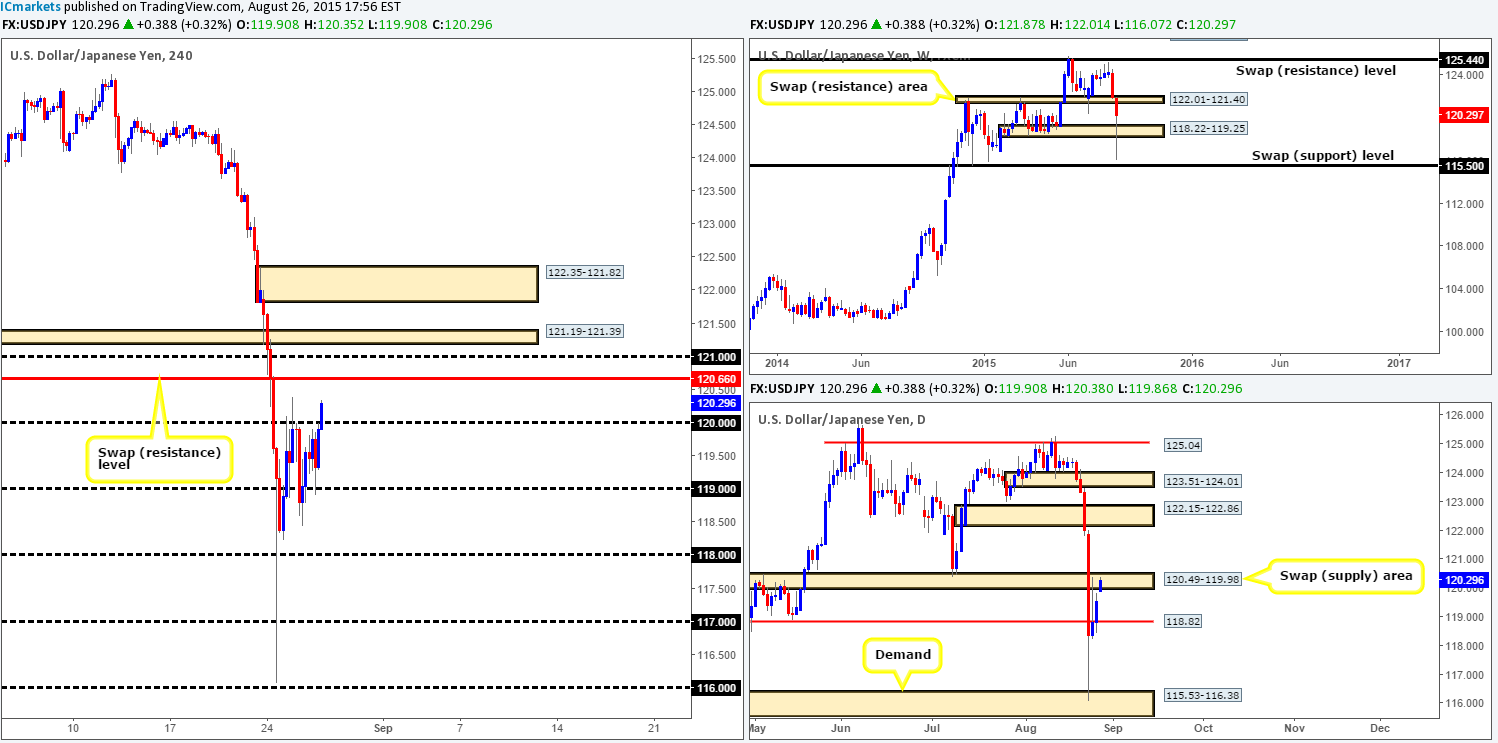
USD/JPY:
Yesterday’s action played out exactly as reported in our previous analysishttp://www.icmarkets.com/blog/wednesday-26th-august-daily-technical-outlook-and-review/. Price broke above 119.00, which was then later retested as support before rallying up to 120.00. As we can all see, this pair exceeded our target expectations and is now currently hovering around the 120.30 region.
With the next 4hr upside resistance level sitting at 120.66, coupled with price trading deep within a daily swap (supply) barrier at 120.49-119.98, this does not leave much room to the upside in today’s sessions. Therefore, even with that huge buying tail currently being painted on the weekly timeframe, we feel it may be more prudent to wait and see if price can CLOSE above the daily swap (supply) area before considering longs. The space between this daily area and the daily swap (supply) area above it at 122.15-122.86 would, in our opinion, make for a fantastic buy opportunity. That being the case, we feel this pair is best left on the back burner until more conducive price action presents itself.
Levels to watch/ live orders:
- Buys: Flat (Stop loss: N/A).
- Sells: Flat (Stop loss: N/A).
USD/CAD:
During the course of yesterday’s sessions we can see that price bounced south from 1.3350, surpassing the round-number support 1.3300, and connecting with 1.3250. This level, as you can see, was clearly enough to support a counter-attack back up to the 1.3300 region which is where this market is currently trading at the moment.
Considering that price is once again trading from daily demand at 1.3246-1.3177, and the weekly timeframe still shows room to appreciate up to weekly swap (resistance) level at 1.3381, where do we go from here? Well, ideally we’d like for price to close above and retest 1.3300 as support, as this will clear the path north up to at least 1.3350. The reason we believe there’s space to move above 1.3300 simply comes from the two very obvious supply consumption wicks marked with green arrows at 1.3335 and 1.3342. Following a possible break/retest of 1.3300, we’d then require some sort of lower timeframe confirming buy signal accompanying the retest, since one can never be sure how stable psychological levels are. With regards to targets, however, obviously our first port of call will be 1.3350. A break above this area would almost certainly see price head towards 1.3381 – the weekly swap (resistance) level which will be where we liquidate our full position.
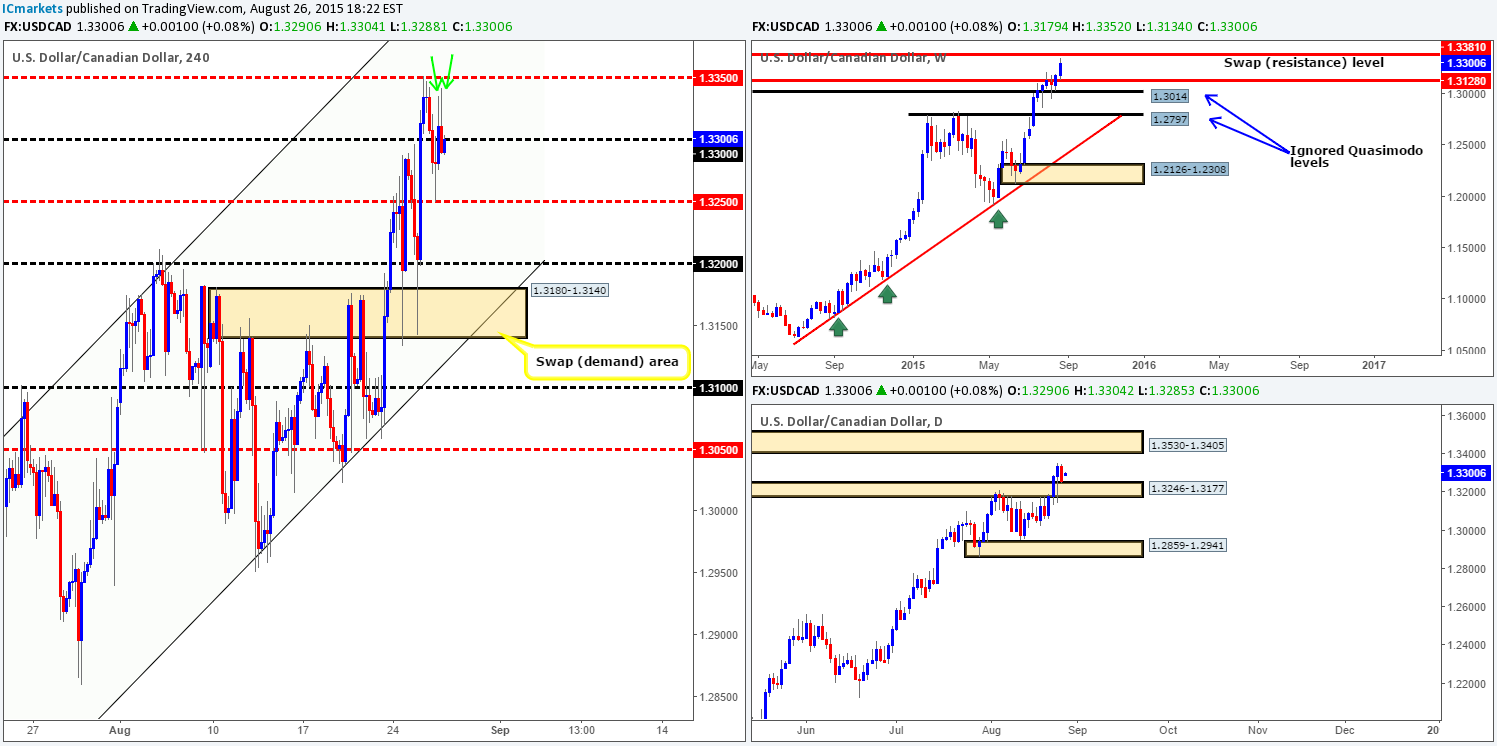
Levels to watch/ live orders:
- Buys: Watch for offers around 0.9300 to be consumed and then look to trade any retest seen at this number (confirmation required).
- Sells:Flat (Stop loss: N/A).
USD/CHF:
The USD/CHF pair, as you can see, rallied for the best part of yesterday’s trade, consequently gaining a little over 160 pips of value. This recent buying brought prices up to the lower limits of a 4hr swap (supply) area at 0.9547-0.9582, which is currently holding prices lower. Taking into account that near-term psychological support lurks just below at 0.9500, selling in between these two levels does not really interest us purely from a risk/reward standpoint.
However, with price not only trading within a daily swap (supply) area at 0.9597-0.9502 right now and also still positioned just below the weekly swap (resistance) level at 0.9512, a short trade could still be possible below 0.9500 today. However, for us to be given the green light to trade this move, we require that price retested 0.9500 following the retest (green arrows) along with corresponding lower timeframe selling confirmation.
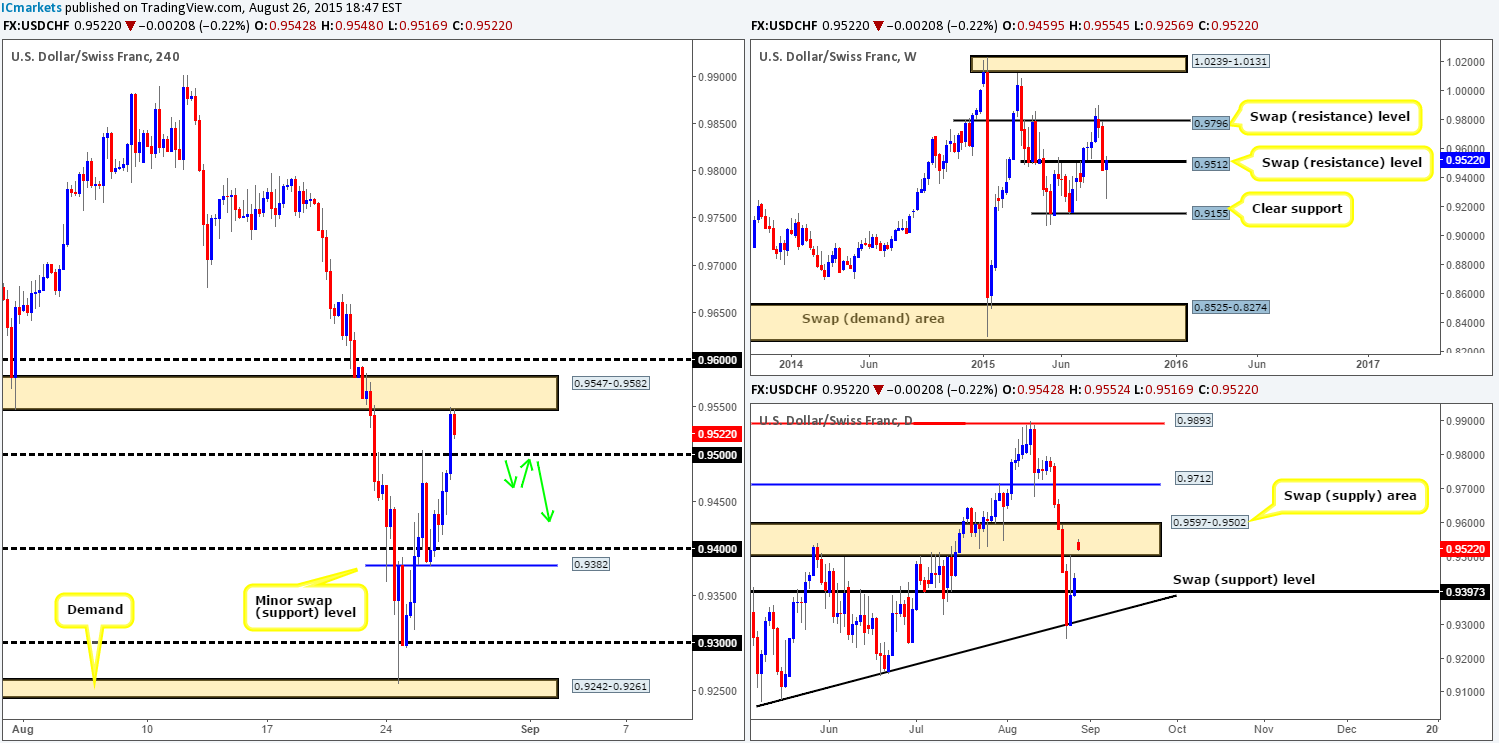
Levels to watch/ live orders:
- Buys: Flat (Stop loss: N/A).
- Sells:Watch for bids around 0.9500 to be consumed and then look to trade any retest seen this number (confirmation required).
DOW 30:
Beginning with the weekly timeframe this morning, we can see that the DOW is currently well-bid from weekly demand coming in at 14717-15245. As a result, this has punched prices back up above the weekly Quasimodo base at 16261. Spinning one lower to the daily timeframe shows that price is currently trading mid-range between two daily swap (supply) zones at 16078-15849/16459-16632.
Turning our attention to the 4hr chart, however, price is seen once again testing the staying power of the 4hr swap (supply) area given at 16285-16386. In view of what we now know from the higher timeframe structures, we feel that this 4hr zone will potentially give way today and price will attack the 4hr swap (resistance) level at 16475. This 4hr level could very well see price rebound lower due to it converging nicely with the lower limits of the daily swap (supply) area at 16459-16632. Therefore, this is certainly a level to have on your watchlists today traders!
If, on the other hand, 16475 is violated today, then the pathway north would likely be clear up to 4hr supply coming in at 16943-16827. This could, in our opinion, provide us with a beautiful long entry into this market should price retest 16475 and display some sort of lower timeframe confirming signal.
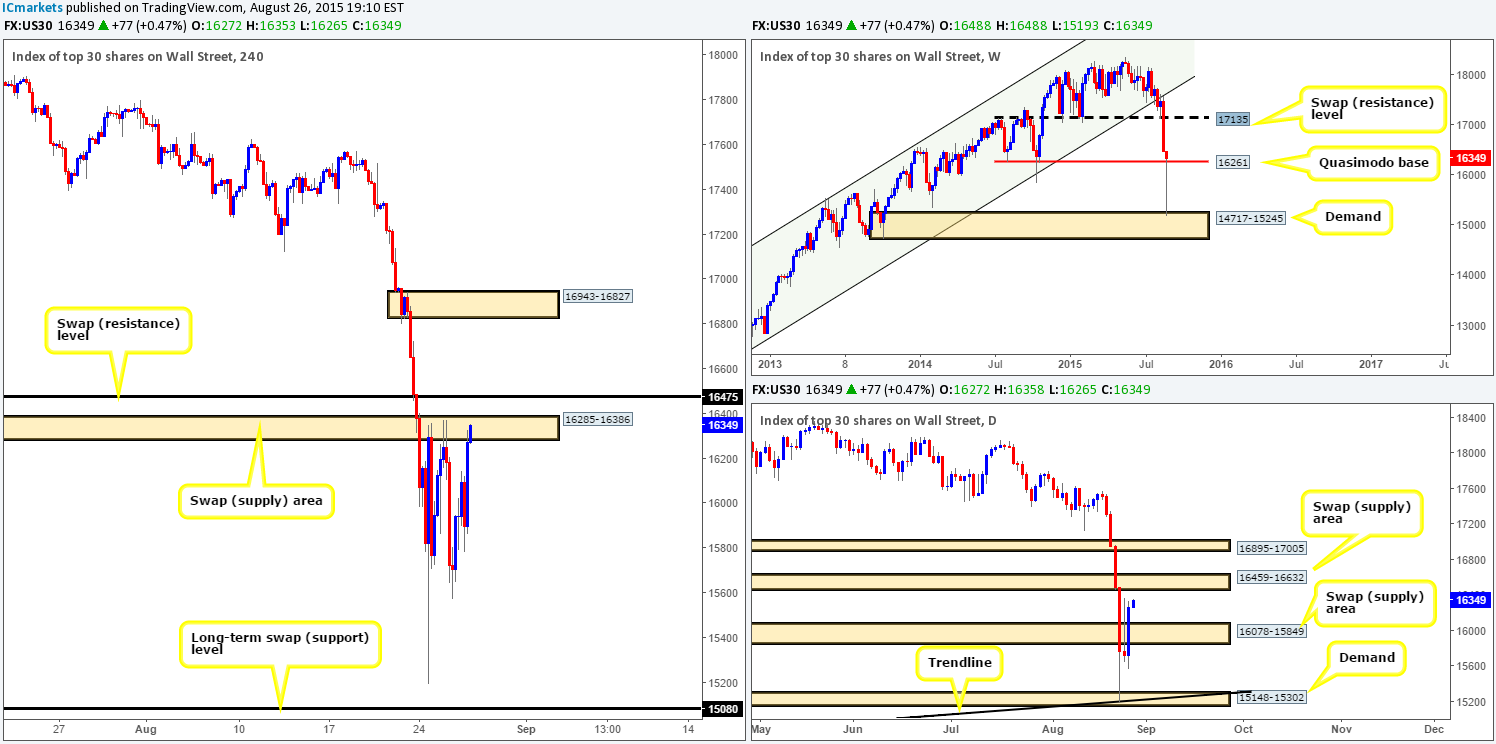
Levels to watch/ live orders:
- Buys: Watch for offers around 16475 to be consumed and then look to trade any retest seen this number (confirmation required).
- Sells:16475 [Tentative – confirmation required] (Stop loss: dependent on where one confirms this level).
XAU/USD: (Gold)
The Gold market dropped for a third consecutive day yesterday, taking out the 4hr swap (demand) area at 1134.5-1128.9, and reaching lows of 1117.6 on the day.
Now, as far as we can see, the overall structure of this market is as follows… From the weekly chart, we can see that the recent selling has brought prices below the weekly swap (support) level at 1130.1. However, looking at the daily chart shows us that price is trading at the top-side of demand coming in at 1109.4-1122.7, which is conveniently located just below the aforementioned weekly level – anyone smelling a fakeout brewing here???
This leaves us with the 4hr timeframe. As you can see, price missed connecting with a 4hr demand area at 1109.4-1116.1 by only a few pips before rebounding higher yesterday. Ultimately, what we would like to see this market do is drop lower and fake below yesterday’s lows 1117.6 and connect with bids around this 4hr zone. The push below yesterday’s lows will likely be attractive to well-funded traders as they know a lot of sell stops will be lurking just below this number – a fantastic pool of liquidity to buy into! That being the case, this 4hr demand area is, in our opinion, a highly confluent platform in which to look for confirmed buying opportunities into this market today.
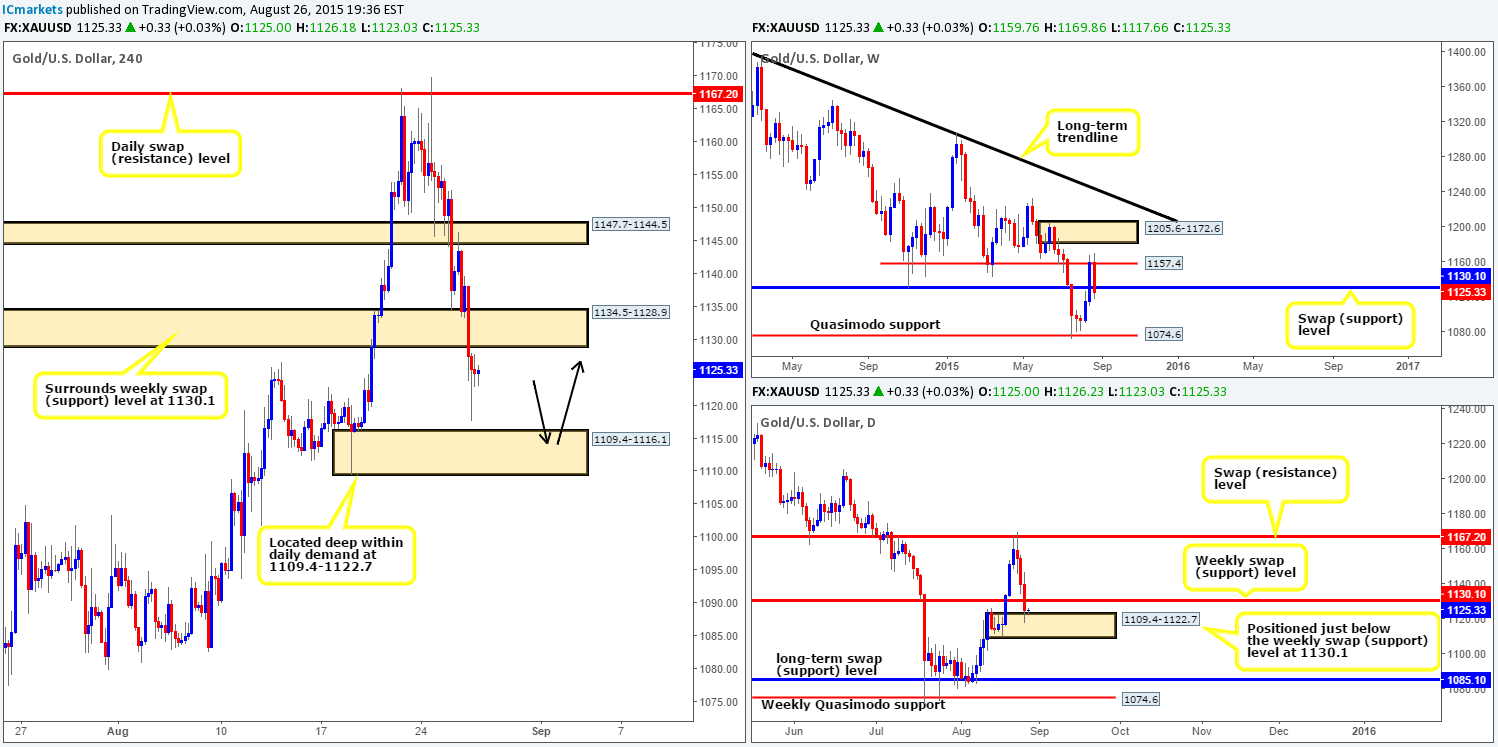
Levels to watch/ live orders:
- Buys: 1109.4-1116.1 [Tentative – confirmation required] (Stop loss: 1108.5).
- Sells: Flat (Stop loss: N/A).


