
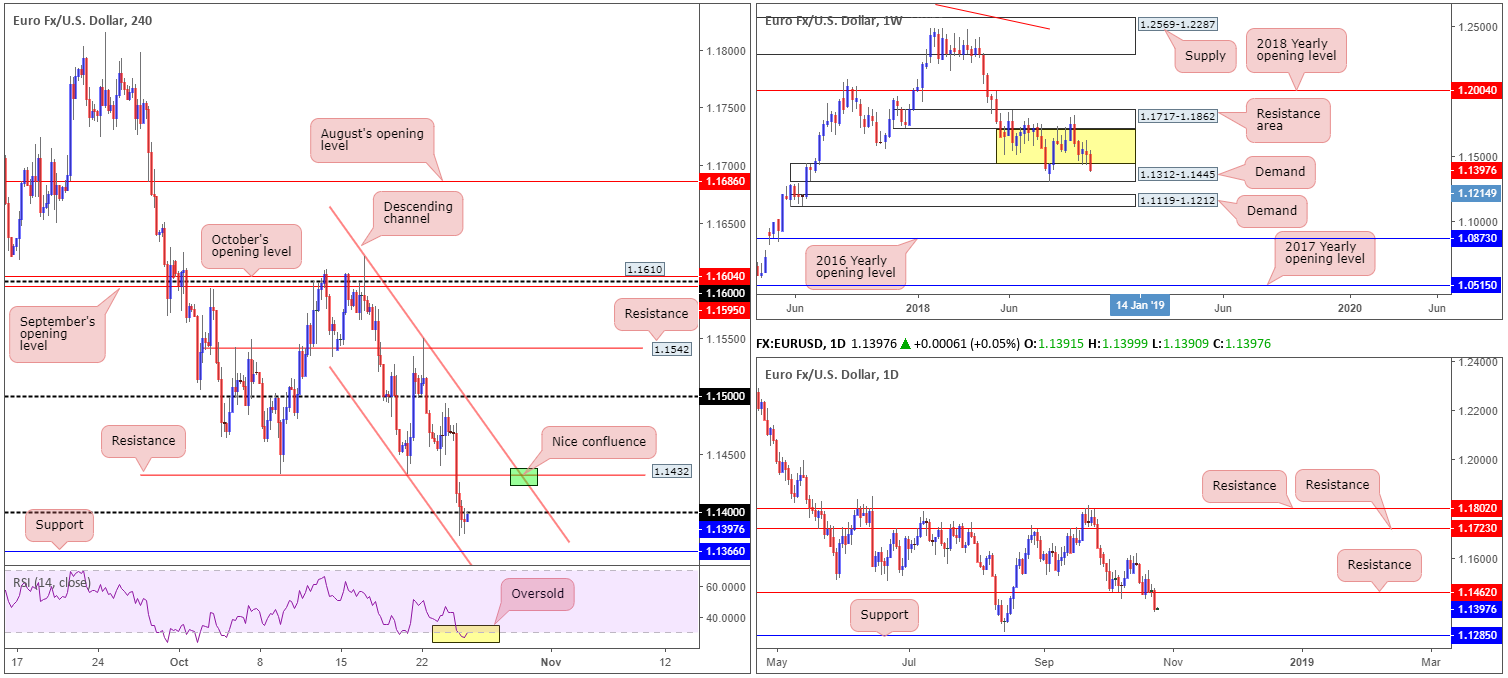
EUR/USD:
Undermined by Italian budget concerns and a slew of disappointing flash Eurozone PMIs, the shared currency plowed lower against its US counterpart Wednesday, down 0.68%. After the EU took unprecedented action in rejecting Italy’s 2019 budget, finance minister Tria continued the nation’s confrontational and defiant stance against the EU, stating the budget is correct and sees no reason to present the EU with a new one.
Longer term, weekly movement is searching for bidders within the walls of demand at 1.1312-1.1445. Failure to support this area may result in the unit eventually shaking hands with demand plotted at 1.1119-1.1212. In terms of daily structure, support at 1.1462 – a level which boasts notable history dating as far back as early 2015 – was engulfed yesterday (now acting resistance) in strong fashion. According to this timeframe, the pathway south is now potentially clear for a run towards the 1.1301 August 15 low, followed closely by support sited at 1.1285.
Lower down the curve on the H4 chart, the market witnessed a number of key supports suffer at the hands of recent selling, most notable being the break of 1.14, which has already been retested as resistance. Should 1.14 hold ground as resistance, support at 1.1366 is likely on the hit list.
Areas of consideration:
An intraday sell from 1.14 is an option this morning, though do remain aware although we have daily action supporting lower prices from here, weekly flow still resides within demand.
Should 1.14 fail to hold price lower, intraday eyes will likely be on resistance at 1.1432, specifically at the point where the channel resistance (extended from the high 1.1621) intersects with the level (green zone). Again, though, do remain cognizant of where the market is trading on the higher timeframes before pulling the trigger.
For conservative traders unsure of 1.14 and 1.1432 as sell zones, waiting for additional candlestick confirmation to form, be it on the H4 or lower timeframes, may be an option. Not only will this help display seller intent, it’ll also offer entry/stop parameters (defined by the selected candlestick structure).
Today’s data points: Spanish unemployment rate; German IFO business climate survey; ECB monetary policy decision and press conference; US durable goods orders m/m; FOMC member’s Clarida and Mester speak.
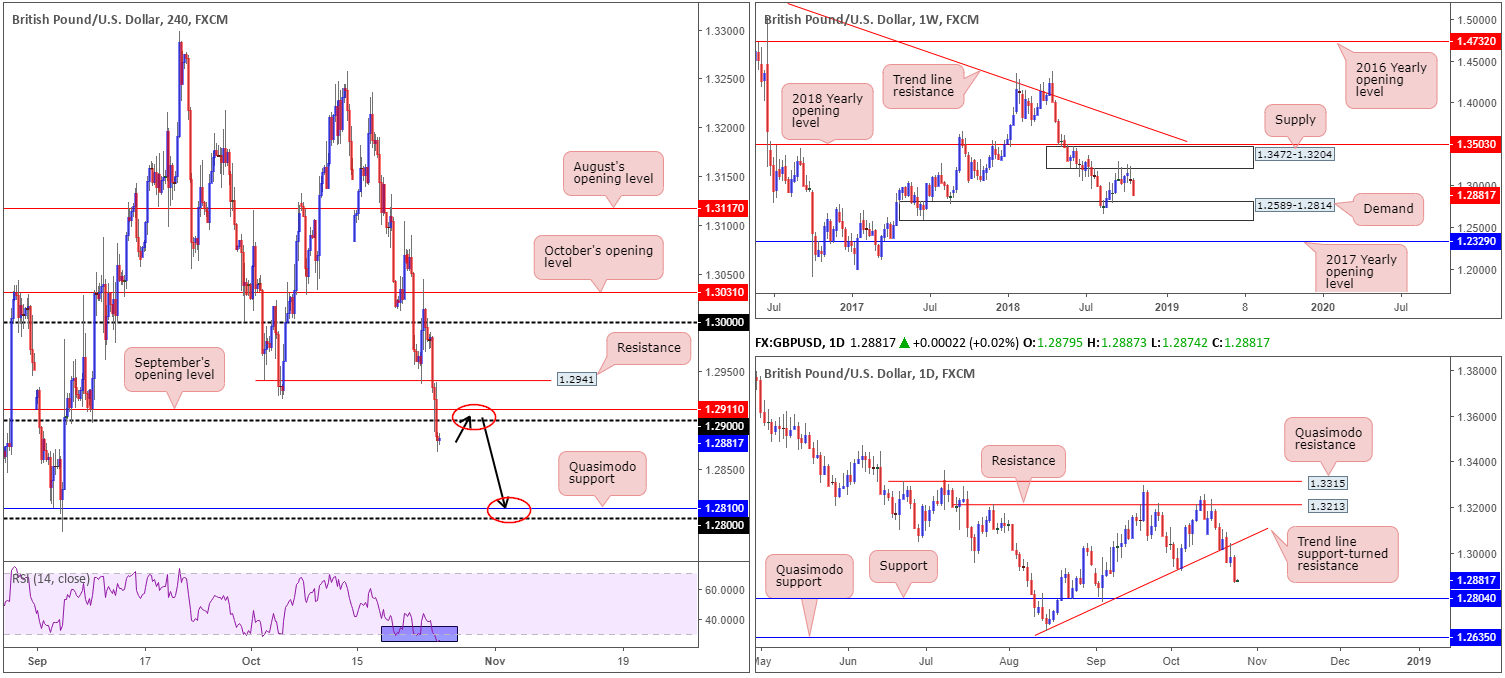
GBP/USD:
Ongoing Brexit uncertainty, coupled with a healthy greenback, weighed on the British pound Wednesday. Down 0.80% on the day, shaped by a near-full-bodied daily bearish candle, the technical picture on all three timeframes we watch display a bearish tone.
Beginning with a look at the weekly timeframe, price is seen pressing for lower ground after shaking hands with supply at 1.3472-1.3204 the week prior. The next downside objective on this scale falls in around demand at 1.2589-1.2814.
In conjunction with weekly flow, daily movement witnessed a firm break/retest of trend line support (extended from the low 1.2661) on Tuesday in the shape of a bearish pin-bar formation. This generated further selling Wednesday, opening up the possibility of a test being seen at nearby support drawn from 1.2804 (housed within the upper limit of weekly demand at 1.2589-1.2814).
The higher timeframe’s bearish vibe is also echoed lower down on the H4 timeframe. A number of technical supports were engulfed Wednesday, most notable being the 1.29 handle. Breaking this number has perhaps unlocked downside towards Quasimodo support at 1.2810, shadowed closely by 1.28.
Areas of consideration:
Having seen all three timeframes highlight a sellers’ market right now, today’s high spot focuses on shorts from 1.2911/1.29 on the H4 timeframe.
A retest of 1.29 (black arrows) holding by way of a bearish candlestick formation from either H4 or H1 (stop/entry parameters can be applied according to the selected candlestick structure) is, given the overall technical picture, considered a high-probability selling opportunity. As for take-profit targets, 1.2814 (the top edge of weekly demand) is the first level in line, followed by H4 Quasimodo support at 1.2810 and then daily support at 1.2804/the 1.28 handle (H4).
Today’s data points: US durable goods orders m/m; FOMC member’s Clarida and Mester speak.
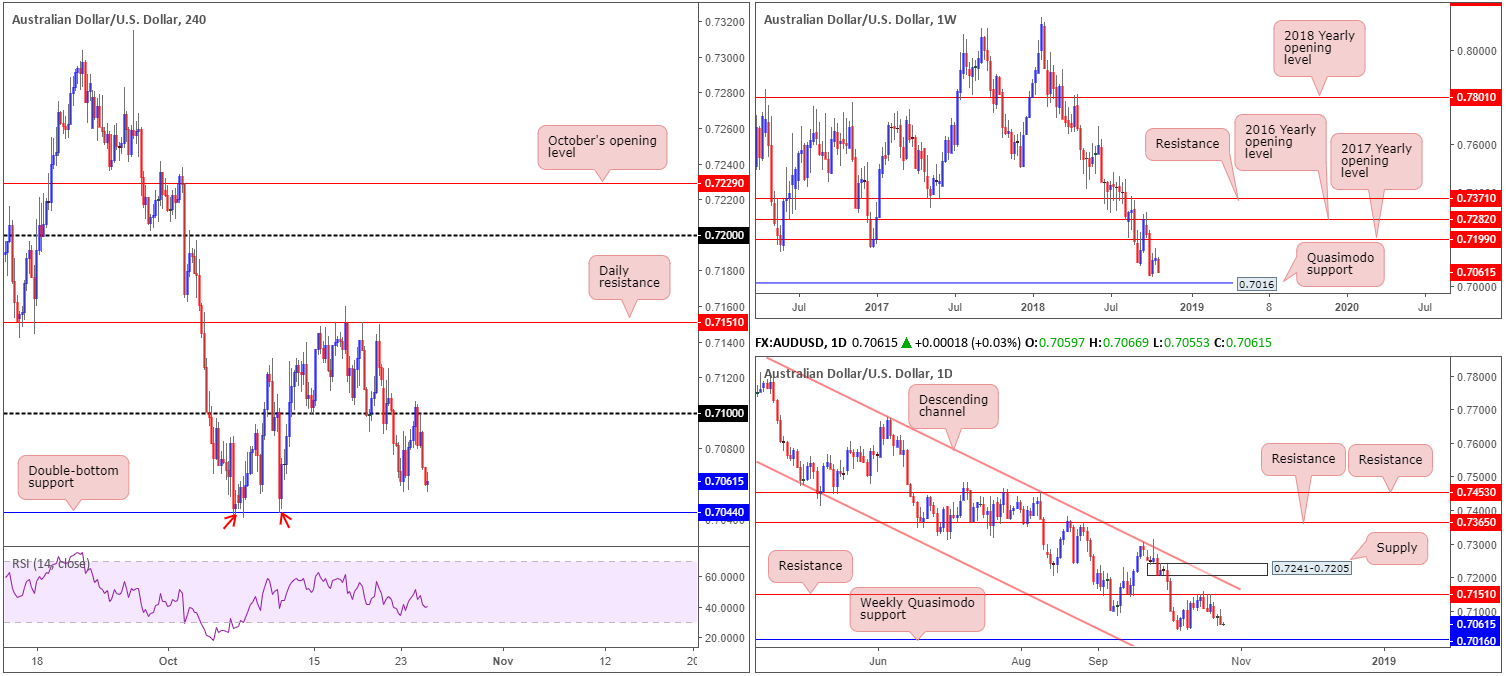
AUD/USD:
For folks who read Wednesday’s briefing you may recall the piece shined the spotlight on the 0.71 handle as a possible sell zone. As you can see, price connected with the psychological number going into early European hours and dipped to lows of 0.7058 into the US close. The main catalyst behind the move was largely due to USD strength, lifting the US dollar index firmly above its 96.00 mark. Well done to any of our readers who managed to jump aboard this train.
Downside targets from 0.71 reside at the H4 double-bottom support positioned at 0.7044, followed by weekly Quasimodo support at 0.7016. Traders are urged to consider reducing risk to breakeven and taking partial profits off the table ahead of 0.7044, while holding the remainder of the position for a possible run towards 0.7016, as both the weekly and daily timeframes suggest.
Areas of consideration:
Aside from selling 0.71, a break of the H4 double-bottom support at 0.7044, as we already know, likely clears the path south towards the weekly Quasimodo support at 0.7016. An intraday sell on the break/retest of 0.7044 is, therefore, an option, though we must stress keeping risk/reward considerations at the forefront of the analysis here! Between 0.7044 and 0.7016, less than 30 pips of room is seen.
Today’s data points: US durable goods orders m/m; FOMC member’s Clarida and Mester speak.
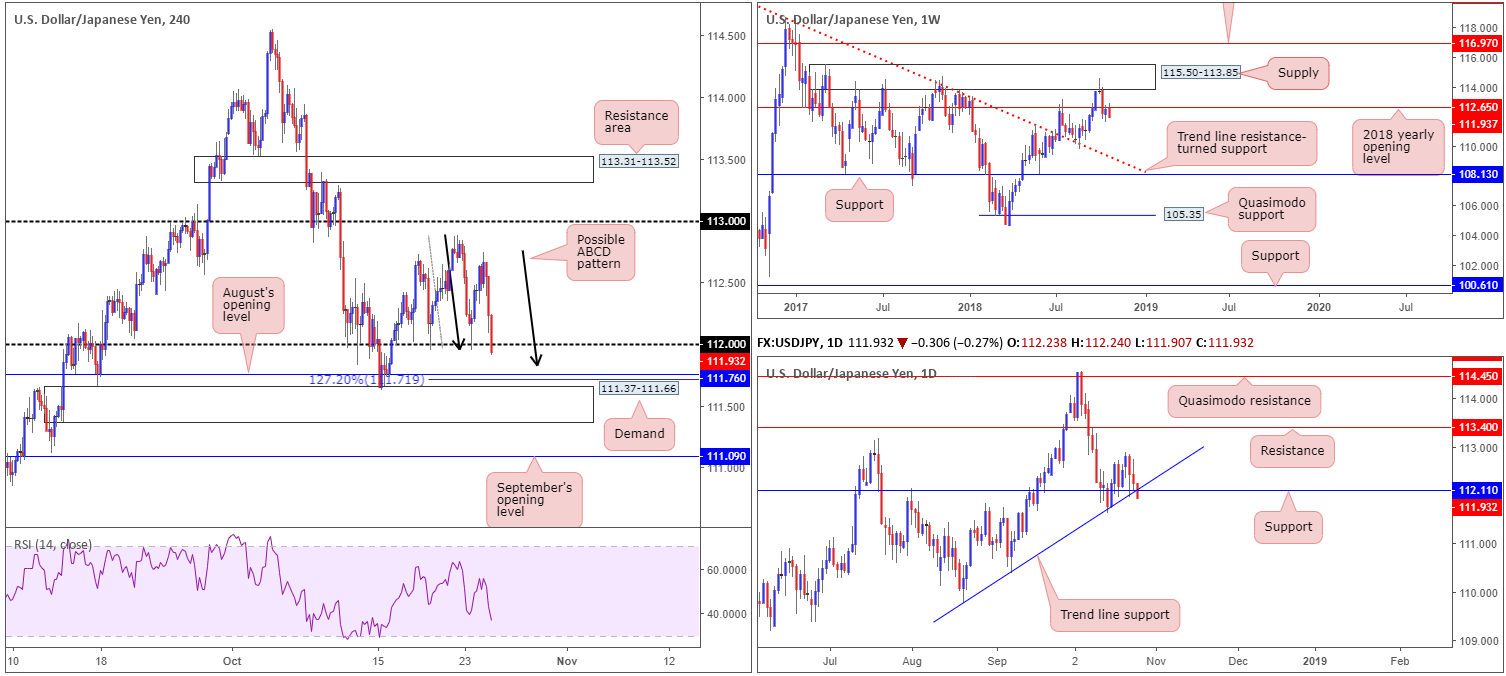
USD/JPY:
Although USD/JPY movement achieved highs of 112.74 in early US trade Wednesday, a sour tone on the back of weaker US equities hauled the pair back towards its 112 handle into the closing bell.
With H4 action seen exploring ground beneath 112, as we write, August’s opening level at 111.76, followed closely by an ABCD (black arrows) 127.2% completion point at 111.71 and H4 demand at 111.37-111.66 are seen close by. According to the weekly timeframe, this is a chancy market to buy (at least with a medium-term view) right now as price recently respected the underside of its 2018 yearly opening level at 112.65. In addition to this, the market observed a break of daily support at 112.11/trend line support (taken from the low 109.77) yesterday. Both weekly and daily timeframes show room to stretch much lower beneath their respective supports, too!
Areas of consideration:
While the higher timeframes are indicating further downside may be on the cards, a bounce from the top edge of H4 demand mentioned above at 111.37-111.66 is certainly not out of the question this morning. Ideally, the lower one can buy within the H4 demand (with stops tucked beneath its lower edge), the better the risk/reward parameters as 112 is valid resistance. Ultimately, though, a break of 112 back to the upside is the ideal scenario here.
Today’s data points: US durable goods orders m/m; FOMC member’s Clarida and Mester speak.
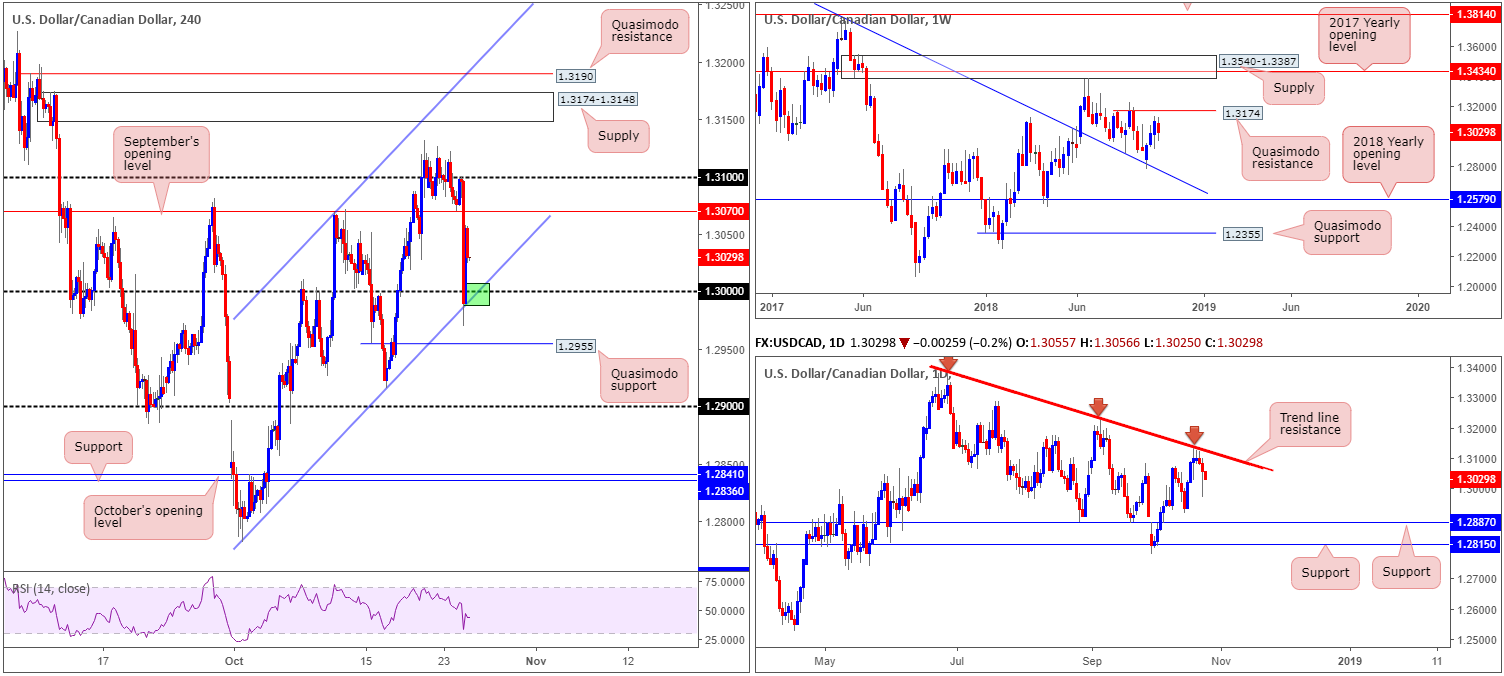
USD/CAD:
The Bank of Canada raised rates by 25bps Wednesday, and removed language it would continue to hike at a gradual pace. This, as you can see, immediately sent the USD/CAD to lower ground, mildly surpassing key 1.30 support on the H4 timeframe before rotating higher off nearby channel support (etched from the low 1.2782) and reclaiming a large portion of recent losses.
According to our technical studies, the weekly timeframe still shows room to advance as far north as the Quasimodo resistance at 1.3174. Daily flow, on the other hand, recently levelled off in the shape of three back-to-back candlestick wicks around trend line resistance (etched from the high 1.3386). Downside from here shows room to push lower, with supportive structure not expected to emerge until 1.2887.
Areas of consideration:
On the whole, the point where the H4 channel support and key figure 1.30 merge (green) is an area worth watching today for a possible bounce higher. From here, limited resistance is seen until reaching 1.3070. Given psychological numbers are prone to fakeouts, however, waiting for additional candlestick confirmation before pulling the trigger is recommended.
A break beyond 1.30 will likely have H4 traders honing in on Quasimodo support at 1.2955. Unfortunately this level houses little higher-timeframe confluence so only a bounce can be expected from here.
Today’s data points: US durable goods orders m/m; FOMC member’s Clarida and Mester speak.
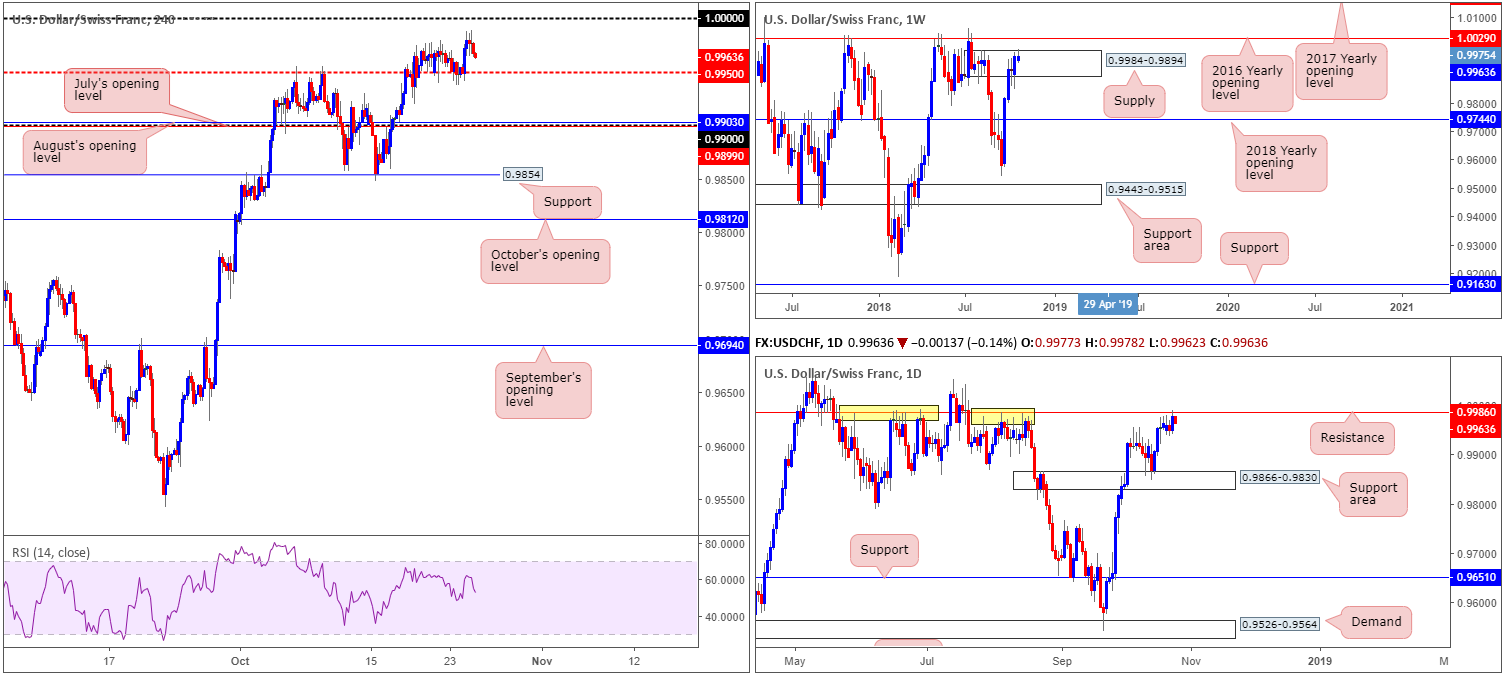
USD/CHF:
For those who read Wednesday’s briefing you may recall the report highlighted daily resistance at 0.9986 as a possible sell zone (check out its recent history holding price action lower [yellow points] – it’s impressive), with conservative stop-loss orders placed above the 2016 yearly opening level at 1.0029 on the weekly timeframe (this helps clear any fakeout play around 1.0000 on the H4, which, as most are already aware, is common viewing around psychological numbers). Also worth noting is the daily resistance is seen positioned two pips above the top edge of weekly supply at 0.9984-0.9894.
As you can see, price connected with 0.9986 yesterday and is thus far holding price action lower, eyeing a possible test of the 0.9950 support on the H4 timeframe.
As per Wednesday’s report, the first area of concern is 0.9950, therefore, those who are short will want to keep eyes on this level today for signs of bullish intent. A break of this level, on the other hand, will likely bring the unit towards the 0.99 handle, surrounded by two monthly opening levels from July (0.9899) and August (0.9903).
Areas of consideration:
Aside from selling 0.9986, a break of 0.9950, as we already know, likely clears the path south towards the 0.99 handle on the H4 timeframe. An intraday sell on the break/retest (preferably in the shape of a bearish candlestick formation – entry/stop levels can be defined by the selected candle structure) of 0.9950 is, therefore, an option.
Today’s data points: US durable goods orders m/m; FOMC member’s Clarida and Mester speak.
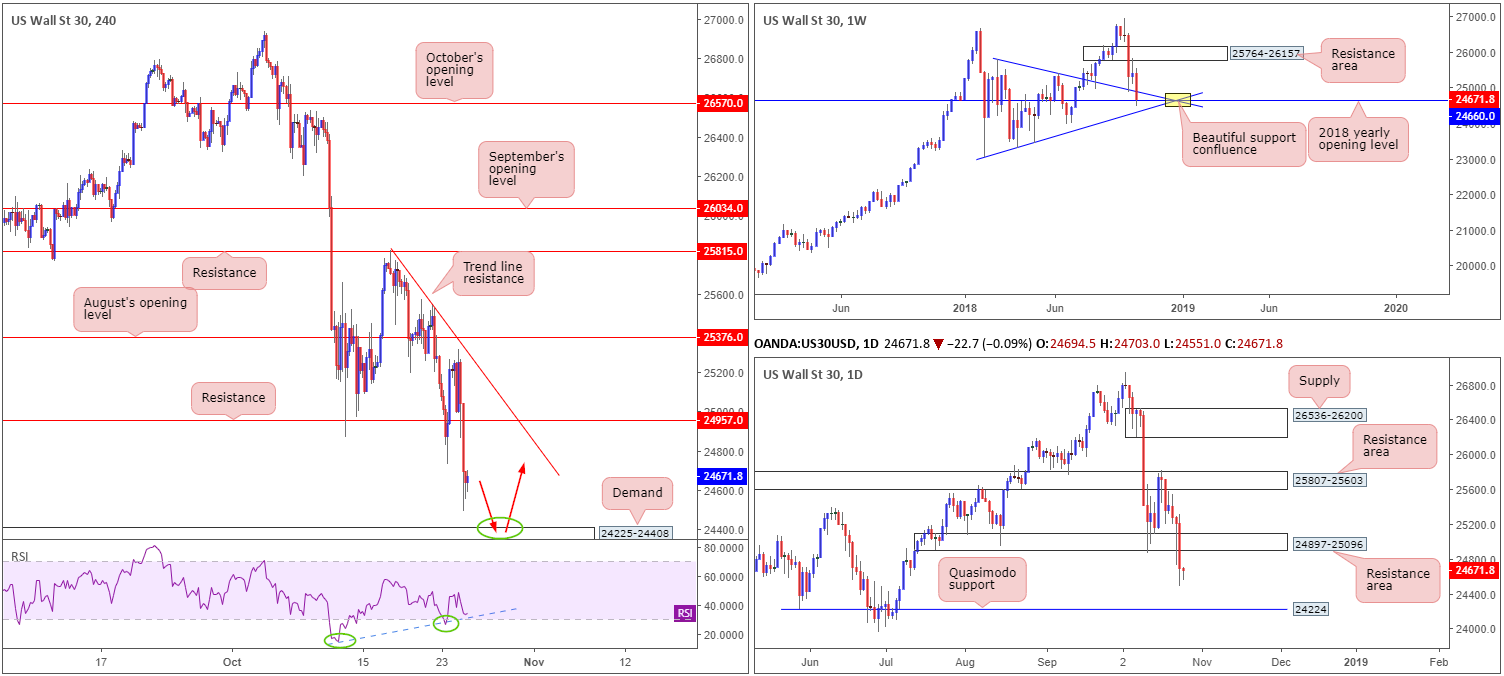
Dow Jones Industrial Average:
Down over 2.00% on the day, the Dow Jones Industrial Average took out a number of key supports during Wednesday’s session.
Kicking things off with a glance over weekly structure sees price action surpass trend line resistance-turned support (taken from the high 25807), and shake hands with its 2018 yearly opening level at 24660. Turning the focus over to the daily timeframe, the support area at 24897-25096 was taken out (now acting resistance area), potentially freeing the runway south towards Quasimodo support at 24224.
Interestingly, on the H4 timeframe, demand at 24225-24408 is in view, which happens to be positioned a point north of the daily Quasimodo support mentioned above at 24224. Another key point to note on the H4 timeframe is the RSI indicator is seen displaying a strong bullish divergence reading at the moment.
Areas of consideration:
Having seen weekly price engage with its 2018 yearly opening level at 24660, longs from the current H4 demand area are a possibility today. For conservative traders concerned over the prospect of a fakeout beneath the demand base, waiting for additional candlestick confirmation to form on the H4 timeframe may be an option. Not only will this help display buyer intent, it’ll also offer entry/stop parameters (defined by the selected candlestick structure).
Today’s data points: US durable goods orders m/m; FOMC member’s Clarida and Mester speak.
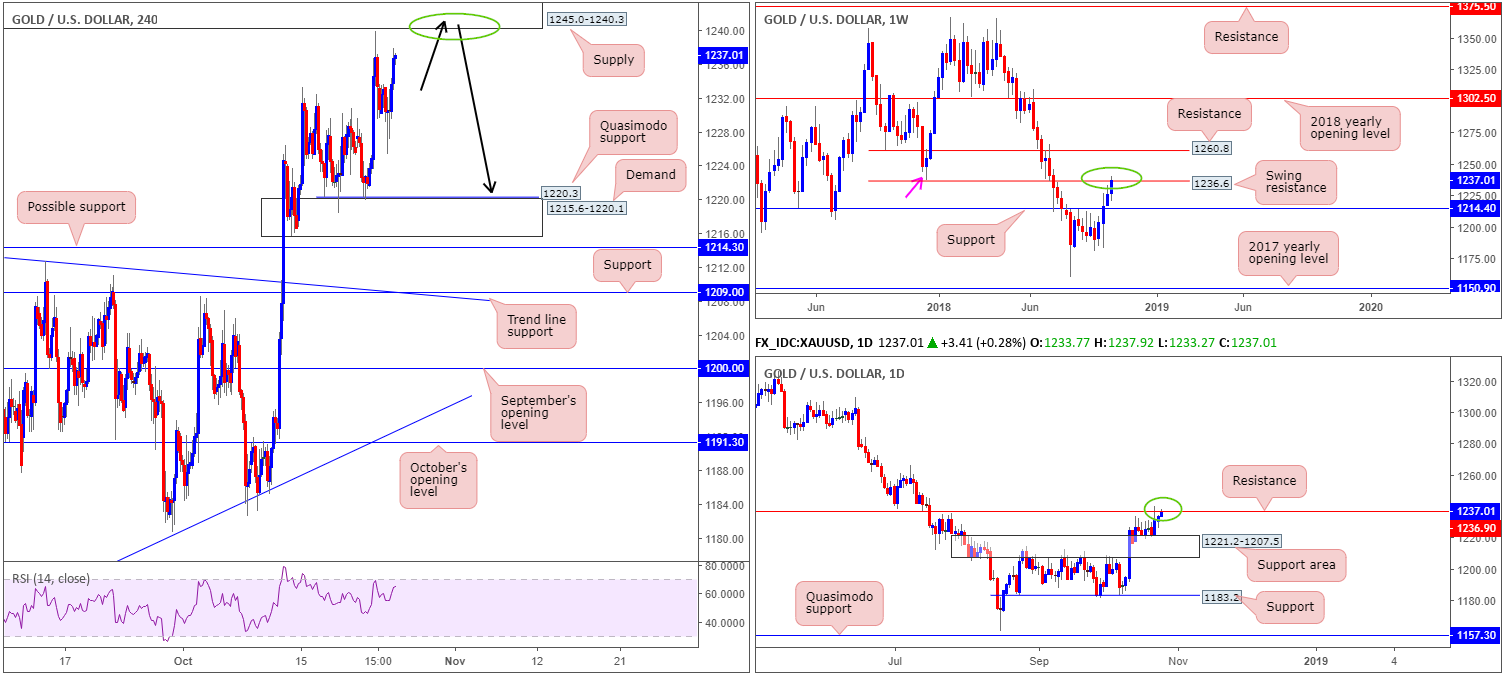
XAU/USD (Gold):
Despite the price of gold advancing 0.27% against its US counterpart Wednesday, the technical outlook remains unchanged. The H4 supply zone coming in at 1245.0-1240.3 is an area of interest. This is largely due to the strong drop out of the supply area’s base (mid-July 2018), the H4 RSI indicator seen approaching its overbought value, as well as being positioned within close proximity to higher-timeframe resistances. On the weekly timeframe, we can see price action is testing swing resistance (pink arrow) at 1236.6, which essentially represents daily resistance at 1236.9.
Areas of consideration:
As highlighted in Wednesday’s report, traders have several options here in regards to entry. Here’s two:
- Entering short at (market) 1240.3 and locating stops above 1245.0. This is considered aggressive to some traders.
- Or for conservative traders, waiting for additional candlestick confirmation and entering based on this structure.
The use of the site is agreement that the site is for informational and educational purposes only and does not constitute advice in any form in the furtherance of any trade or trading decisions.
The accuracy, completeness and timeliness of the information contained on this site cannot be guaranteed. IC Markets does not warranty, guarantee or make any representations, or assume any liability with regard to financial results based on the use of the information in the site.
News, views, opinions, recommendations and other information obtained from sources outside of www.icmarkets.com.au, used in this site are believed to be reliable, but we cannot guarantee their accuracy or completeness. All such information is subject to change at any time without notice. IC Markets assumes no responsibility for the content of any linked site. The fact that such links may exist does not indicate approval or endorsement of any material contained on any linked site.
IC Markets is not liable for any harm caused by the transmission, through accessing the services or information on this site, of a computer virus, or other computer code or programming device that might be used to access, delete, damage, disable, disrupt or otherwise impede in any manner, the operation of the site or of any user’s software, hardware, data or property.


